Los Angeles metropolitan area
Coordinates: 34°N 118°W / 34°N 118°W
| Los Angeles Metropolitan Area | |
|---|---|
| Los Angeles–Long Beach–Anaheim | |
 | |
| Coordinates: 33°54′N 118°15′W / 33.9°N 118.25°W | |
| Country | United States |
| State(s) | California |
| Largest city | Los Angeles |
| Other cities |
– Long Beach – Anaheim – Santa Ana – Irvine – Glendale – Huntington Beach – Santa Clarita |
| Area | |
| • Total | 4,850.3 sq mi (12,562 km2) |
| Highest elevation | Mount San Antonio 10,068 ft (3,069 m) |
| Lowest elevation | Wilmington −9 ft (-3 m) |
| Population | |
| • Total | 12,828,837 (2,010) |
| • Rank | 2nd in the U.S. |
| • Density | 2,645.0/sq mi (1,024.7/km2) |

The Los Angeles metropolitan area, also known as Metropolitan Los Angeles or the Southland,[1] is the 13th largest metropolitan area in the world and the second-largest metropolitan area in the United States.[2] It is entirely located in the southern portion of the U.S. State of California.
The metropolitan area is defined by the Office of Management and Budget as the Los Angeles-Long Beach-Anaheim, CA Metropolitan Statistical Area (MSA), consisting of Los Angeles and Orange counties, a metropolitan statistical area used for statistical purposes by the United States Census Bureau and other agencies.[3] Its land area is 4,850 sq. mi (12,562 km²).
Los Angeles and Orange counties are the first and third most populous counties in California respectively, and Los Angeles, with 9,819,000 people in 2010, is the most populous county in the United States. The combined Los Angeles metropolitan area is home to 18.2 million people, making it the most populous metropolitan area in the western United States and the largest in area in the United States. The metro area has at its core the Los Angeles-Long Beach-Anaheim corridor, an urbanized area defined by the Census Bureau with a population 12,150,996 as of the 2010 Census.
The Census Bureau also defines a wider region based on commuting patterns, the Los Angeles-Long Beach, CA Combined Statistical Area (CSA), more commonly known as the Greater Los Angeles Area, with an estimated population of 18,238,998.[4] This includes the three additional counties of Ventura, Riverside, and San Bernardino. The total land area of the combined statistical area is 33,955 sq. mi (87,945 km²).
Definitions

The counties and county groupings comprising the Los Angeles Metropolitan Area are listed below with 2012 U.S. Bureau of the Census estimates of their populations.[5]
Los Angeles-Long Beach-Anaheim, CA Metropolitan Statistical Area (12,828,837)
- Los Angeles-Long Beach-Glendale, CA Metropolitan Division (9,818,605)
- Los Angeles County (9,818,605)
- Anaheim-Santa Ana-Irvine, CA Metropolitan Division (3,010,232)
- Orange County (3,010,232)
Major divisions of the Los Angeles-Long Beach-Anaheim, CA Metropolitan Statistical Area
- East: Eastside, San Gabriel Valley, Pomona Valley
- West: Westside, Beach Cities
- South: South Bay, Palos Verdes Peninsula, South Los Angeles, Gateway Cities, North Orange County, South Orange County
- North: San Fernando Valley, portions of the Antelope Valley and Santa Clarita Valley
- Central: Downtown Los Angeles, Mid-Wilshire
In addition to the Los Angeles-Long Beach-Anaheim, CA Metropolitan Statistical Area, the following Metropolitan Statistical Areas are also included in the Los Angeles-Long Beach, CA Combined Statistical Area (total pop. 18,238,998):[5]
- Oxnard-Thousand Oaks-Ventura, CA Metropolitan Statistical Area (835,981)
- Ventura County (835,981)
- Riverside-San Bernardino-Ontario, CA Metropolitan Statistical Area (4,350,096)
- Riverside County, California (2,268,783)
- San Bernardino County, California (2,081,313)
Urban areas of the region

The Los Angeles-Long Beach, CA CSA is a multicore metropolitan region containing several urban areas.
Urban areas
The combined statistical area is a multicore metropolitan region containing several urban areas.
| Population Rank |
Urbanized Area | 2010 Population |
|---|---|---|
| 2 | Los Angeles-Long Beach-Anaheim | 12,150,996 |
| 22 | Riverside-San Bernardino | 1,932,666 |
| 69 | Mission Viejo-Lake Forest-San Clemente | 583,681 |
| 87 | Murrieta-Temecula-Menifee | 441,546 |
| 103 | Oxnard | 367,260 |
| 111 | Indio-Cathedral City | 345,580 |
| 112 | Lancaster-Palmdale | 341,219 |
| 114 | Victorville-Hesperia | 328,454 |
| 146 | Santa Clarita | 258,653 |
| 168 | Thousand Oaks | 214,811 |
| 205 | Hemet | 163,379 |
| 254 | Simi Valley | 125,206 |
| 386 | Camarillo | 71,772 |
Cities
Principal cities

The following is a list of cities with populations over 50,000 in the Los Angeles metropolitan area with 2011 United States Census Bureau estimates of their population.[6] Cities in bold are considered principal cities of the metropolitan area by the Census Bureau, which represent significant employment centers:[7]
|
|
|
Economy


The economy of the Los Angeles metropolitan area is famously and heavily based on the entertainment industry, with a particular focus on television, motion pictures, interactive games, and recorded music – the Hollywood district of Los Angeles and its surrounding areas are known as the "movie capital of the United States" due to the region's extreme commercial and historical importance to the American motion picture industry. Other significant sectors include shipping/international trade – particularly at the adjacent Port of Los Angeles and Port of Long Beach, together comprising the United States' busiest seaport – as well as aerospace, technology, petroleum, fashion and apparel, and tourism.
The City of Los Angeles is home to five Fortune 500 companies: energy company Occidental Petroleum, healthcare provider Health Net, metals distributor Reliance Steel & Aluminum, engineering firm AECOM, and real estate group CB Richard Ellis. Other companies headquartered in Los Angeles include American Apparel, City National Bank, 20th Century Fox, Latham & Watkins, Univision, Metro Interactive, LLC, Premier America, Gibson, Dunn & Crutcher, DeviantArt,[8] Guess?, O’Melveny & Myers; Paul, Hastings, Janofsky & Walker, Tokyopop, The Jim Henson Company, Paramount Pictures, Sunkist Growers, Incorporated, Tutor Perini, Fox Sports Net, Capital Group, and The Coffee Bean & Tea Leaf. Korean Air's US passenger and cargo operations headquarters are located in two separate offices in Los Angeles.[9]
If the Greater Los Angeles CSA were counted as a country it would have the 15th largest economy in the world in terms of nominal GDP, placing it just below Australia and above the Netherlands, Turkey, Sweden, Belgium, and Indonesia.[10] The Los Angeles-Long Beach-Riverside combined statistical area (CSA) also has a gross metropolitan product (GMP) of $831 billion (as of 2008), which makes it the third largest economic center in the world, after the Greater Tokyo Area and the New York-Newark-Bridgeport CSA.[11]
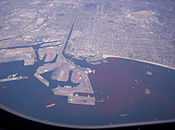
The Port of Los Angeles and Port of Long Beach together comprise the fifth busiest port in the world being the center of imports and exports for trade on the west Pacific Coast as well as being one of the most significant ports of the western hemisphere. The Port of Los Angeles occupies 7,500 acres (30 km2) of land and water along 43 miles (69 km) of waterfront and is the busiest container port in the United States. The Port is the busiest port in the United States by container volume, the 8th busiest container port in the world.[12][13][14] The top trading partners in 2004 were: China ($68.8 billion), Japan ($24.1 billion), Taiwan ($10.8 billion), Thailand ($6.7 billion), & South Korea ($5.6 billion)
The Port of Long Beach is the 2nd busiest container port in the United States. It adjoins the separate Port of Los Angeles. Acting as a major gateway for U.S.-Asian trade, the port occupies 3,200 acres (13 km2) of land with 25 miles (40 km) of waterfront in the city of Long Beach, California. The seaport boasts approximately $100 billion in trade and provides more than 316,000 jobs in Southern California. The Port of Long Beach import and export more than $100 billion worth of goods every year. The seaport provides the country with jobs, generate tax revenue, and supporting retail and manufacturing businesses.
Demographics
| Historical population | |||
|---|---|---|---|
| Census | Pop. | %± | |
| 1890 | 115,043 | — | |
| 1900 | 189,994 | 65.2% | |
| 1910 | 538,567 | 183.5% | |
| 1920 | 997,830 | 85.3% | |
| 1930 | 2,327,166 | 133.2% | |
| 1940 | 2,916,403 | 25.3% | |
| 1950 | 4,367,911 | 49.8% | |
| 1960 | 6,742,696 | 54.4% | |
| 1970 | 8,463,213 | 25.5% | |
| 1980 | 9,410,159 | 11.2% | |
| 1990 | 11,273,720 | 19.8% | |
| 2000 | 12,365,627 | 9.7% | |
| 2010 | 12,828,837 | 3.7% | |
| State Census data | |||
According to the 2009 American Community Survey, the Los Angeles Metropolitan Area had a population of 12,874,797, of which 6,402,498 (49.7% of the population) were male and 6,472,299 (50.3% of the population) were female.
The age composition was the following:
- Under 5 years: 7.3%
- 5 to 9 years: 6.6%
- 10 to 14 years: 7.0%
- 15 to 19 years: 7.2%
- 20 to 24 years: 7.0%
- 25 to 34 years: 15.5%
- 35 to 44 years: 14.8%
- 45 to 54 years: 13.9%
- 55 to 59 years: 5.5%
- 60 to 64 years: 4.4%
- 65 to 74 years: 5.6%
- 75 to 84 years: 3.6%
- 85 years and over: 1.6%
Median age: 34.6 years
According to the survey, the Los Angeles Metropolitan Area was 54.6% White (32.2% non-Hispanic White alone), 7.0% Black or African American, 0.5% American Indian and Alaska Native, 13.9% Asian, 0.3% Native Hawaiian and Other Pacific Islander, 20.6% from Some other race, and 3.2% from Two or more races. Hispanics or Latinos of any race made up 44.8% of the population.
Whites are the racial majority; whites of both Hispanic and non-Hispanic origin make up 54.6% of the population. Non-Hispanic whites make up under one-third (32.2%) of the population. Approximately 7,028,533 residents are white, of which 4,150,426 are non-Hispanic whites.
The top five European ancestries are the following:
- German: 6.9% (883,124)
- Irish: 5.3% (786,541)
- English: 4.8% (619,364)
- Italian: 3.3% (425,056)
- French: 1.6% (204,635)
Blacks are a sizable minority; blacks of both Hispanic and non-Hispanic origin make up 7.0% of the population. Non-Hispanic blacks make up 6.7% of the population. Approximately 895,931 residents are black, of which 864,737 are non-Hispanic blacks. In the survey, 136,024 people identified their ancestry as "Sub-Saharan African", equal to 1.1% of the population.
American Indians are a small minority; American Indians of both Hispanic and non-Hispanic origin make up 0.5% of the population. American Indians of non-Hispanic origin make up 0.2% of the populace. Approximately 68,822 residents are American Indian, of which 26,134 are American Indians of non-Hispanic origin. Approximately 3,872 Cherokee, 1,679 Navajo, 1,000 Chippewa, and 965 Sioux reside in the area.
Asians are a large minority; Asians of both Hispanic and non-Hispanic origin make up 13.9% of the population. Asians of non-Hispanic origin make up 13.7% of the population. Approximately 1,790,140 residents are Asian, of which 1,770,225 are Asians of non-Hispanic origin.
The six Asian ancestries mentioned are the following:
- Chinese: 3.5% (454,086)
- Filipino: 3.0% (390,192)
- Korean: 2.1% (274,288)
- Vietnamese: 2.0% (254,353)
- Japanese: 1.0% (134,466)
- Indian: 0.9% (116,090)
"Other Asian" is an additional category that includes people who did not identify themselves as any of the groups above. This group includes people of Cambodian, Laotian, Pakistani, Burmese, Taiwanese, and Thai descent, among others. Approximately 166,665 people are in this category, and they make up 1.3% of the population.
Native Hawaiians and other Pacific Islanders are a very small minority; Native Hawaiians and other Pacific Islanders make up 0.3% of the population. Approximately 37,719 residents are Native Hawaiian or of other Pacific Islander ancestries, of which 33,982 are of non-Hispanic origin.
The three Pacific Islander ancestries mentioned are the following:
- Samoan: 0.1% (13,519)
- Native Hawaiian: 0.1% (6,855)
- Guamanian or Chamorro: <0.1% (4,581)
"Other Pacific Islander" is an additional category that includes people who did not identify themselves as any of the groups above. This group includes people of Fijian and Tongan descent, among others. Approximately 12,764 people are in this category, and they make up 0.1% of the population.
Multiracial individuals are a sizable minority; multiracial people of both Hispanic and non-Hispanic origin make up 3.2% of the population, of which 1.8% were of non-Hispanic origin. Approximately 405,568 people are multiracial, of which 228,238 are of non-Hispanic origin.
The four multiracial ancestries mentioned are the following:
- White and Asian: 0.8% (107,585)
- White and American Indian: 0.4% (55,960)
- White and Black or African American: 0.4% (53,476)
- Black or African American and American Indian: 0.1% (12,661)
Hispanic or Latinos, are, by far, the largest minority group; Hispanics or Latinos make up 44.8% of the population. They do not make up a majority, but they make up a plurality, outnumbering every other individual racial group. Approximately 5,763,181 residents are Hispanic or Latino.
The three Hispanic or Latino ancestries mentioned are the following:
"Other Hispanic or Latino" is an additional category that includes people who did not identify themselves as any of the groups above. This group include people of Costa Rican, Salvadoran, and Colombian descent, among others. Approximately 1,096,569 people are in this category, and they make up 8.5% of the population.
Source 1:[15]
Source 2:[16]
Tourism
Due to L.A.'s stance as The Entertainment Capital of the World, there are an abundance of tourist attractions in the area. Consequently, the metropolitan L.A. is one of the most visited areas in the world. Here is a breakdown of some of its major attractions:
Theme parks

- Disneyland
- Disney California Adventure Park
- Knott's Berry Farm
- Pacific Park
- Six Flags Magic Mountain
- Universal Studios Hollywood
Beaches

- Malibu
- Venice Beach
- Huntington Beach
- Laguna Beach
- Dana Point
- Sunset Beach
- Bolsa Chica State Beach
- Newport Beach
- Manhattan Beach
- Hermosa Beach
- Redondo Beach
- San Clemente
- Santa Monica
- Long Beach
Shopping

- Americana at Brand
- Anaheim GardenWalk
- Bella Terra
- Beverly Center
- Cerritos Auto Square
- Cerritos Towne Center
- Citadel Outlets
- Del Amo Fashion Center
- Downtown Disney
- Fashion Island
- Glendale Galleria
- The Grove at Farmer's Market
- Hollywood and Highland
- Irvine Spectrum Center
- Los Cerritos Center
- Montclair Plaza
- Old Pasadena
- Ontario Mills
- The Outlets at Orange
- Paseo Colorado
- Puente Hills Mall
- Rodeo Drive
- The Shops at Mission Viejo
- South Coast Plaza
- Stonewood Center
- Third Street Promenade
- Universal CityWalk
- Valencia Town Center
- Victoria Gardens
- Westfield Century City
- Westfield MainPlace
- Westfield Santa Anita
- Westfield Topanga
- Westfield West Covina
- Westside Pavilion
Motion picture studios

- CBS Television City
- CBS Studio Center
- CBS Columbia Square
- Charlie Chaplin Studios
- Ren-Mar Studios
- Paramount Studios
- NBC Studios (Burbank)
- Walt Disney Studios
- Golden Oak Ranch
- Hollywood Center Studios
- Universal Studios
- The Prospect Studios
- Metromedia Square
- Santa Clarita Studios
- Nestor Studios
- 20th Century Fox
- Sony Pictures Entertainment
- Fox Television Center
- Nickelodeon Animation Studios
- Sunset Gower Studios
- Downey Studios
- Warner Brothers Studios
Waterparks
- Raging Waters
- Knott's Soak City USA
- Six Flags Hurricane Harbor
Zoos and aquariums

Nightlife
- Hollywood
- West Hollywood
- Sunset Strip
- Santa Monica
- Huntington Beach
Museums
See also, Los Angeles City Museums
- Bowers Museum
- Heritage Square Museum
- California Science Center
- Discovery Science Center
- Getty Center
- Getty Villa
- Griffith Observatory
- Huntington Library
- La Brea Tar Pits
- Los Angeles County Museum of Art
- Natural History Museum of Los Angeles County
- Norton Simon Museum
- Kidspace Children's Museum
- Museum of Contemporary Art, Los Angeles
- Museum of Latin American Art
- Museum of Tolerance
- Petersen Automotive Museum
- Toyota USA Automobile Museum
Presidential Museums
Other
Transportation
Commercial airports

| Airport | IATA code | ICAO code | County |
|---|---|---|---|
| Los Angeles International Airport | LAX | KLAX | Los Angeles |
| John Wayne Airport | SNA | KSNA | Orange |
| Bob Hope Airport | BUR | KBUR | Los Angeles |
| Ontario International Airport | ONT | KONT | San Bernardino |
| Long Beach Municipal Airport | LGB | KLGB | Los Angeles |
Interstates
-
.svg.png) Golden State Freeway/Santa Ana Freeway/San Diego Freeway/Montgomery Freeway (Interstate 5)
Golden State Freeway/Santa Ana Freeway/San Diego Freeway/Montgomery Freeway (Interstate 5) -
.svg.png) Santa Monica Freeway/Rosa Parks Freeway/Golden State Freeway[17] (Interstate 10)
Santa Monica Freeway/Rosa Parks Freeway/Golden State Freeway[17] (Interstate 10) -
.svg.png) Glenn Anderson Freeway/Century Freeway (Interstate 105)
Glenn Anderson Freeway/Century Freeway (Interstate 105) -
.svg.png) Harbor Freeway (Interstate 110)
Harbor Freeway (Interstate 110) -
.svg.png) Foothill Freeway (Interstate 210)
Foothill Freeway (Interstate 210) -
.svg.png) San Diego Freeway (Interstate 405)
San Diego Freeway (Interstate 405) -
.svg.png) San Gabriel River Freeway (Interstate 605)
San Gabriel River Freeway (Interstate 605) -
.svg.png) Long Beach Freeway (Interstate 710)
Long Beach Freeway (Interstate 710)
California State Highways
-
 State Route 1
 -
 State Route 2
 -
 State Route 14
 -
 State Route 18
 -
 State Route 19
 -
 State Route 39
 -
 State Route 47
 -
 State Route 57
 -
 State Route 60
 -
 State Route 71
 -
 State Route 90
 -
 State Route 91
 -
 State Route 110
 -
 State Route 134
 -
 State Route 138
 -
 State Route 170
Los Angeles County Metro

The Metro Rail is the mass transit rail system of Los Angeles County. It is run by the Los Angeles County Metropolitan Transportation Authority and its system runs five rail lines throughout Los Angeles County. Metro Rail currently operates four light rail lines and two rapid transit subway lines, altogether totaling 87.7 miles (141.1 km) of rail, 101 stations, and over 360,000 daily weekday boardings as of December 2012.[18]
- The Blue Line – light rail
- The Red Line – subway
- The Green Line – light rail
- The Gold Line – light rail
- The Purple Line – subway
- The Expo Line – light rail
The systems light rail system is the second busiest LRT system in the United States, after Boston, by number of riders, with 200,300 average weekday boardings during the third quarter of 2012.[19]
Since the region of the city is in close proximity to a major fault area the tunnels were built to resist earthquakes of up to magnitude 7.5. Both subway lines use an electrified third rail to provide power to the trains, rendering these lines unusable on the other three. The Blue and Gold Lines run mostly at grade, with some street-running, elevated, and underground stretches in the more densely populated areas of Los Angeles. The Green Line is entirely grade separated, running in the median of I-105 and then turning southward along an elevated route.
The rail lines run regularly on a 5 am and midnight schedule, seven days a week. Limited service on particular segments is provided after midnight and before 5 am There is no rail service between 2 and 3:30 am Exact times vary from route to route; see individual route articles for more information.
Codes of metropolitan Los Angeles
Area codes
- 213 – Downtown Los Angeles, surrounded by 323 (October 1947)
- 310/424 – Santa Monica, Malibu, Pacific Palisades, Compton, Lynwood, Torrance, Beverly Hills, Catalina Island; the southwestern portion of Los Angeles County. (Split from 213 on November 2, 1991; overlaid by 424 on August 26, 2006)
- 323 – a ring around downtown Los Angeles, including the Hollywood and Eagle Rock districts of Los Angeles, South Gate, Huntington Park, Vernon, Walnut Park, Florence, Bell, Bell Gardens, Cudahy, Montebello, and East Los Angeles. (Split from 213 on June 13, 1998)
- 562 – Long Beach, Downey, Whittier; Norwalk, Lakewood, Bellflower, Paramount, Cerritos, southeast Los Angeles County, and a small portion of coastal Orange County. (Split from 310 on January 25, 1997)
- 626 – Pasadena, El Monte, West Covina; the San Gabriel Valley, and eastern suburbs of Los Angeles. (Split from 818 on June 14, 1997)
- 657/714 – Anaheim, Huntington Beach, Santa Ana, Orange, Garden Grove; northern and western Orange County (overlay with 714) (September 23, 2008)
- 661 – Bakersfield, Santa Clarita, Palmdale; northern Los Angeles County including the Antelope Valley, and most of Kern County, including the southern San Joaquin Valley. (Split from 805 on February 13, 1999)
- 747/818 – Burbank, Glendale, the North Hollywood, Van Nuys, Panorama City, Sherman Oaks, and Northridge districts of Los Angeles; the San Fernando Valley. (Split from 213 on January 7, 1984)
- 909 – Pomona, Walnut, Diamond Bar, La Verne, Claremont, and Eastern Glendora. (The Eastern San Gabriel Valley)
- 949 – Irvine, Laguna Beach, Newport Beach, San Juan Capistrano; southern and eastern Orange County. (Split from 714 on April 18, 1998)
ZIP codes
The following is the list of ZIP codes for select areas within the metropolitan area.
- 92704 in Santa Ana • 91,106
- 92804 in Anaheim • 81,362
- 90631 in La Habra • 67,164
- 92677 in Laguna Niguel • 62,329
- 92627 in Costa Mesa • 62,275
- 92630 in Lake Forest • 59,157
- 92647 in Huntington Beach • 58,874
- 92780 in Tustin • 55,092
- 92708 in Fountain Valley • 54,588
- 92840 in Garden Grove • 50,702
- 92870 in Placentia • 48,670
- 92653 in Laguna Hills • 48,024
- 90630 in Cypress • 47,617
- 92691 in Mission Viejo • 46,463
- 92833 in Fullerton • 46,263
- 90620 in Buena Park • 44,535
- 92705 in North Tustin • 43,913
- 92843 in Garden Grove • 43,788
- 92688 in Rancho Santa Margarita • 42,491
- 92656 in Aliso Viejo • 41,551
- 92612 in Irvine • 41,101
- 92867 in Orange • 40,648
- 92807 in (Anaheim • 6,076) and (Anaheim Hills • 34,384) • 40,460
- 92886 in Yorba Linda • 39,242
- 92672 in San Clemente • 34,869
- 92675 in San Juan Capistrano • 34,409
- 92821 in Brea • 34,122
- 90621 in Buena Park • 33,556
- 92679 in Coto de Caza • 32,205
- 92841 in Garden Grove • 31,586
- 90680 in Stanton • 29,522
- 92660 in Newport Beach • 28,755
- 92604 in Irvine • 27,452
- 92629 in Dana Point • 27,441
- 92651 in Laguna Beach • 24,968
- 90740 in Seal Beach • 24,308
- 92844 in Garden Grove • 23,510
- 90720 in Los Alamitos • 21,004
- 92808 in Anaheim Hills • 19,613
- 92610 in Foothill Ranch • 10,940
- 92861 in Villa Park • 6,002
- 92657 in Newport Coast • 5,752
- 92694 in Las Flores • 433
- 90201 in Bell Gardens • 105,277
- 90650 in Norwalk • 103,183
- 90011 in Los Angeles • 101,770
- 90280 in South Gate • 96,296
- 90250 in Hawthorne • 93,628
- 90805 in Long Beach • 91,456
- 91744 in La Puente • 84,973
- 90255 in Huntington Park • 77,926
- 91706 in Irwindale • 76,941
- 90706 in Bellflower • 72,829
- 90262 in Lynwood • 69,918
- 91766 in Pomona • 69,757
- 90022 in East Los Angeles • 68,596
- 93550 in Palmdale • 67,384
- 90660 in Pico Rivera • 63,028
- 91732 in El Monte • 62,754
- 90640 in Montebello • 62,304
- 91770 in Rosemead • 61,780
- 91351 in Santa Clarita • 59,530
- 93535 in Lancaster • 57,928
- 91702 in Azusa • 57,505
- 90745 in Carson • 55,426
- 90723 in Paramount • 55,317
- 90001 in Florence-Graham • 54,587
- 91801 in Alhambra • 54,432
- 91745 in Hacienda Heights • 53,623
- 90703 in Cerritos • 51,510
- 90221 in Compton • 51,396
- 90638 in La Mirada • 47,507
- 90247 in Gardena • 47,317
- 91765 in Diamond Bar • 46,647
- 91748 in Rowland Heights • 46,140
- 91733 in South El Monte • 45,795
- 91789 in Walnut • 44,901
- 91790 in West Covina • 43,788
- 90242 in Downey • 42,730
- 90503 in Torrance • 42,042
- 91205 in Glendale • 41,431
- 90275 in Rancho Palos Verdes • 41,431
- 91016 in Monrovia • 41,029
- 90605 in Whittier • 38,349
- 91776 in San Gabriel • 37,969
- 90604 in South Whittier • 37,873
- 90278 in Redondo Beach • 37,297
- 91001 in Altadena • 36,310
- 91750 in La Verne • 35,011
- 91773 in San Dimas • 34,674
- 91711 in Claremont • 34,374
- 90266 in El Segundo • 33,924
- 91340 in San Fernando • 33,878
- 90260 in Lawndale • 33,366
- 91754 in Monterey Park • 33,120
- 91780 in Temple City • 32,441
- 90606 in West Whittier/Los Nietos • 32,426
- 91792 in West Covina • 31,391
- 91746 in Industry • 31,102
- 91007 in Arcadia • 30,901
- 91006 in Arcadia • 30,165
- 91731 in El Monte • 29,964
- 90304 in Lennox • 28,385
- 90270 in Maywood • 28,083
- 90303 in Inglewood • 27,781
- 90713 in Lakewood • 27,656
- 91010 in Duarte • 27,364
- 91755 in Monterey Park • 26,993
- 90249 in Gardena • 26,015
- 91740 in Glendora • 25,200
- 91301 in Agoura Hills • 25,104
- 90274 in Palos Verdes Eststes • 24,892
- 90061 in Willowbrook • 24,788
- 91030 in South Pasadena • 23,893
- 91302 in Calabasas • 23,645
- 91775 in East San Gabriel • 23,384
- 91384 in Val Verde • 22,098
- 90717 in Lomita • 21,057
- 90715 in Lakewood • 21,023
- 91011 in La Cañada Flintridge • 20,317
- 90265 in Malibu • 19,816
- 90254 in Hermosa Beach • 18,557
- 91506 in Burbank • 18,310
- 91354 in Santa Clarita • 17,832
- 90502 in West Carson • 17,119
- 90701 in Artesia • 16,380
- 90716 in Hawaiian Gardens • 14,872
- 91108 in San Marino • 13,347
- 90210 in Beverly Hills • 11,310
- 91024 in Sierra Madre • 10,536
- 90040 in Commerce • 9,737
- 90755 in Signal Hill • 9,273
- 93510 in Acton • 8,077
- 90056 in Ladera Heights • 8,038
- 91020 in La Crescenta-Montrose • 7,343
- 90704 in Avalon • 3,696
- 90058 in Vernon • 3,495
- 91343 in North Hills
Culture
Sports teams

Listing of the professional sports teams in the Los Angeles metropolitan area
- National Basketball Association (NBA)
- Women's National Basketball Association (WNBA)
- Major League Baseball (MLB)
- National Hockey League (NHL)
- Major League Soccer (MLS)
- Los Angeles Galaxy
- Chivas USA 2005-2014 folded and replaced by Los Angeles Football Club in 2017
As a whole, the Los Angeles area has more national championships, all sports combined (college and professional), than any other city in the United States, with over four times as many championships as the entire state of Texas, and just over twice that of New York City.[20]
Media
The Los Angeles metropolitan area is home to the headquarters of several well-known media companies including: the Los Angeles Times, Fox Broadcasting Company, Universal Studios, and The Walt Disney Company. Local television channels include KCBS-TV 2 (CBS), KNBC 4 (NBC), KTLA 5 (CW), KABC 7 (ABC), KCAL-TV 9 (Independent/CBS), KTTV 11 (FOX), KCOP 13 (myNetworkTV), KPXN-TV 38/30 (Ion), and KLCS 41/58 (PBS). Radio stations serving the area include: KKJZ, KIIS, KNX (AM), and KMZT.
See also
- Greater Los Angeles Area
- United States metropolitan area
- Table of United States Metropolitan Statistical Areas
- New York Metropolitan Area
- Chicago Metropolitan Area
References
- ↑ List of Southland's worst schools released | abc7.com. Abclocal.go.com (2010-03-08). Retrieved on 2013-07-29.
- ↑ Largest Metropolitan Areas in the U.S. – Most Populous Metros. Geography.about.com. Retrieved on 2013-07-29.
- ↑ "Current Lists of Metropolitan and Micropolitan Statistical Areas and Definitions". United States Census Bureau. Retrieved December 25, 2009.
- ↑ "Combined Statistical Area Population Estimates File for Internet Display". US Census Bureau. 2012. Retrieved March 27, 2013.
- ↑ 5.0 5.1 Metropolitan and Micropolitan Statistical Areas Totals: Vintage 2012 - U.S Census Bureau. Census.gov. Retrieved on 2013-07-29.
- ↑ "City and Town Totals: Vintage 2011". United States Census Bureau. July 1, 2011. Retrieved March 27, 2013.
- ↑ "About Metropolitan and Micropolitan Statistical Areas". United States Census Bureau. February 28, 2013. Retrieved March 27, 2013.
- ↑ "DeviantArt, Inc." Businessweek Investing. Accessed November 9, 2008.
- ↑ "Contact Info". Korean Air. Retrieved September 20, 2008.
- ↑ CIA World Factbook, 2009: GDP (Official Exchange Rate), October, 2008.
- ↑ The 150 richest cities in the world by GDP in 2005, dated March 11, 2007. The list fails to include Taipei. Accessed July 3, 2007.
- ↑ "World Port Rankings – 2005" – Port Industry Statistics – American Association of Port Authorities (AAPA) – Updated May 1, 2007 – (Microsoft Excel *.XLS document)
- ↑ "North American Port Container Traffic – 2006" – Port Industry Statistics – American Association of Port Authorities (AAPA) – Updated May 14, 2007 – (Adobe Acrobat *.PDF document)
- ↑ FAQ # 22 at the Port of Los Angeles.org
- ↑ American FactFinder. Factfinder.census.gov. Retrieved on 2013-07-29.
- ↑ American FactFinder. Factfinder.census.gov. Retrieved on 2013-07-29.
- ↑ Los Angeles County Road Atlas (Map). Thomas Brothers. 2008.
- ↑ "Facts at a Glance". LACMTA. January 15, 2013. Retrieved January 20, 2013.
- ↑ Los Angeles County Metropolitan Transit Authority, Facts at a Glance, January 15, 2013.
- ↑ "Los Angeles Sports Travel". Los Angeles Sports Travel.
External references
| Wikimedia Commons has media related to Los Angeles metropolitan area. |
| |||||||||||||||||||||||||||||||||

| |||||||||||||||||
| ||||||||||||||||||||||||||
| ||||||||||||||||
| |||||||||||