List of sovereign states in Europe by GDP (nominal) per capita
This is a list and map of European states by GDP per capita.
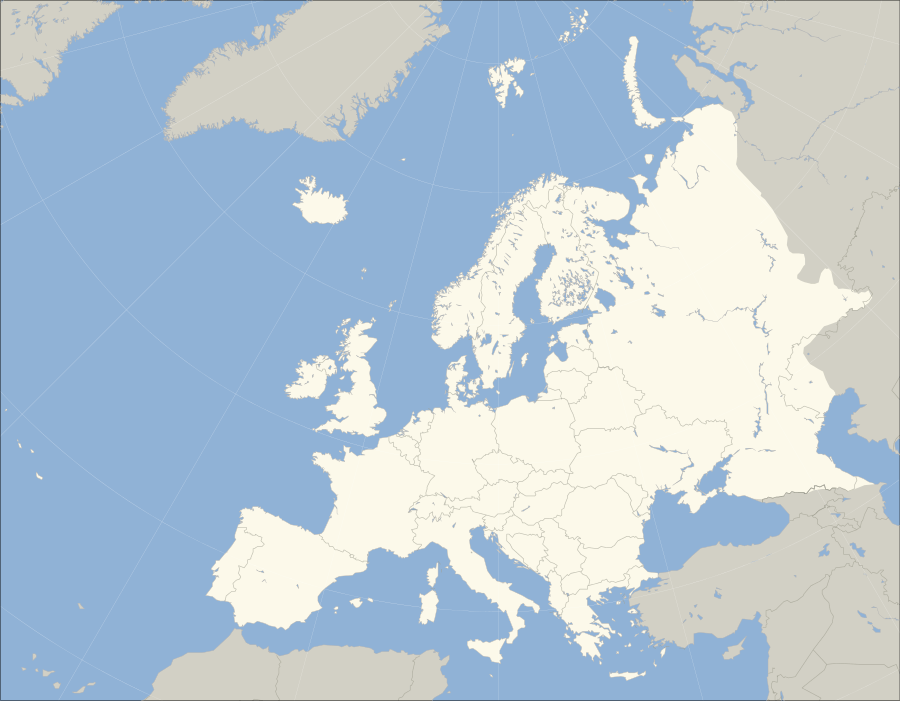
Map of sovereign states in Europe by GDP (nominal) per capita 2010
- The map data is for year 2010 from IMF. Blue color countries are more than $20 000, green $10 000 - $20 000, and yellow below $10 000 GDP per capita.
Gulf of
Cadiz
Cadiz
North
Atlantic
Ocean
Atlantic
Ocean
List of sovereign states in Europe by GDP (nominal) per capita 2010
- The "IMF" column includes data for the year 2014 for members of the International Monetary Fund (plus the Hong Kong Special Administrative Region), for which information is available.
- The "WB" column includes data for the year 2009 from the World Bank.
- The "CIA" column includes estimated data for the year 2010 from The World Factbook, provided by the Central Intelligence Agency, as of June 9, 2011.
Data across columns are not comparable as they may refer to different years. All data are in United States dollars.
Note: To sort the table in descending order, click on the little square next to the column you wish sorted four times.
| Country | Rank in World | IMF[1] 2014 | Rank in World | WB[2] 2009 | Rank in World | CIA[3] 2010 Estimation |
|---|---|---|---|---|---|---|
| | 101 | 4,609 | 96 | 3,808 | 102 | 4,000 |
| | 13 | 48,956 | 12 | 45,562 | 18 | 44,600 |
| | 79 | 7,577 | 79 | 5,075 | 86 | 5,500 |
| | 17 | 45,383 | 14 | 43,671 | 19 | 44,300 |
| | 74 | 7,328 | 69 | 6,423 | 79 | 6,300 |
| | 95 | 4,597 | 84 | 4,525 | 107 | 3,500 |
| | 44 | 20,904 | 42 | 14,222 | 48 | 13,400 |
| | 28 | 28,237 | 26 | 31,280 | 35 | 20,600 |
| | 38 | 27,344 | 34 | 18,139 | 38 | 19,100 |
| | 6 | 56,147 | 7 | 55,992 | 7 | 56,500 |
| | 42 | 25,049 | 41 | 14,238 | 45 | 14,600 |
| | - | - | - | - | - | 32,400 |
| | 15 | 43,492 | 12 | 45,515 | 13 | 53,616 |
| | 12 | 44,747 | 8 | 45,523 | 15 | 49,489 |
| | 16 | 40,875 | 16 | 40,079 | 20 | 46,352 |
| | 25 | 29,635 | 21 | 32,166 | 27 | 34,832 |
| | 46 | 13,404 | 35 | 13,741 | 55 | 13,231 |
| | 19 | 37,977 | 3 | 62,733 | 8 | 62,490 |
| | 6 | 51,356 | 4 | 58,339 | 5 | 68,574 |
| | 21 | 35,435 | 18 | 35,494 | 24 | 41,259 |
| | - | - | - | - | 129 | 1,813 |
| | 48 | 21,381 | 37 | 11,931 | 47 | 15,097 |
| | - | - | - | - | 1 | 145,734 |
| | 50 | 23,876 | 39 | 11,353 | 51 | 13,674 |
| | 1 | 104,512 | 1 | 99,879 | 3 | 118,538 |
| | 34 | 19,111 | - | - | 37 | 21,272 |
| | 125 | 1,514 | 119 | 1,159 | 137 | 1,433 |
| | - | - | 58 | 5,928 | 78 | 6,658 |
| | 7 | 48,223 | 9 | 46,041 | 12 | 54,640 |
| | 2 | 79,085 | 2 | 81,111 | 4 | 103,586 |
| | 49 | 23,275 | 40 | 12,274 | 48 | 12,271 |
| | 32 | 21,408 | 27 | 20,762 | 25 | 23,930 |
| | 84 | 4,482 | 82 | 3,726 | 94 | 4,669 |
| | 63 | 8,635 | 51 | 7,703 | 62 | 9,615 |
| | 59 | 8,694 | 44 | 9,115 | 57 | 12,487 |
| | - | - | - | - | 26 | 36,768 |
| | 74 | 5,809 | 64 | 5,630 | 76 | 7,038 |
| | 39 | 25,333 | 34 | 13,887 | 40 | 18,440 |
| | 30 | 24,417 | 26 | 22,523 | 32 | 28,396 |
| | 23 | 31,946 | 22 | 31,846 | 23 | 41,565 |
| | 13 | 43,986 | 7 | 48,584 | 11 | 56,703 |
| | 4 | 67,560 | 6 | 55,035 | 7 | 64,974 |
| | 45 | 10,815 | 48 | 17,946 | 66 | 17,700 |
| | 112 | 2,542 | 91 | 3,029 | 98 | 4,350 |
| | 22 | 35,334 | 14 | 44,693 | 21 | 45,731 |
See also
- List of sovereign states in Europe by GDP (PPP) per capita
- International organisations in Europe
- List of European countries by budget revenues
- List of European countries by budget revenues per capita
References
- ↑ Data refer to the year 2014. World Economic Outlook Database-April 2014, International Monetary Fund.
- ↑ Data refer to the year 2009. Total GDP 2009 & Population 2007, World Development Indicators database, World Bank, 10 June 2010. Note: Per capita values were obtained by dividing the Total GDP data by the Population data.
- ↑ Data refer to the year 2010. GDP (official exchange rate) & Population, The World Factbook, Central Intelligence Agency. Data last updated on April 25, 2009. Note: Per capita values were obtained by dividing the GDP (official exchange rate) data by the Population data.
- ↑ Kosovo status is disputed
| ||||||||||||||||||||||||||||||