List of sovereign states by current account balance
Cumulative Current Account Balance 1980-2008 based on the IMF data)

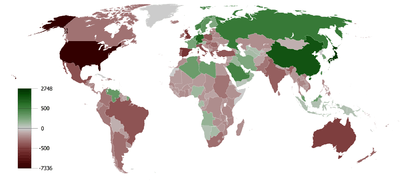
Cumulative Current Account Balance per capita 1980-2008 based on the IMF
WTO Data
This Table shows the biggest Net Exporter and Net Importer in Nominal US Dollar based on WTO Trade Balance Data.[1]
|
|
CIA World factbook Data
This is a list of countries and territories by current account balance (CAB), based on data from 2011 (with some exceptions), as listed in the CIA World Factbook.[2]
| Rank | Country | CAB (billion US dollars) | Year |
|---|---|---|---|
| 1 | 213.800 | 2012 | |
| 2 | 208.100 | 2012 | |
| 3 | 150.000 | 2009 | |
| 4 | 119.100 | 2011 | |
| 5 | 81.300 | 2012 | |
| 6 | 74.060 | 2011 | |
| 7 | 70.920 | 2011 | |
| 8 | 70.780 | 2011 | |
| 9 | 70.000 | 2011 | |
| 10 | 51.980 | 2011 | |
| 11 | 56.980 | 2011 | |
| 12 | 40.910 | 2011 | |
| 13 | 38.290 | 2011 | |
| 14 | 38.450 | 2011 | |
| 15 | 32.990 | 2011 | |
| 16 | 27.200 | 2011 | |
| 17 | 26.510 | 2011 | |
| 18 | 22.100 | 2011 | |
| 19 | 18.120 | 2011 | |
| 20 | 17.370 | 2011 | |
| 21 | 14.110 | 2011 | |
| 22 | 12.910 | 2011 | |
| 23 | 12.010 | 2011 | |
| 24 | 12.000 | 2011 | |
| 25 | 11.900 | 2011 | |
| 26 | 11.600 | 2011 | |
| 27 | 11.120 | 2011 | |
| 28 | 7.755 | 2011 | |
| 29 | 7.223 | 2011 | |
| 30 | 7.044 | 2011 | |
| 31 | 6.238 | 2009 | |
| 32 | 6.233 | 2011 | |
| 33 | 5.803 | 2011 | |
| 35 | 4.700 | 2011 | |
| 36 | 3.977 | 2009 | |
| 37 | 3.5885 | 2011 | |
| 38 | 3.428 | 2011 | |
| 39 | 2.375 | 2011 | |
| 40 | 1.544 | 2011 | |
| 41 | 1.504 | 2011 | |
| 42 | 1.400 | 2011 | |
| 43 | 1.293 | 2011 | |
| 44 | 0.997 | 2011 | |
| 45 | 0.866 | 2011 | |
| 46 | 0.617 | 2011 | |
| 47 | 0.543 | 2011 | |
| 48 | 0.390 | 2011 | |
| 49 | 0.389 | 2011 | |
| 50 | 0.362 | 2010 | |
| 51 | 0.283 | 2011 | |
| 52 | 0.268 | 2011 | |
| 53 | 0.108 | 2011 | |
| 54 | 0.026 | 2005 | |
| 55 | 0.015 | FY03/04 | |
| 56 | -0.011 | 2003 | |
| 57 | -0.021 | 2007 | |
| 58 | -0.023 | 2011 | |
| 59 | -0.025 | 2011 | |
| 60 | -0.034 | FY05 | |
| 61 | -0.037 | 2011 | |
| 62 | -0.042 | 2011 | |
| 63 | -0.058 | 2010 | |
| 64 | -0.060 | 2007 | |
| 65 | -0.076 | 2011 | |
| 66 | -0.077 | 2011 | |
| 67 | -0.090 | 2011 | |
| 68 | -0.090 | 2011 | |
| 69 | -0.100 | 2011 | |
| 70 | -0.102 | 2011 | |
| 71 | -0.120 | 2011 | |
| 72 | -0.143 | 2011 | |
| 73 | -0.154 | 2011 | |
| 74 | -0.174 | 2009 | |
| 75 | -0.175 | 2011 | |
| 76 | -0.207 | 2011 | |
| 77 | -0.207 | 2009 | |
| 78 | -0.214 | 2011 | |
| 79 | -0.233 | 2011 | |
| 80 | -0.244 | 2011 | |
| 81 | -0.255 | 2011 | |
| 82 | -0.264 | 2011 | |
| 83 | -0.264 | 2011 | |
| 84 | -0.271 | 2011 | |
| 85 | -0.275 | 2011 | |
| 86 | -0.296 | 2011 | |
| 87 | -0.297 | 2011 | |
| 88 | -0.300 | 2011 | |
| 89 | -0.318 | 2011 | |
| 90 | -0.322 | 2011 | |
| 91 | -0.328 | 2011 | |
| 92 | -0.330 | 2011 | |
| 93 | -0.352 | 2011 | |
| 94 | -0.372 | 2011 | |
| 95 | -0.415 | 2011 | |
| 96 | -0.417 | 2011 | |
| 97 | -0.419 | 2011 | |
| 98 | -0.437 | 2010 | |
| 99 | -0.461 | 2011 | |
| 100 | -0.463 | 2010 | |
| 101 | -0.467 | 2011 | |
| 102 | -0.507 | 2011 | |
| 103 | -0.511 | 2011 | |
| 104 | -0.559 | 2011 | |
| 105 | -0.603 | 2011 | |
| 106 | -0.660 | 2011 | |
| 107 | -0.675 | 2011 | |
| 108 | -0.714 | 2011 | |
| 109 | -0.764 | 2011 | |
| 110 | -0.798 | 2011 | |
| 111 | -0.829 | 2011 | |
| 112 | -0.847 | 2011 | |
| 113 | -0.900 | 2011 | |
| 114 | -0.931 | 2010 | |
| 115 | -0.941 | 2011 | |
| 116 | -0.943 | 2011 | |
| 117 | -1.076 | 2011 | |
| 118 | -1.077 | 2011 | |
| 119 | -1.097 | 2011 | |
| 120 | -1.099 | 2011 | |
| 121 | -1.106 | 2011 | |
| 122 | -1.135 | 2011 | |
| 123 | -1.135 | 2011 | |
| 124 | -1.143 | 2011 | |
| 125 | -1.146 | 2011 | |
| 126 | -1.206 | 2011 | |
| 127 | -1.225 | 2011 | |
| 128 | -1.248 | 2011 | |
| 129 | -1.294 | 2011 | |
| 130 | -1.288 | 2011 | |
| 131 | -1.294 | 2011 | |
| 132 | -1.316 | 2011 | |
| 133 | -1.380 | 2011 | |
| 134 | -1.385 | 2011 | |
| 135 | -1.394 | 2011 | |
| 136 | -1.425 | 2011 | |
| 137 | -1.438 | 2011 | |
| 138 | -1.456 | 2011 | |
| 139 | -1.656 | 2011 | |
| 140 | -1.839 | 2011 | |
| 141 | -1.845 | 2011 | |
| 142 | -1.927 | 2011 | |
| 143 | -1.969 | 2011 | |
| 144 | -2.071 | 2011 | |
| 145 | -2.242 | 2011 | |
| 146 | -2.267 | 2011 | |
| 147 | -2.367 | 2011 | |
| 148 | -2.400 | 2011 | |
| 149 | -2.420 | 2011 | |
| 150 | -2.449 | 2011 | |
| 151 | -2.475 | 2010 | |
| 152 | -2.636 | 2011 | |
| 153 | -2.712 | 2011 | |
| 154 | -2.858 | 2011 | |
| 154 | -3.365 | 2012 | |
| 155 | -2.880 | 2011 | |
| 156 | -2.899 | 2011 | |
| 157 | -2.986 | 2011 | |
| 158 | -3.120 | 2011 | |
| 159 | -3.230 | 2011 | |
| 160 | -3.874 | 2011 | |
| 161 | -4.000 | 2011 | |
| 162 | -4.576 | 2011 | |
| 163 | -4.740 | 2011 | |
| 164 | -5.000 | 2011 | |
| 165 | -5.003 | 2011 | |
| 166 | -5.097 | 2011 | |
| 167 | -5.103 | 2012 | |
| 169 | -6.005 | 2011 | |
| 170 | -6.290 | 2011 | |
| 171 | -6.350 | 2011 | |
| 171 | -8.392 | 2012 | |
| 172 | -7.215 | 2012 | |
| 174 | -8.041 | 2011 | |
| 175 | -8.069 | 2011 | |
| 176 | -11.780 | 2011 | |
| 177 | -12.700 | 2012 | |
| 178 | -14.180 | 2012 | |
| 179 | -14.320 | 2012 | |
| 180 | -15.140 | 2012 | |
| 181 | -15.210 | 2012 | |
| 182 | -18.140 | 2012 | |
| 183 | -24.070 | 2012 | |
| 184 | -24.070 | 2012 | |
| 185 | -48.900 | 2012 | |
| 186 | -54.230 | 2012 | |
| 187 | -57.140 | 2012 | |
| 188 | -57.200 | 2012 | |
| 189 | -62.270 | 2012 | |
| 190 | -91.470 | 2012 | |
| 191 | -93.600 | 2012 | |
| 192 | -440.400 | 2012 | |
Eurostat Data
This table shows the account balance of solely the Euro Area (not the European Union as a whole), according to data from Eurostat (in USD).
| Rank | Country | CAB (billion US dollars) | Year |
|---|---|---|---|
| 1 | 18.930 | 2013 | |
See also
- List of countries by public debt (as percentage of gross domestic product)
- List of countries by current account balance as a percentage of GDP
- List of countries by leading trade partners
- Balance of payments
- Balance of trade
References
- ↑ "Trade Profiles - Selection (maximum 10)". World Trade Organisation. WTO. Retrieved 2012-11-28.
- ↑ "Country Comparison :: Current account balance". The World Factbook. Central Intelligence Agency. Archived from the original on 2011-07-27. Retrieved 2011-07-27.
| ||||||||||||||||||||||||||||||||||||||