There are 3,144 counties and county-equivalents in the United States. The source of the data is the U.S. Census Bureau and the data is current as of the indicated year. Independent cities are considered county-equivalent by the Census Bureau.
Summary
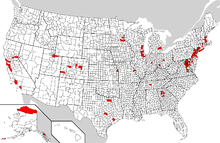
The Loudoun County, Virginia suburb of Washington, D.C. currently ranks as the highest-income county by median household income. New York County, New York (Manhattan) currently ranks as the highest-income county by per-capita income. The Washington suburb of Arlington County, Virginia ranks as the highest-income county by median family income.[1]
Many of the top counties in the following lists are found in the Northeast Megalopolis, particularly in the Washington metropolitan area and the New York metropolitan area.
Median household income
Latest, American Community Survey
Presented below are the 25 wealthiest counties (with populations of 65,000 or greater) in the United States by median household income according to the 2012 American Community Survey[2] prepared by the US Census Bureau. Six of the counties are located in the state of Maryland, five are in Virginia, four in New Jersey, three in New York, two in California, and one each in: Colorado, Georgia, Indiana, Tennessee, and Texas.
| Rank |
County |
State |
Median Household Income |
| 1 | Loudoun County | Virginia | $117,876 |
| 2 | Fairfax County | Virginia | $109,383 |
| 3 | Howard County | Maryland | $108,844 |
| 4 | Hunterdon County | New Jersey | $105,186 |
| 5 | Arlington County | Virginia | $100,474 |
| 6 | Stafford County | Virginia | $97,606 |
| 7 | Putnam County | New York | $96,223 |
| 8 | Somerset County | New Jersey | $95,825 |
| 9 | Douglas County | Colorado | $95,324 |
| 10 | Morris County | New Jersey | $95,294 |
| 11 | Montgomery County | Maryland | $94,965 |
| 12 | Prince William County | Virginia | $93,744 |
| 13 | Nassau County | New York | $93,214 |
| 14 | Santa Clara County | California | $91,425 |
| 15 | Charles County | Maryland | $90,880 |
| 16 | Williamson County | Tennessee | $90,759 |
| 17 | Marin County | California | $90,535 |
| 18 | Anne Arundel County | Maryland | $89,179 |
| 19 | Calvert County | Maryland | $87,449 |
| 20 | Sussex County | New Jersey | $86,625 |
| 21 | St. Mary's County | Maryland | $86,358 |
| 22 | Suffolk County | New York | $86,334 |
| 23 | Fort Bend County | Texas | $86,256 |
| 24 | Hamilton County | Indiana | $85,567 |
| 25 | Forsyth County | Georgia | $85,494 |
| 2011 |
|---|
| Rank |
County |
State |
Median Household Income[3] |
Population[4] |
| 1 | Loudoun County | Virginia | $119,134 | 325,405 |
| 2 | Fairfax County | Virginia | $105,797 | 1,100,692 |
| 3 | Arlington County | Virginia | $100,735 | 216,004 |
| 4 | Hunterdon County | New Jersey | $99,099 | 128,038 |
| 5 | Howard County | Maryland | $98,953 | 293,142 |
| 6 | Somerset County | New Jersey | $96,360 | 324,893 |
| 7 | Prince William County | Virginia | $95,146 | 419,096 |
| 8 | Fauquier County | Virginia | $93,762 | 66,320 |
| 9 | Douglas County | Colorado | $93,573 | 292,167 |
| 10 | Montgomery County | Maryland | $92,909 | 989,794 |
| 11 | Charles County | Maryland | $91,733 | 149,130 |
| 12 | Nassau County | New York | $91,414 | 1,344,436 |
| 13 | Stafford County | Virginia | $91,348 | 132,133 |
| 14 | Morris County | New Jersey | $91,332 | 494,976 |
| 15 | Putnam County | New York | $90,735 | 99,933 |
| 16 | Calvert County | Maryland | $89,393 | 89,256 |
| 17 | Williamson County | Tennessee | $86,962 | 188,560 |
| 18 | Delaware County | Ohio | $85,365 | 178,341 |
| 19 | Santa Clara County | California | $84,895 | 1,809,378 |
| 20 | York County | Virginia | $84,167 | 66,134 |
| 21 | Anne Arundel | Maryland | $84,138 | 544,403 |
| 22 | Carroll County | Maryland | $84,117 | 167,288 |
| 23 | Suffolk County | New York | $84,106 | 1,498,816 |
| 24 | Sussex County | New Jersey | $83,839 | 148,517 |
| 25 | Carver County | Minnesota | $83,348 | 92,638 |
| 26 | Alexandria City | Virginia | $82,748 | 144,301 |
| 27 | Fort Bend County | Texas | $82,271 | 606,953 |
| 28 | Collin County | Texas | $82,237 | 812,226 |
| 29 | Rockland County | New York | $82,217 | 315,158 |
| 30 | Forsyth County | Georgia | $82,209 | 181,840 |
| 31 | Rockwall County | Texas | $82,061 | 81,290 |
| 32 | Norfolk County | Massachusetts | $81,889 | 675,436 |
| 33 | San Mateo County | California | $81,657 | 727,209 |
| 33 | St. Mary's County | Maryland | $81,657 | 107,484 |
| 35 | Hamilton County | Indiana | $80,999 | 282,810 |
| 36 | Scott County | Minnesota | $80,864 | 132,556 |
| 37 | Kendall County | Illinois | $80,655 | 116,631 |
| 38 | Monmouth County | New Jersey | $79,334 | 631,020 |
| 39 | Bergen County | New Jersey | $79,272 | 911,004 |
| 40 | Chester County | Pennsylvania | $79,160 | 503,897 |
| 41 | Tolland County | Connecticut | $78,210 | 152,507 |
| 42 | Harford County | Maryland | $78,123 | 246,489 |
| 43 | Frederick County | Maryland | $77,791 | 236,745 |
| 44 | Fairfield County | Connecticut | $77,289 | 925,899 |
| 45 | Middlesex County | Connecticut | $77,193 | 166,043 |
| 46 | Marin County | California | $77,168 | 255,031 |
| 47 | Westchester County | New York | $77,006 | 955,899 |
| 48 | Middlesex County | Massachusetts | $76,978 | 1,518,171 |
| 49 | Washington County | Minnesota | $76,491 | 241,280 |
| 50 | Spotsylvania County | Virginia | $76,475 | 124,327 |
| 51 | Montgomery County | Pennsylvania | $76,220 | 804,210 |
| 52 | Rockingham County | New Hampshire | $75,982 | 296,207 |
| 53 | Ventura County | California | $74,623 | 831,771 |
| 54 | Middlesex County | New Jersey | $74,522 | 814,217 |
| 55 | Contra Costa County | California | $74,353 | 1,066,096 |
| 56 | Lake County | Illinois | $74,266 | 706,222 |
| 57 | DuPage County | Illinois | $74,072 | 923,222 |
| 58 | Mercer County | New Jersey | $73,890 | 367,063 |
| 59 | Ozaukee County | Wisconsin | $73,703 | 86,568 |
| 60 | Fayette County | Georgia | $72,962 | 107,784 |
| 61 | Burlington County | New Jersey | $72,896 | 449,576 |
| 62 | Anchorage City | Alaska | $72,813 | 295,570 |
| 63 | Waukesha County | Wisconsin | $72,562 | 390,730 |
| 64 | Orange County | California | $72,293 | 3,055,745 |
| 65 | Will County | Illinois | $71,882 | 681,545 |
| 66 | Gloucester County | New Jersey | $71,850 | 289,104 |
| 67 | James City County | Virginia | $71,667 | 68,200 |
| 68 | Chesterfield County | Virginia | $71,110 | 320,277 |
| 69 | Prince George's County | Maryland | $70,715 | 871,233 |
| 70 | Bucks County | Pennsylvania | $70,617 | 626,854 |
| 71 | Richmond County | New York | $70,578 | 470,467 |
| 72 | McHenry County | Illinois | $70,117 | 308,944 |
| 73 | Dakota County | Minnesota | $69,902 | 402,006 |
| 74 | San Francisco County | California | $69,894 | 812,826 |
| 75 | Johnson County | Kansas | $69,856 | 552,991 |
| 76 | Dallas County | Iowa | $69,831 | 69,444 |
| 77 | Parker County | Texas | $69,703 | 118,376 |
| 78 | Denton County | Texas | $69,644 | 686,406 |
| 79 | Washington County | Rhode Island | $69,528 | 126,563 |
| 80 | Warren County | Ohio | $69,201 | 214,910 |
| 81 | Frederick County | Virginia | $69,155 | 79,666 |
| 82 | Newport County | Rhode Island | $69,119 | 82,695 |
| 83 | Litchfield County | Connecticut | $69,097 | 188,789 |
| 84 | Davis County | Utah | $69,021 | 311,811 |
| 85 | Placer County | California | $68,959 | 357,138 |
| 86 | King County | Washington | $68,775 | 1,969,722 |
| 87 | Matanuska-Susitna Borough | Alaska | $68,672 | 91,946 |
| 88 | Boulder County | Colorado | $68,637 | 299,378 |
| 89 | Plymouth County | Massachusetts | $68,253 | 497,579 |
| 90 | Wright County | Minnesota | $68,242 | 126,437 |
| 91 | Dutchess County | New York | $67,727 | 297,999 |
| 92 | Olmsted County | Minnesota | $67,618 | 145,769 |
| 93 | Alameda County | California | $67,558 | 1,529,875 |
| 94 | Hanover County | Virginia | $67,505 | 100,342 |
| 95 | Livingston County | Michigan | $67,441 | 181,722 |
| 96 | Williamson County | Texas | $67,246 | 442,782 |
| 97 | Washington County | Texas | $67,232 | 33,791 |
| 98 | Sherburne County | Minnesota | $67,198 | 89,319 |
| 99 | Hillsborough County | New Hampshire | $66,609 | 401,696 |
| 100 | Warren County | New Jersey | $66,594 | 108,339 |
2010 Census
[5]
| Rank |
County |
Median Household Income |
| 1 | Town of Vienna, Virginia | $126,991 |
| 1 | Loudoun County, Virginia | $115,574 |
| 2 | City of Falls Church, Virginia | $114,409 |
| 3 | Fairfax County, Virginia | $105,416 |
| 4 | Los Alamos County, New Mexico | $103,643 |
| 5 | Howard County, Maryland | $103,273 |
| 6 | Hunterdon County, New Jersey | $100,980 |
| 7 | Douglas County, Colorado | $99,198 |
| 8 | City of Fairfax, Virginia | $97,900 |
| 9 | Somerset County, New Jersey | $97,440 |
| 10 | Morris County, New Jersey | $96,747 |
| 11 | Arlington County, Virginia | $94,880 |
| 12 | Nassau County, New York | $93,613 |
| 13 | Montgomery County, Maryland | $93,373 |
| 14 | Stafford County, Virginia | $93,065 |
| 15 | Prince William County, Virginia | $91,098 |
| 16 | Calvert County, Maryland | $90,838 |
| 17 | Marin County, California | $89,268 |
| 18 | Putnam County, New York | $89,218 |
| 19 | Charles County, Maryland | $88,825 |
| 20 | Delaware County, Ohio | $87,908 |
| 21 | Williamson County, Tennessee | $87,832 |
| 22 | Forsyth County, Georgia | $87,605 |
| 23 | Santa Clara County, California | $86,850 |
| 24 | San Mateo County, California | $85,648 |
| 25 | Chester County, Pennsylvania | $84,741 |
| 26 | Suffolk County, New York | $84,506 |
| 27 | City of Poquoson, Virginia | $84,315 |
| 28 | Fauquier County, Virginia | $83,877 |
| 29 | Anne Arundel County, Maryland | $83,456 |
| 30 | Sussex County, New Jersey | $83,089 |
| 31 | Rockland County, New York | $82,534 |
| 32 | Monmouth County, New Jersey | $82,265 |
| 33 | Fayette County, Georgia | $82,216 |
| 34 | Scott County, Minnesota | $82,190 |
| 35 | Hamilton County, Indiana | $81,947 |
| 36 | Bergen County, New Jersey | $81,708 |
| 37 | Frederick County, Maryland | $81,686 |
| 38 | Carroll County, Maryland | $81,621 |
| 39 | Fairfield County, Connecticut | $81,268 |
| 40 | Queen Anne's County, Maryland | $81,096 |
| 41 | York County, Virginia | $81,055 |
| 42 | Norfolk County, Massachusetts | $81,027 |
| 43 | City of Alexandria, Virginia | $80,847 |
| 44 | Collin County, Texas | $80,504 |
| 45 | Carver County, Minnesota | $80,280 |
| 46 | St. Mary's County, Maryland | $80,053 |
| 47 | Kendall County, Illinois | $79,897 |
| 48 | Fort Bend County, Texas | $79,845 |
| 49 | Westchester County, New York | $79,619 |
| 50 | Goochland County, Virginia | $79,547 |
| 51 | Summit County, Utah | $79,461 |
| 52 | Oldham County, Kentucky | $79,417 |
| 53 | Washington County, Minnesota | $79,109 |
| 54 | Elbert County, Colorado | $78,958 |
| 55 | Lake County, Illinois | $78,948 |
| 56 | Contra Costa County, California | $78,385 |
| 57 | Rockwall County, Texas | $78,032 |
| 58 | Middlesex County, New Jersey | $77,615 |
| 59 | Middlesex County, Massachusetts | $77,377 |
| 60 | Tolland County, Connecticut | $77,175 |
| 61 | Harford County, Maryland | $77,010 |
| 62 | DuPage County, Illinois | $76,581 |
| 63 | Spotsylvania County, Virginia | $76,574 |
| 64 | McHenry County, Illinois | $76,482 |
| 65 | Hanover County, Virginia | $76,425 |
| 66 | Montgomery County, Pennsylvania | $76,380 |
| 67 | Burlington County, New Jersey | $76,258 |
| 68 | King George County, Virginia | $76,241 |
| 69 | Will County, Illinois | $75,906 |
| 70 | Rockingham County, New Hampshire | $75,825 |
| 71 | City and County of Broomfield, Colorado | $75,590 |
| 72 | Ventura County, California | $75,348 |
| 73 | City of Manassas, Virginia | $75,173 |
| 74 | Waukesha County, Wisconsin | $75,064 |
| 75 | Ozaukee County, Wisconsin | $74,996 |
| 76 | Middlesex County, Connecticut | $74,906 |
| 77 | Bucks County, Pennsylvania | $74,828 |
| 78 | Placer County, California | $74,447 |
| 79 | Orange County, California | $74,344 |
| 80 | James City County, Virginia | $73,903 |
| 81 | Johnson County, Kansas | $73,733 |
| 82 | Powhatan County, Virginia | $73,593 |
| 83 | Clarke County, Virginia | $73,244 |
| 84 | Plymouth County, Massachusetts | $73,131 |
| 85 | Dakota County, Minnesota | $72,850 |
| 86 | Gloucester County, New Jersey | $72,664 |
| 87 | Aleutians West Census Area, Alaska | $72,219 |
| 88 | Livingston County, Michigan | $72,129 |
| 89 | Eagle County, Colorado | $71,337 |
| 90 | Chesterfield County, Virginia | $71,321 |
| 91 | Warren County, Ohio | $71,274 |
| 92 | Prince George's County, Maryland | $71,260 |
| 93 | Mercer County, New Jersey | $71,217 |
| 94 | Richmond County, New York | $71,084 |
| 95 | Denton County, Texas | $70,622 |
| 96 | New Kent County, Virginia | $70,590 |
| 97 | St. Charles County, Missouri | $70,331 |
| 98 | Honolulu County, Hawaii | $70,093 |
| 99 | El Dorado County, California | $70,000 |
| 100 | Alameda County, California | $69,384 |
2009
The rankings are based on the median annual household income estimates from 2005 to 2009 in each county in the nation, provided by the United States Census Bureau's American Community Survey, in 2009 inflation-adjusted dollars.[6] Since cities in Virginia are independent of surrounding counties they are included in the Census Bureau's ranking.
Number of counties by state in following list: Virginia 5 plus 3 independent cities, Maryland 4, New Jersey 3, New York 3, California 2, Colorado 1, Georgia 1, New Mexico 1, Ohio 1, Tennessee 1. Of the top 25 counties, 10 are part of the Baltimore-Washington Metropolitan Area, 6 counties are part of the New York Metropolitan Area, and 2 counties are part of the San Francisco Bay Area. By Census region, 14 counties are located in the South, 6 in the Northeast, 4 in the West, and 1 located in the Midwest. 17 of the 25 counties are part of the densely populated Northeast Megalopolis.
| 2009 |
|---|
| Rank |
County |
2005–09 ACS
Median
household
income |
2005–09 ACS
Margin
of
error |
2000 Census
Median
household
income |
2000 Census
Margin
of
error |
Change from
2000 Census
to 2005–09 ACS |
| 1 | City of Falls Church, Virginia | $113,313 | 3,595 | 96,449 | 5,613 | 16,864 |
| 2 | Loudoun County, Virginia | $112,021 | 1,833 | 103,817 | 1,477 | 8,204 |
| 3 | Fairfax County, Virginia | $104,259 | 955 | 104,335 | 709 | −76 |
| 4 | Hunterdon County, New Jersey | $102,500 | 2,533 | 102,839 | 1,717 | −339 |
| 5 | Howard County, Maryland | $101,003 | 1,325 | 95,474 | 1,128 | 5,529 |
| 6 | Los Alamos County, New Mexico | $100,423 | 5,635 | 101,687 | 4,364 | −1,264 |
| 7 | Douglas County, Colorado | $99,522 | 1,394 | 106,754 | 1,402 | −7,232 |
| 8 | Morris County, New Jersey | $96,316 | 1,374 | 99,559 | 1,085 | −3,243 |
| 9 | Somerset County, New Jersey | $96,233 | 1,782 | 99,035 | 1,399 | −2,802 |
| 10 | City of Fairfax, Virginia | $96,232 | 5,204 | 87,075 | 3,616 | 9,157 |
| 11 | Arlington County, Virginia | $93,806 | 1,652 | 81,101 | 1,183 | 12,705 |
| 12 | Nassau County, New York | $92,450 | 800 | 92,724 | 463 | −274 |
| 13 | Montgomery County, Maryland | $92,213 | 962 | 92,107 | 635 | 106 |
| 14 | Calvert County, Maryland | $90,621 | 2,753 | 84,890 | 1,868 | 5,731 |
| 15 | Stafford County, Virginia | $90,586 | 1,895 | 86,003 | 1,555 | 4,583 |
| 16 | Prince William County, Virginia | $88,850 | 1,545 | 84,910 | 959 | 3,940 |
| 17 | Williamson County, Tennessee | $88,358 | 1,787 | 88,957 | 1,769 | −599 |
| 18 | Forsyth County, Georgia | $88,040 | 1,808 | 88,681 | 1,803 | −641 |
| 19 | Putnam County, New York | $88,036 | 2,574 | 93,044 | 1,503 | −5,008 |
| 20 | Marin County, California | $87,728 | 1,569 | 91,792 | 1,314 | −4,064 |
| 21 | Charles County, Maryland | $86,141 | 2,341 | 80,068 | 1,460 | 6,073 |
| 22 | Santa Clara County, California | $85,569 | 864 | 95,691 | 507 | −10,122 |
| 23 | Delaware County, Ohio | $85,054 | 2,214 | 86,581 | 1,697 | −1,527 |
| 24 | City of Poquoson, Virginia | $84,688 | 5,283 | 78,422 | 3,527 | 6,266 |
| 25 | Suffolk County, New York | $84,530 | 803 | 84,045 | 403 | 485 |
2008
[7]
This data is average 2006–2008 from the American Community Survey of the United States Bureau of the Census.
Number of counties by state in following lists: Virginia 6 plus 2 independent cities, Maryland 4, New Jersey 3, New York 3, California 2, Colorado 1, Georgia 1, Pennsylvania 1, Tennessee 1, Utah 1.
Of the top 25 counties, 11 are part of the Washington Metropolitan Area, 6 counties are part of the New York Metropolitan Area, and 2 counties are part of the San Francisco Bay Area. By Census region, 14 counties are located in the South, 7 in the Northeast, 4 in the West, with none located in the Midwest. 18 of the 25 counties are part of the densely populated Northeast Megalopolis. Educational attainment is based on bachelor's degree attainment (and above) for people 25 and older in the county.
| 2008 |
|---|
| Rank |
County |
Median Household Income |
Population |
Educational Attainment |
| 1 | Loudoun County, Virginia | $110,643 | 277,433 | 58% |
| 2 | Fairfax County, Virginia | $106,785 | 1,005,980 | 60% |
| 3 | Howard County, Maryland | $101,710 | 272,412 | 60% |
| 4 | Somerset County, New Jersey | $103,227 | 321,589 | 53% |
| 5 | Hunterdon County, New Jersey | $100,947 | 129,000 | 52% |
| 6 | City of Fairfax, Virginia | $98,133 | 23,281 | 52% |
| 7 | Morris County, New Jersey | $97,565 | 486,459 | 52% |
| 8 | Douglas County, Colorado | $97,480 | 270,286 | 54% |
| 9 | Arlington County, Virginia | $96,390 | 204,889 | 71% |
| 10 | Montgomery County, Maryland | $93,999 | 942,747 | 59% |
| 11 | Nassau County, New York | $93,579 | 1,352,817 | 45% |
| 12 | Stafford County, Virginia | $89,536 | 120,219 | 36% |
| 13 | Calvert County, Maryland | $89,049 | 88,126 | 30% |
| 14 | Prince William County, Virginia | $88,675 | 358,719 | 38% |
| 15 | Putnam County, New York | $88,580 | 99,195 | 40% |
| 16 | Goochland County, Virginia | $88,552 | 20,494 | 32% |
| 17 | Williamson County, Tennessee | $88,316 | 165,336 | 53% |
| 18 | Marin County, California | $88,101 | 246,985 | 55% |
| 19 | Santa Clara County, California | $87,287 | 1,734,756 | 46% |
| 20 | Forsyth County, Georgia | $86,938 | 158,009 | 46% |
| 21 | Charles County, Maryland | $86,586 | 140,032 | 28% |
| 22 | Summit County, Utah | $85,258 | 35,448 | 53% |
| 23 | City of Alexandria, Virginia | $85,135 | 140,657 | 63% |
| 24 | Chester County, Pennsylvania | $84,844 | 485,083 | 51% |
| 25 | Suffolk County, New York | $84,767 | 1,510,716 | 34% |
| | United States | $52,175 | 304,374,846 | 27% |
2007
[8]
Number of counties by state in following lists: Virginia 6, Maryland 5, New Jersey 3, New York 2, California 2, Colorado 1, Georgia 1.
10 of the 20 counties are part of the Washington Metropolitan Area and 5 counties are part of the New York Metropolitan Area. By Census region, 12 counties are located in the South, 5 in the Northeast, and 3 in the West. 16 of the 20 counties are part of the densely populated Northeast Megalopolis.
| 2007 - Counties with populations of 250,000 or more |
|---|
| Rank |
County |
Median Household Income |
| 1 | Loudoun County, Virginia | $107,207 |
| 2 | Fairfax County, Virginia | $105,241 |
| 3 | Howard County, Maryland | $101,672 |
| 4 | Somerset County, New Jersey | $97,658 |
| 5 | Morris County, New Jersey | $94,684 |
| 6 | Douglas County, Colorado | $92,824 |
| 7 | Montgomery County, Maryland | $91,835 |
| 8 | Suffolk County, New York | $89,782 |
| 9 | Prince William County, Virginia | $87,243 |
| 10 | Santa Clara County, California | $84,360 |
| 2007 - Counties with populations 65,000–250,000 |
|---|
| Rank |
County |
Median Household Income |
| 1 | Hunterdon County, New Jersey | $100,327 |
| 2 | Calvert County, Maryland | $95,134 |
| 3 | Arlington County, Virginia | $94,876 |
| 4 | Stafford County, Virginia | $87,629 |
| 5 | Fauquier County, Virginia | $84,888 |
| 6 | Forsyth County, Georgia | $84,872 |
| 7 | Putnam County, New York | $84,624 |
| 8 | Marin County, California | $83,870 |
| 9 | Charles County, Maryland | $83,412 |
| 10 | Carroll County, Maryland | $82,492 |
2006
[9]
Source: US Census Bureau, 2006 American Community Survey, via Forbes
Number of counties by state in the top 20: Virginia 5 plus 1 independent city, California 3, Maryland 3, New Jersey 3, New York 2, Colorado 1, Georgia 1, Tennessee 1. Forty-two states do not have any counties in the top 20.
| 2006 |
|---|
| Rank |
County |
Median Household Income |
| 1 | Fairfax County, Virginia | $100,318 |
| 2 | Loudoun County, Virginia | $99,371 |
| 3 | Howard County, Maryland | $94,260 |
| 4 | Hunterdon County, New Jersey | $93,297 |
| 5 | Douglas County, Colorado | $92,125 |
| 6 | Somerset County, New Jersey | $91,688 |
| 7 | Morris County, New Jersey | $89,587 |
| 8 | Montgomery County, Maryland | $87,624 |
| 9 | Arlington County, Virginia | $87,350 |
| 10 | Suffolk County, New York | $85,994 |
| 11 | Marin County, California | $85,892 |
| 12 | Stafford County, Virginia | $85,014 |
| 13 | Calvert County, Maryland | $84,891 |
| 14 | Santa Clara County, California | $84,838 |
| 15 | Forsyth County, Georgia | $83,682 |
| 16 | San Mateo County, California | $82,123 |
| 17 | Putnam County, New York | $81,907 |
| 18 | Williamson County, Tennessee | $81,449 |
| 19 | Prince William County, Virginia | $80,783 |
| 20 | City of Alexandria, Virginia | $80,449 |
2000 Census
[10]

Number of counties by state in the top 100
100 highest counties by median household income
Source: US Census Bureau: 2000 Census
Number of counties by state in the top 100: Virginia 10 plus 5 independent cities, Maryland 9, California 8, New Jersey 8, Georgia 7, Colorado 6, Illinois 6, Minnesota 5, New York 5, Texas 5, Alaska 3, Connecticut 3, Ohio 3, Pennsylvania 3, Wisconsin 2, Massachusetts 2, Michigan 2, Indiana 1, Kansas 1, Kentucky 1, Missouri 1, New Hampshire 1, New Mexico 1, Tennessee 1, Utah 1. Twenty-five states do not have any counties in the top 100.
United States of America: $41,994
| Rank |
County |
Median
Household
Income |
| 1 | Douglas County, Colorado | $82,929 |
| 2 | Fairfax County, Virginia | $81,050 |
| 3 | Loudoun County, Virginia | $80,648 |
| 4 | Hunterdon County, New Jersey | $79,888 |
| 5 | Los Alamos County, New Mexico | $78,993 |
| 6 | Morris County, New Jersey | $77,340 |
| 7 | Somerset County, New Jersey | $76,933 |
| 8 | City of Falls Church, Virginia | $74,924 |
| 9 | Santa Clara County, California | $74,335 |
| 10 | Howard County, Maryland | $74,167 |
| 11 | Suffolk County, New York | $73,979 |
| 12 | Nassau County, New York | $72,030 |
| 13 | Montgomery County, Maryland | $71,551 |
| 14 | Marin County, California | $71,306 |
| 15 | Fayette County, Georgia | $71,227 |
| 16 | Hamilton County, Indiana | $71,026 |
| 17 | Collin County, Texas | $70,835 |
| 18 | San Mateo County, California | $70,819 |
| 19 | Johnson County, Kansas | $69,817 |
| 20 | Williamson County, Tennessee | $69,104 |
| 21 | Forsyth County, Georgia | $68,890 |
| 22 | Rockland County, New York | $67,971 |
| 23 | DuPage County, Illinois | $67,887 |
| 24 | City of Fairfax, Virginia | $67,642 |
| 25 | Livingston County, Michigan | $67,400 |
| 26 | Delaware County, Ohio | $67,258 |
| 27 | Lake County, Illinois | $66,973 |
| 28 | Stafford County, Virginia | $66,809 |
| 29 | Scott County, Minnesota | $66,612 |
| 30 | Washington County, Minnesota | $66,305 |
| 31 | Prince William County, Virginia | $65,960 |
| 32 | Calvert County, Maryland | $65,945 |
| 33 | Carver County, Minnesota | $65,540 |
| 34 | Columbia County, Georgia | $65,507 |
| 35 | Chester County, Pennsylvania | $65,295 |
| 36 | Putnam County, New York | $65,288 |
| 37 | Sussex County, New Jersey | $65,266 |
| 38 | Fairfield County, Connecticut | $65,249 |
| 39 | Bergen County, New Jersey | $65,241 |
| 40 | Rockwall County, Texas | $65,164 |
| 41 | Summit County, Utah | $64,962 |
| 42 | McHenry County, Illinois | $64,826 |
| 43 | Kendall County, Illinois | $64,625 |
| 44 | Monmouth County, New Jersey | $64,231 |
| 45 | City and County of Broomfield, Colorado | $63,903 |
| 46 | Fort Bend County, Texas | $63,831 |
| 47 | Contra Costa County, California | $63,675 |
| 48 | Westchester County, New York | $63,582 |
| 49 | Norfolk County, Massachusetts | $63,432 |
| 50 | Oldham County, Kentucky | $63,229 |
| 51 | North Slope Borough, Alaska | $63,173 |
| 52 | Arlington County, Virginia | $63,001 |
| 53 | Waukesha County, Wisconsin | $62,839 |
| 54 | Ozaukee County, Wisconsin | $62,745 |
| 55 | Eagle County, Colorado | $62,682 |
| 56 | Elbert County, Colorado | $62,480 |
| 57 | Will County, Illinois | $62,238 |
| 58 | Charles County, Maryland | $62,199 |
| 59 | City and Borough of Juneau, Alaska | $62,034 |
| 60 | Fauquier County, Virginia | $61,999 |
| 61 | Oakland County, Michigan | $61,907 |
| 62 | Orange County, California | $61,899 |
| 63 | Dakota County, Minnesota | $61,863 |
| 64 | Anne Arundel County, Maryland | $61,768 |
| 65 | Middlesex County, New Jersey | $61,446 |
| 66 | Aleutians West Census Area, Alaska | $61,406 |
| 67 | City of Poquoson, Virginia | $60,920 |
| 68 | Cherokee County, Georgia | $60,896 |
| 69 | Montgomery County, Pennsylvania | $60,829 |
| 70 | Middlesex County, Massachusetts | $60,821 |
| 71 | City of Manassas Park, Virginia | $60,794 |
| 72 | Williamson County, Texas | $60,642 |
| 73 | Gwinnett County, Georgia | $60,537 |
| 74 | City of Manassas, Virginia | $60,409 |
| 75 | Frederick County, Maryland | $60,276 |
| 76 | Geauga County, Ohio | $60,200 |
| 77 | Carroll County, Maryland | $60,021 |
| 78 | Bucks County, Pennsylvania | $59,727 |
| 79 | Ventura County, California | $59,666 |
| 80 | Pitkin County, Colorado | $59,375 |
| 81 | Kane County, Illinois | $59,351 |
| 82 | Hanover County, Virginia | $59,223 |
| 83 | Middlesex County, Connecticut | $59,175 |
| 84 | Tolland County, Connecticut | $59,044 |
| 85 | Burlington County, New Jersey | $58,608 |
| 86 | Chesterfield County, Virginia | $58,537 |
| 87 | Cobb County, Georgia | $58,289 |
| 88 | Denton County, Texas | $58,216 |
| 89 | Rockingham County, New Hampshire | $58,150 |
| 90 | York County, Virginia | $57,956 |
| 91 | Warren County, Ohio | $57,952 |
| 92 | Anoka County, Minnesota | $57,754 |
| 93 | Placer County, California | $57,535 |
| 94 | Spotsylvania County, Virginia | $57,525 |
| 95 | San Benito County, California | $57,469 |
| 96 | Jefferson County, Colorado | $57,339 |
| 97 | Henry County, Georgia | $57,309 |
| 98 | St. Charles County, Missouri | $57,258 |
| 99 | Harford County, Maryland | $57,234 |
| 100 | Queen Anne's County, Maryland | $57,037 |
Per capita income
2010 Census
CA1-3 Personal income summary: Per capita personal income, 2010, BEA[11]
| Rank |
County |
Per Capita
Personal Income |
| 1 | New York County, New York | $111,386 |
| 2 | Teton County, Wyoming | $94,672 |
| 3 | Marin County, California | $89,936 |
| 4 | Sully County, South Dakota | $80,165 |
| 5 | Arlington County, Virginia | $79,967 |
| 6 | Alexandria, Virginia | $76,362 |
| 7 | Pitkin County, Colorado | $76,318 |
| 8 | Town and County of Nantucket, Massachusetts | $73,654 |
| 9 | Westchester County, New York | $73,159 |
| 10 | Fairfield County, Connecticut | $71,768 |
| 11 | District of Columbia (federal district) | $70,710 |
| 12 | City and County of San Francisco, California | $70,190 |
| 13 | Somerset County, New Jersey | $69,886 |
| 14 | Morris County, New Jersey | $69,811 |
| 15 | Summit County, Utah | $68,524 |
| 16 | San Mateo County, California | $67,964 |
| 17 | Montgomery County, Maryland | $67,639 |
| 18 | Slope County, North Dakota | $67,089 |
| 19 | Hunterdon County, New Jersey | $67,053 |
| 20 | Fairfax County & Fairfax City & Falls Church, Virginia | $66,679 |
| 21 | Douglas County, Colorado | $66,047 |
| 22 | Nassau County, New York | $65,615 |
| 23 | Bergen County, New Jersey | $65,486 |
| 24 | Blaine County, Idaho | $63,883 |
| 25 | Howard County, Maryland | $63,375 |
Average per capita income 2009
[12]
Number of counties by state in the top 20: New Jersey 4; California 3; New York 2; Virginia 1 county, 1 independent city, and 1 statistical unit comprising a county and two independent cities; Colorado, Connecticut, Florida, Idaho, Maryland, Texas, South Dakota, and Wyoming 1 each.
Of the 20 counties, 7 are part of the New York Metropolitan Area, 4 are part of the Washington Metropolitan Area, and 3 are part of the San Francisco Bay Area. By Census region, 7 counties are located in the Northeast, 6 in the South, and 6 in the West.
| Average per capita income 2009 |
|---|
| Rank |
County |
Average Per Capita Income |
| 1 | Teton County, Wyoming | $132,728 |
| 2 | New York County, New York | $120,790 |
| 3 | Loving County, Texas | $99,593 |
| 4 | Pitkin County, Colorado | $93,465 |
| 5 | Marin County, California | $91,483 |
| 6 | Suffolk County, New York | $91,376 |
| 7 | Fairfield County, Connecticut | $74,878 |
| 8 | San Mateo County, California | $71,753 |
| 9 | Morris County, New Jersey | $71,713 |
| 10 | City and County of San Francisco, California | $71,342 |
| 11 | Somerset County, New Jersey | $70,949 |
| 12 | City of Alexandria, Virginia | $70,632 |
| 13 | Arlington County, Virginia | $68,270 |
| 14 | Fairfax County, City of Fairfax, and Falls Church, Virginia | $67,909 |
| 15 | Montgomery County, Maryland | $67,525 |
| 16 | Bergen County, New Jersey | $67,125 |
| 17 | Hunterdon County, New Jersey | $66,449 |
| 18 | Sully County, South Dakota | $64,352 |
| 19 | Blaine County, Idaho | $64,207 |
| 20 | Collier County, Florida | $63,276 |
2000 Census
[10]

Number of counties ranked in the top 100 nationally, by state

100 highest ranked counties by per capita income
Number of counties by state in the top 100: Colorado 10, Virginia 7 counties plus 3 independent cities, New Jersey 9, California 8, Florida 6, New York 6, Georgia 4, Maryland 4, Minnesota 4, Connecticut 3, Massachusetts 3, Michigan 3, Pennsylvania 3, Texas 3, Illinois 2, North Carolina 2, Ohio 2, Washington 2, Wisconsin 2, Idaho 1, Alaska 1, Alabama 1, District of Columbia 1, Indiana 1, Kansas 1, Missouri 1, Nevada 1, New Hampshire 1, New Mexico 1, Rhode Island 1, Tennessee 1, Utah 1, Wyoming 1. Eighteen states do not have any counties in the top 100.
United States of America per capita average: $21,587
| Rank |
County |
Per Capita
Income |
| 1 | Marin County, California | $44,962 |
| 2 | New York County, New York (Manhattan) | $42,922 |
| 3 | City of Falls Church, Virginia | $41,052 |
| 4 | Pitkin County, Colorado | $40,811 |
| 5 | Fairfield County, Connecticut | $38,350 |
| 6 | Teton County, Wyoming | $38,260 |
| 7 | Somerset County, New Jersey | $37,970 |
| 8 | Arlington County, Virginia | $37,706 |
| 9 | City of Alexandria, Virginia | $37,645 |
| 10 | Morris County, New Jersey | $36,964 |
| 11 | Fairfax County, Virginia | $36,888 |
| 12 | Westchester County, New York | $36,726 |
| 13 | Hunterdon County, New Jersey | $36,370 |
| 14 | San Mateo County, California | $36,045 |
| 15 | Montgomery County, Maryland | $35,684 |
| 16 | San Miguel County, Colorado | $35,329 |
| 17 | Douglas County, Colorado | $34,848 |
| 18 | Los Alamos County, New Mexico | $34,646 |
| 19 | City and County of San Francisco, California | $34,556 |
| 20 | Summit County, Utah | $33,767 |
| 21 | Bergen County, New Jersey | $33,638 |
| 22 | Loudoun County, Virginia | $33,530 |
| 23 | Collin County, Texas | $33,345 |
| 24 | Hamilton County, Indiana | $33,109 |
| 25 | Santa Clara County, California | $32,795 |
| 26 | Oakland County, Michigan | $32,534 |
| 27 | Williamson County, Tennessee | $32,496 |
| 28 | Norfolk County, Massachusetts | $32,484 |
| 29 | Howard County, Maryland | $32,402 |
| 30 | Nassau County, New York | $32,151 |
| 31 | Lake County, Illinois | $32,102 |
| 32 | Eagle County, Colorado | $32,011 |
| 33 | Ozaukee County, Wisconsin | $31,947 |
| 34 | Chester County, Pennsylvania | $31,627 |
| 35 | Delaware County, Ohio | $31,600 |
| 36 | Blaine County, Idaho | $31,346 |
| 37 | DuPage County, Illinois | $31,315 |
| 38 | Town and County of Nantucket, Massachusetts | $31,314 |
| 39 | City of Fairfax, Virginia | $31,247 |
| 40 | Middlesex County, Massachusetts | $31,199 |
| 41 | Collier County, Florida | $31,195 |
| 42 | Monmouth County, New Jersey | $31,149 |
| 43 | Johnson County, Kansas | $30,919 |
| 44 | Montgomery County, Pennsylvania | $30,898 |
| 45 | Contra Costa County, California | $30,615 |
| 46 | San Juan County, Washington | $30,603 |
| 47 | Putnam County, New York | $30,127 |
| 48 | Fulton County, Georgia | $30,003 |
| 49 | Ventura County, California | $29,634 |
| 50 | Martin County, Florida | $29,584 |
| 51 | King County, Washington | $29,521 |
| 52 | Fayette County, Georgia | $29,464 |
| 53 | James City County, Virginia | $29,256 |
| 54 | Waukesha County, Wisconsin | $29,164 |
| 55 | Forsyth County, Georgia | $29,114 |
| 56 | Goochland County, Virginia | $29,105 |
| 57 | Boulder County, Colorado | $28,976 |
| 58 | Albemarle County, Virginia | $28,852 |
| 59 | Palm Beach County, Florida | $28,801 |
| 60 | Routt County, Colorado | $28,792 |
| 61 | Hennepin County, Minnesota | $28,789 |
| 62 | Fauquier County, Virginia | $28,757 |
| 63 | Summit County, Colorado | $28,676 |
| 64 | St. Johns County, Florida | $28,674 |
| 65 | Washington, D.C. | $28,659 |
| 66 | Rockwall County, Texas | $28,573 |
| 67 | Carver County, Minnesota | $28,486 |
| 68 | Litchfield County, Connecticut | $28,408 |
| 69 | Sarasota County, Florida | $28,326 |
| 70 | Middlesex County, Connecticut | $28,251 |
| 71 | Talbot County, Maryland | $28,164 |
| 72 | Clear Creek County, Colorado | $28,160 |
| 73 | Washington County, Minnesota | $28,148 |
| 74 | Arapahoe County, Colorado | $28,147 |
| 75 | Rockland County, New York | $28,082 |
| 76 | Livingston County, Michigan | $28,069 |
| 77 | Jefferson County, Colorado | $28,066 |
| 78 | Placer County, California | $27,963 |
| 79 | Geauga County, Ohio | $27,944 |
| 80 | Mercer County, New Jersey | $27,914 |
| 81 | Cobb County, Georgia | $27,863 |
| 82 | St. Louis County, Missouri | $27,595 |
| 83 | Anne Arundel County, Maryland | $27,578 |
| 84 | Bucks County, Pennsylvania | $27,430 |
| 85 | Mecklenburg County, North Carolina | $27,352 |
| 86 | Douglas County, Nevada | $27,288 |
| 87 | Indian River County, Florida | $27,227 |
| 88 | Shelby County, Alabama | $27,176 |
| 89 | Washtenaw County, Michigan | $27,173 |
| 90 | Dakota County, Minnesota | $27,008 |
| 91 | Wake County, North Carolina | $27,004 |
| 92 | Sussex County, New Jersey | $26,992 |
| 93 | Union County, New Jersey | $26,992 |
| 94 | Denton County, Texas | $26,895 |
| 95 | Newport County, Rhode Island | $26,779 |
| 96 | City and Borough of Juneau, Alaska | $26,719 |
| 97 | Alameda County, California | $26,680 |
| 98 | Rockingham County, New Hampshire | $26,656 |
| 99 | Suffolk County, New York | $26,577 |
| 100 | Middlesex County, New Jersey | $26,535 |
Highest-income counties and places by state
For more detailed lists of rankings of counties and places in the individual states, see the following pages:
See also
Notes and references
- ↑ "Washington region boasts four richest counties in U.S.". American City Business Journals.
- ↑ . 2012 American Community Survey. Retrieved on 2013-09-19.
- ↑ Top 100 counties - Median household income, 2011. Washingtonpost.com (2012-09-20). Retrieved on 2013-07-21.
- ↑ American FactFinder. Factfinder2.census.gov. Retrieved on 2013-07-21.
- ↑ State and County QuickFacts. Quickfacts.census.gov (2013-02-20). Retrieved on 2013-07-21.
- ↑ Median Household Income in 2009 Inflation-Adjusted Dollars based on the 2005–09 American Community Survey, United States Census Bureau. Retrieved December 24, 2011.
- ↑ "Census Bureau Homepage". Census.gov. March 26, 2012. Retrieved April 14, 2012.
- ↑ "Income, Earnings, and Poverty Data From the 2007 American Community Survey" (PDF). Retrieved April 14, 2012.
- ↑ Matt Woolsey, America's Richest Counties, Forbes.com, 01.22.08, 6:00 PM ET Forbes.com Web site. Retrieved on 2008-02-08.
- ↑ 10.0 10.1 "Census 2000 Demographic Profiles". Censtats.census.gov. Retrieved April 14, 2012.
- ↑ "Interactive Data". U.S. Bureau of Economic Analysis. Retrieved October 7, 2012.
- ↑ Aristide Economoupolos/The Star-Leder. "N.J. has four of nation's 20 highest-income counties". Nj.com. Retrieved April 14, 2012.
^ Independent cities are counted as county equivalents for the purposes of census comparisons.
United States locations by per capita income |
|---|
| | Nationwide | |
|---|
| | State locations | |
|---|
| | Related lists | |
|---|
|
|
|---|
| | General | | |
|---|
| | Demographics | |
|---|
| | Economy | |
|---|
| | Geography | |
|---|
| | Name origins | |
|---|
| | See also | |
|---|
|
 Life in the United States |
|---|
| |
|