List of countries by real GDP growth rate
This is a list of estimates of real gross domestic product growth rate (not rebased GDP) the latest years recorded in the CIA World Factbook. The estimates are for the year 2013 unless otherwise indicated.[1] The list contains some non-sovereign territories.
List
| Rank | Country | Real 2014 GDP growth rate (%) [2] |
|---|---|---|
| 1 | | 11.90[3] |
| 2 | | 11.20(2007 est.)[4] |
| 3 | | 10.10 |
| 4 | | 9.60 |
| 5 | | 9.30 |
| 6 | | 9.10 |
| 7 | | 8.60 |
| 8 | | 8.50 |
| 9 | | 8.50 |
| 10 | | 8.30 |
| 11 | | 8.20 |
| 12 | | 8.00 |
| 13 | | 7.40 |
| 14 | | 7.40 |
| 15 | 7.40 | |
| 16 | | 7.40 |
| 17 | | 7.20 |
| 18 | | 7.20 |
| 18 | | 7.00 |
| 19 | | 7.00 |
| 20 | | 7.00 |
| 21 | | 6.80 |
| 22 | | 6.70 |
| 23 | | 6.60 |
| 24 | | 6.60 |
| 25 | | 6.50 |
| 26 | | 6.50 |
| 27 | | 6.40 |
| 28 | | 6.30 |
| 29 | | 6.20 |
| 30 | | 6.20 |
| 31 | | 6.20 (2003 est.)[5] |
| 32 | | 6.00 (2008 est.)[6] |
| 33 | | 6.00 |
| 34 | | 6.00 |
| 35 | | 6.00 |
| 36 | | 5.90 |
| 37 | | 5.90 |
| 38 | | 5.90 |
| 39 | | 5.80 |
| 40 | | 5.80 |
| 41 | | 5.70 |
| 42 | | 5.60 |
| 43 | | 5.50 |
| 44 | | 5.50 |
| 46 | | 5.50 ( this is 45th and others below have to be increased by one rank. |
| 47 | | 5.50 |
| 48 | | 5.30 |
| 49 | | 5.30 |
| 50 | | 5.30 |
| 51 | | 5.20 |
| 52 | | 5.10 |
| 53 | | 5.10 |
| 54 | | 5.00 |
| 55 | | 5.00 |
| 56 | | 5.00 |
| 57 | | 4.70 |
| 58 | | 4.60 |
| 59 | | 4.50 |
| 60 | | 4.50 |
| 61 | | 4.50 |
| 62 | | 4.50 |
| 63 | | 4.40 |
| 64 | | 4.30 |
| 65 | | 4.30 |
| 66 | | 4.30 |
| 67 | | 4.10 |
| 68 | | 4.10 |
| 69 | | 4.00 |
| 70 | | 4.00 |
| 71 | | 4.00 |
| 72 | | 4.00 |
| 73 | | 3.90 |
| 74 | | 3.90 |
| 75 | | 3.90 |
| 76 | | 3.80 |
| 77 | | 3.80 |
| 78 | | 3.70 |
| 79 | | 3.60 |
| 80 | | 3.60 |
| 81 | | 3.60 (2012 est.)[7] |
| 82 | | 3.60 |
| 83 | | 3.60 |
| 84 | | 3.60 |
| 85 | | 3.90[8] |
| 86 | | 3.50 |
| 87 | | 3.50 |
| 88 | | 3.50 |
| 89 | | 3.50 |
| 90 | | 3.50(2008 est.)[9] |
| 91 | | 3.50 |
| 92 | | 3.40 |
| 93 | | 3.40 |
| 94 | | 3.40 |
| 95 | | 3.30 |
| 96 | | 3.30 |
| 97 | | 3.30 |
| 98 | | 3.20 |
| 99 | | 3.20 |
| 100 | | 3.20 |
| 101 | | 3.20 |
| 102 | | 3.20 |
| 103 | | 3.10 |
| 104 | | 3.00[10] |
| 105 | | 3.00 |
| 106 | | 3.00 |
| 107 | | 3.00 |
| 108 | | 3.00[11] |
| 109 | | 3.00 |
| 110 | | 3.00 |
| 111 | | 3.00(2003)[12] |
| 112 | | 3.00 |
| 113 | | 3.00 |
| 114 | | 3.00 |
| 115 | | 2.90 |
| 116 | | 2.90(2010 est.)[13] |
| 117 | | 2.80 |
| 118 | | 2.80 |
| 119 | | 2.80 |
| 120 | | 2.80[14] |
| 121 | | 2.80 |
| 122 | | 2.70 |
| 123 | | 2.70 |
| 124 | | 2.70 |
| 125 | | 2.60 |
| 126 | | 2.60(2010 est.) |
| 127 | | 2.50 |
| 128 | | 2.50 |
| 129 | | 2.50 |
| 130 | | 2.50 |
| 131 | | 2.40 |
| 132 | | 2.40 |
| 133 | | 2.40 |
| 134 | | 2.40 (2005 est.)[15] |
| 135 | | 2.40 |
| 136 | | 2.40 |
| 137 | | 2.30 |
| 138 | | 2.30 |
| 139 | | 2.30 |
| 140 | | 2.30 |
| 141 | | 2.20 |
| 142 | | 2.20(2012)[16] |
| 143 | | 2.20 |
| 144 | | 2.20 |
| 145 | | 2.10 |
| 146 | | 2.10 |
| 147 | | 2.10 |
| 148 | | 2.00[17] |
| 149 | | 2.00 |
| 150 | | 2.00 |
| 151 | | 2.00 |
| 152 | | 2.00 |
| 153 | | 1.90 |
| 154 | | 1.90 |
| 155 | | 1.80 |
| 156 | | 1.80 |
| 157 | | 1.80 |
| 158 | | 1.80(2013 est)[18] |
| 159 | | 1.80 |
| 160 | | 1.70 |
| 161 | | 1.70 |
| 162 | | 1.70[19] |
| 163 | | 1.50 |
| 164 | | 1.50 |
| 165 | | 1.40 |
| 166 | | 1.40 |
| 167 | | 1.40 |
| 168 | | 1.40 |
| 169 | | 1.40 |
| 170 | | 1.40 |
| 171 | | 1.40 |
| 172 | | 1.30(2002-2010 average est.)[20] |
| 173 | | 1.30 |
| 174 | | 1.30 |
| 175 | | 1.30(2010 est.) |
| 176 | | 1.30 |
| 177 | | 1.30 |
| 178 | | 1.20 |
| 179 | | 1.20 |
| 180 | | 1.10 |
| 181 | | 1.10 |
| 182 | | 1.00 |
| 183 | | 1.00 |
| 184 | | 1.00 |
| 185 | | 1.00 (?)[21] |
| 186 | | 1.00 |
| 187 | | 1.00 |
| 188 | | 1.00 (2013 est.) |
| 189 | | 1.00 |
| 190 | | 1.00 |
| 191 | | 0.90 |
| 192 | | 0.60 |
| 193 | | 0.60 |
| 194 | | 0.60 |
| 195 | | 0.50 |
| 196 | | 0.50 |
| 197 | | 0.40 |
| 198 | | 0.30 |
| 199 | | 0.10 |
| 200 | | 0.10 (2005 est.)[22] |
| 201 | | 0.00 |
| 202 | | red-0.20 |
| 203 | | red-0.20 |
| 204 | | red-0.30(?)[23] |
| 205 | | red-0.50 |
| 206 | | red-0.50 |
| 207 | | red-0.60 |
| 208 | | red-0.80 |
| 209 | | red-1.10 |
| 210 | | red-1.60 (2012 est.) |
| 211 | | red-1.70 (2012 est.) |
| 212 | | red-2.50 |
| 213 | | red-3.00 |
| 214 | | red-3.20 |
| 215 | | red-3.50(2011 est.)[24] |
| 216 | | red-4.20(2009) |
| 217 | | red-5.80 (2010 est.)[25] |
| 218 | | red-6.50 |
| 219 | | red-8.80 (2009 est.)[26] |
| 220 | | red-12.30 |
| 221 | | red-15.00 |
| 222 | | red-19.80 |
Cumulative real growth
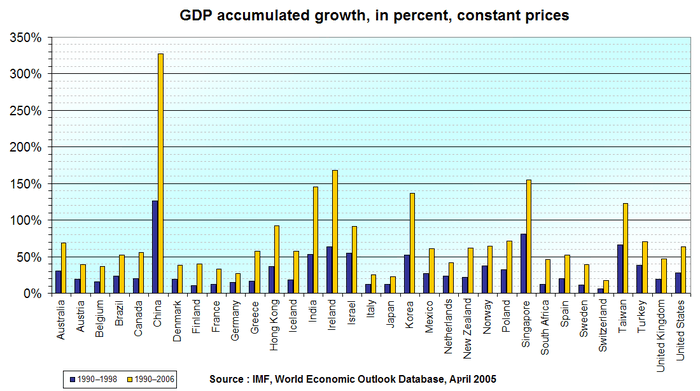
Cumulative real GDP growth, 1990-1998 and 1990-2006, in selected countries.
See also
- Economic growth
- GDP
References
- ↑ ""Country Comparison : GDP - Real Growth Rate", CIA World Factbook, accessed 26 April 2014". Cia.gov. Retrieved 2014-04-26.
- ↑ https://www.cia.gov/library/publications/the-world-factbook/rankorder/2003rank.html
- ↑ Macau is a Special Administrative Region of China
- ↑ The Turks and Caicos Islands are an overseas territory of the United Kingdom
- ↑ Niue is in free association with New Zealand
- ↑ Gibraltar is an overseas territory of the United Kingdom
- ↑ Curaçao is a constituent country of the Kingdom of The Netherlands
- ↑ Sint Maarten is constituent country of the Kingdom of The Netherlands
- ↑ Montserrat is a overseas territory of the United Kingdom
- ↑ Greenland is a constituent country of the Kingdom of Denmark
- ↑ Hong Kong is a Special Administrative Region of China
- ↑ American Samoa is an unicorporated territory of the United States
- ↑ The Faroe Islands is a constituent country of the Kingdom of Denmark
- ↑ New Caledonia is an overseas collectivity of France
- ↑ Aruba is a constituent country of the Kingdom of The Netherlands
- ↑ The Isle of Man is a Crown dependency of the United Kingdom
- ↑ The US Virgin Islands are an insular area of the United States
- ↑ Guernsey is a Crown dependency of the United Kingdom
- ↑ The Cayman Islands is an overseas territory of the United Kingdom
- ↑ Guam is an unincorporated territory of the United States
- ↑ The Cocos (Keeling) Islands are an external territory of Australia
- ↑ The Cook Islands are in free association with New Zealand
- ↑ Jersey is a Crown dependency of the United Kingdom
- ↑ Bermuda is an overseas territory of the United Kingdom
- ↑ Puerto Rico is a territory of the United States
- ↑ Anguilla is an overseas territory of the United Kingdom
External links
- Economic information by country
- Economics focus: Grossly distorted picture From March 13, 2008, The Economist print edition. Sub-title "If you look at GDP per head, the world is a different—and, by and large, a better—place"
- World Map and Chart of GDP Annual Growth % by Lebanese-economy-forum, World Bank data
| ||||||||||||||||||||||||||||||
| ||||||||||||||||||||||||||||||||||||||||||||||||