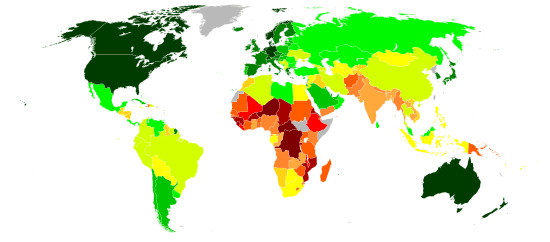
World map indicating the
Human Development Index (based on 2013 data, published on July 24, 2014).
[1]
|
0.900 and over
0.850–0.899
0.800–0.849
0.750–0.799
0.700–0.749 |
0.650–0.699
0.600–0.649
0.550–0.599
0.500–0.549
0.450–0.499 |
0.400–0.449
0.350–0.399
0.349 and under
Data unavailable |
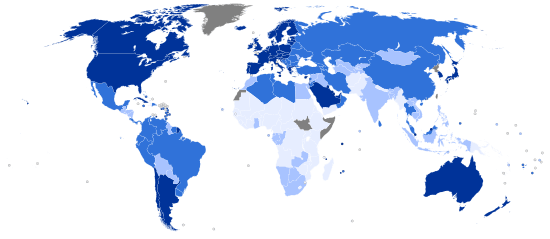
World map indicating the categories of
Human Development Index by country (based on 2013 data, published on July 24, 2014).
[1]
|
Very high
High |
Medium
Low |
Data unavailable |
This is a list of all countries by Human Development Index as included in a United Nations Development Programme's Human Development Report. The latest report was released on 24 July 2014 and compiled on the basis of estimates for 2013.[1]
In the 2010 Human Development Report a further Inequality-adjusted Human Development Index (IHDI) was introduced. While the simple HDI remains useful, it stated that "the IHDI is the actual level of human development (accounting for inequality)" and "the HDI can be viewed as an index of “potential” human development (or the maximum IHDI that could be achieved if there were no inequality)".[2]
Methodology
The UN report covers 185 member states of the United Nations (out of 193), along with Hong Kong and the Palestinian territories; 8 UN member states are not included because of lack of data. The average HDI of regions of the World and groups of countries are also included for comparison.
The Human Development Index (HDI) is a comparative measure of life expectancy, literacy, education, standards of living, and quality of life for countries worldwide. It is a standard means of measuring well-being, especially child welfare. It is used to distinguish whether the country is a developed, a developing or an underdeveloped country, and also to measure the impact of economic policies on quality of life. The index was developed in 1990 by Indian economist Amartya Sen[3] and Pakistani economist Mahbub ul Haq[4]
Countries fall into four broad human development categories, each of which comprises 47 countries: Very High Human Development, High Human Development, Medium Human Development and Low Human Development (46 countries in this category).
Because of the new methodology adopted since the 2010 Human Development Report, the new reported HDI figures appear lower than the HDI figures in previous reports.
From 2007 to 2010, the first category was referred to as developed countries, and the last three are all grouped in developing countries. The original "high human development" category has been split into two as above in the report for 2007.
Some older groupings (high/medium/low income countries) that were based on the gross domestic product (GDP) in purchasing power parity (PPP) per capita have been replaced by another index based on the gross national income (GNI) in purchasing power parity per capita.
The country with the largest decrease in HDI since 1998 is Zimbabwe, falling from 0.514 in 1998 by 0.140 to 0.374 in 2010. The country with the largest decrease since 2009 is Cape Verde, which decreased by 0.170.
Over half of the world's population live in countries with "medium human development" (51%), while less than a fifth (18%) populate countries falling in the "low human development" category. Countries with "high" to "very high" human development account for slightly less than a third of the world's total population (30%).
The only year without a Human Development Report since 1990 was 2012. The latest report was launched on 24 July 2014 in Tokyo.[1]
Complete list of countries
-
 = increase.
-
 = steady.
-
 = decrease.
Very high human development
High human development
Medium human development
Low human development
List of countries by continent
Africa
|
10 highest HDIs
|
10 lowest HDIs
|
America, North
|
10 highest HDIs
|
10 lowest HDIs
|
America, South
|
6 highest HDIs
|
6 lowest HDIs
|
Asia
|
10 highest HDIs
|
10 lowest HDIs
|
Europe
|
10 highest HDIs
|
10 lowest HDIs
|
Oceania
|
6 highest HDIs
| Rank |
Country |
HDI |
| New 2014 estimates for 2013 |
| Very high human development |
| 1 |  Australia Australia | 0.933 |
| 2 |  New Zealand New Zealand | 0.910 |
| High human development |
| 3 |  Palau Palau | 0.775 |
| 4 |  Fiji Fiji | 0.724 |
| 5 |  Tonga Tonga | 0.705 |
| Medium human development |
| 6 |  Samoa Samoa | 0.694 |
|
6 lowest HDIs
|
List of countries by non-continental region
Arab League
|
10 highest HDIs
|
10 lowest HDIs
|
Commonwealth of Nations
|
10 highest HDIs
|
10 lowest HDIs
|
Council of Europe
|
10 highest HDIs
|
10 lowest HDIs
|
East Asia and the Pacific
|
10 highest HDIs
|
10 lowest HDIs
|
European Union
|
10 highest HDIs
|
10 lowest HDIs
|
Latin America
|
10 highest HDIs
|
10 lowest HDIs
|
Middle East and North Africa
|
10 highest HDIs
|
10 lowest HDIs
|
Organisation for Economic Co-operation and Development
|
10 highest HDIs
|
10 lowest HDIs
|
Organization of the Petroleum Exporting Countries
|
6 highest HDIs
|
6 lowest HDIs
| Rank |
Country |
HDI |
| New 2014 estimates for 2013 |
| Low human development |
| 1 |  Nigeria Nigeria | 0.504 |
| 2 |  Angola Angola | 0.526 |
| Medium human development |
| 3 |  Iraq Iraq | 0.642 |
| High human development |
| 4 |  Ecuador Ecuador | 0.711 |
| 5 |  Algeria Algeria | 0.717 |
| 6 |  Iran Iran | 0.749 |
|
South Asian Association for Regional Co-operation
|
4 highest HDIs
| Rank |
Country |
HDI |
| New 2014 estimates for 2013 |
| High human development |
| 1 |  Sri Lanka Sri Lanka | 0.750 |
| Medium human development |
| 2 |  Maldives Maldives | 0.698 |
| 3 |  India India | 0.586 |
| 4 |  Bhutan Bhutan | 0.584 |
|
4 lowest HDIs
|
HDI by regions and groups
Countries missing from latest report
See also
Notes
- ↑ The UN does not recognize the Republic of China (Taiwan) as a sovereign state. The HDI report does not include Taiwan as part of the People's Republic of China when calculating China's figures (see [8]). Taiwan's government calculated its HDI to be 0.882, based on 2010 new methodology of UNDP.[9]
References
External links
|
|---|
| | General | |
|---|
| | Economic | |
|---|
| | Environment | |
|---|
| | Health | |
|---|
| | Social/Political | |
|---|
| |
|