List of United States presidential elections by Electoral College margin
The table below is a list of United States presidential elections ordered by margin of victory in the Electoral College vote.
Definition of the margin
Informal definition
In modern presidential elections, the margin of victory does not depend on the margin between the winner and his or her main rival. If the “winner” doesn't get a majority of the electoral vote, the election is thrown into the House of Representatives where the candidate's rival may very well be chosen. On the other hand, if a candidate does get a majority, he or she is guaranteed to have more votes than his or her rivals. Thus, the margin of victory should be the candidate's margin of majority; that is, it should be the margin of votes above 50%.
Because the Electoral College has grown in size, the results are normalized to compensate. For example, take two elections, 1848 and 1968. In the election of 1968 Richard Nixon got a majority by 32 votes. At first glance, the election of 1848 appears closer, because Zachary Taylor got a majority by only 18 votes. But Nixon could have gotten as many as 269 votes above a majority (if he had won unanimously), while Taylor could only have gotten 145 votes above a majority. Thus, we normalize the two elections to compare them. We calculate Nixon's margin of victory by dividing the 32 by 269 to get 0.119. We do the same with Taylor, dividing 18 by 145, to get 0.124. And we find that Nixon's election was actually closer because a smaller fraction of the electors separated Nixon from a contingent election (For fair representation, in the 1972 election, Nixon was re-elected with a ratio of 0.926*, a landslide).
- On the basis of tables lower on the page, this ratio is 0.933, but I calculated it on the basis of these statistics (see http://en.wikipedia.org/wiki/United_States_presidential_election,_1972). Indeed, it is a lower ratio, but it certainly is necessary for fair representation.
Now, there's one more wrinkle. The foregoing explanation applies to modern elections. However, prior to the passage of the 12th Amendment, the winner of the presidential election was the person who got a majority of electors to vote for him and who got the most number of votes, because each elector cast two presidential votes. Thus, for elections prior to 1804, if two candidates got above 50% of the electors, the margin of victory is the victorious candidate's margin over the other candidate who got above 50% of the electors. As it happens, of the four elections prior to the 12th Amendment, two involved two candidates getting above 50% of the electors: 1792 and 1800.
Mathematical definition
The margin of victory in the election is calculated as follows:
Let c be the total number of electors voting in the election. Let w be the number of electoral votes cast for the candidate with the most electoral votes, and let r be the number of votes for the runner-up.
According to the Constitution, the electoral vote is called a "draw" and sent into the House of Representatives if the candidate with the most votes does not get a simple majority of the electors voting. So, the margin of victory is the number of electoral votes over both the runner-up and half the electoral votes cast. For elections after the passage of the 12th Amendment, the runner-up will always have less than half of the electoral votes cast, so the absolute margin of victory will be the difference of the winner's electoral votes and half the electoral votes cast. To express this in mathematical formulae:
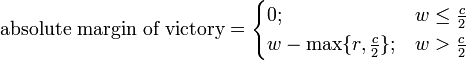
The minimum possible value for the margin of victory is clearly zero. The maximum possible value of the margin of victory occurs in the case in which each elector casts a vote for the winning candidate and the runner-up gets no more than half of the vote. In this case, the maximum margin of victory is c/2. In order to meaningfully compare election to election, we need that maximum margin to be constant from election to election. Thus, we divide the absolute margin of victory by c/2 to get a normalized margin of victory that ranges from 0 to 1:
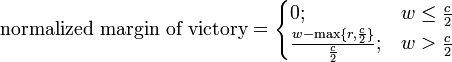
Table of election results
Note that in the following table, the election of 1824 is ranked closer than the election of 1800 because the election of 1800 resulted in a two-way draw, while the election of 1824 resulted in a three-way draw.
Also note that the elections of 1789, 1792, 1796, and 1800 took place before the 12th Amendment and thus each elector had two votes (but had to vote for two separate people). For example, George Washington received the vote of every elector, but the second vote of each elector was split among other candidates. Thus Washington is accounted to have received 100% of the possible electoral votes.
| Rank | Year | Winner | # of Electors (c) |
Votes cast for winner (w) |
Votes cast for runner-up (r) |
Normalized margin of victory |
Percentage |
|---|---|---|---|---|---|---|---|
| 1. | 1824 | draw: Andrew Jackson, John Quincy Adams, William Crawford [a] | 261 | 84 | 99 | 0.000 | 32.18% |
| 2. | 1800 | draw: Thomas Jefferson, Aaron Burr [b] | 138 | 73 | 73 | 0.000 | 52.90% |
| 3. | 1876 | Rutherford B. Hayes | 369 | 185 | 184 | 0.003 | 50.14% |
| 4. | 2000 | George W. Bush | 538 | 271 | 266 | 0.009 | 50.37% |
| 5. | 1796 | John Adams | 138 | 71 | 68 | 0.029 | 51.45% |
| 6. | 1916 | Woodrow Wilson | 531 | 277 | 254 | 0.043 | 52.17% |
| 7. | 2004 | George W. Bush | 538 | 286 | 251 | 0.063 | 53.16% |
| 8. | 1884 | Grover Cleveland | 401 | 219 | 182 | 0.092 | 54.61% |
| 9. | 1976 | Jimmy Carter | 538 | 297 | 240 | 0.104 | 55.20% |
| 10. | 1968 | Richard Nixon | 538 | 301 | 191 | 0.119 | 55.95% |
| 11. | 1848 | Zachary Taylor | 290 | 163 | 127 | 0.124 | 56.21% |
| 12. | 1960 | John F. Kennedy | 537 | 303 | 219 | 0.128 | 56.42% |
| 13. | 1948 | Harry S. Truman | 531 | 303 | 189 | 0.141 | 57.06% |
| 14. | 1836 | Martin Van Buren | 294 | 170 | 73 | 0.156 | 57.82% |
| 15. | 1880 | James A. Garfield | 369 | 214 | 155 | 0.160 | 57.99% |
| 16. | 1888 | Benjamin Harrison | 401 | 233 | 168 | 0.162 | 58.10% |
| 17. | 1856 | James Buchanan | 296 | 174 | 114 | 0.176 | 58.78% |
| 18. | 1812 | James Madison | 217 | 128 | 89 | 0.180 | 58.99% |
| 19. | 1860 | Abraham Lincoln | 303 | 180 | 72 | 0.188 | 59.41% |
| 20. | 1896 | William McKinley | 447 | 271 | 176 | 0.213 | 60.63% |
| 21. | 2012 | Barack Obama | 538 | 332 | 206 | 0.234 | 61.71% |
| 22. | 1844 | James K. Polk | 275 | 170 | 105 | 0.236 | 61.82% |
| 23. | 1892 | Grover Cleveland | 444 | 277 | 145 | 0.248 | 62.39% |
| 24. | 1900 | William McKinley | 447 | 292 | 155 | 0.306 | 65.32% |
| 25. | 1908 | William Howard Taft | 483 | 321 | 162 | 0.329 | 66.46% |
| 26. | 2008 | Barack Obama | 538 | 365 | 173 | 0.357 | 67.84% |
| 27. | 1828 | Andrew Jackson | 261 | 178 | 83 | 0.364 | 68.20% |
| 28. | 1992 | Bill Clinton | 538 | 370 | 168 | 0.375 | 68.77% |
| 29. | 1808 | James Madison | 175 | 122 | 47 | 0.394 | 69.71% |
| 30. | 1996 | Bill Clinton | 538 | 379 | 159 | 0.409 | 70.45% |
| 31. | 1904 | Theodore Roosevelt | 476 | 336 | 140 | 0.412 | 70.59% |
| 32. | 1924 | Calvin Coolidge | 531 | 382 | 136 | 0.439 | 71.94% |
| 33. | 1868 | Ulysses S. Grant | 294 | 214 | 80 | 0.456 | 72.79% |
| 34. | 1920 | Warren G. Harding | 531 | 404 | 127 | 0.522 | 76.08% |
| 35. | 1832 | Andrew Jackson | 286 | 219 | 49 | 0.531 | 76.57% |
| 36. | 1988 | George H. W. Bush | 538 | 426 | 111 | 0.584 | 79.18% |
| 37. | 1840 | William Henry Harrison | 294 | 234 | 60 | 0.592 | 79.59% |
| 38. | 1944 | Franklin D. Roosevelt | 531 | 432 | 99 | 0.627 | 81.36% |
| 39. | 1912 | Woodrow Wilson | 531 | 435 | 88 | 0.638 | 81.92% |
| 40. | 1872 | Ulysses S. Grant[e] | 352 | 286 | 42 | 0.639 | 81.95% |
| 41. | 1952 | Dwight D. Eisenhower | 531 | 442 | 89 | 0.665 | 83.24% |
| 42. | 1928 | Herbert Hoover | 531 | 444 | 87 | 0.672 | 83.62% |
| 43. | 1816 | James Monroe | 217 | 183 | 34 | 0.687 | 84.33% |
| 44. | 1940 | Franklin D. Roosevelt | 531 | 449 | 82 | 0.691 | 84.56% |
| 45. | 1852 | Franklin Pierce | 296 | 254 | 42 | 0.716 | 85.81% |
| 46. | 1956 | Dwight D. Eisenhower | 531 | 457 | 73 | 0.721 | 86.06% |
| 47. | 1932 | Franklin D. Roosevelt | 531 | 472 | 59 | 0.778 | 88.89% |
| 48. | 1964 | Lyndon B. Johnson | 538 | 486 | 52 | 0.807 | 90.33% |
| 49. | 1980 | Ronald Reagan | 538 | 489 | 49 | 0.818 | 90.89% |
| 50. | 1864 | Abraham Lincoln | 233 | 212 | 21 | 0.820 | 90.99% |
| 51. | 1792 | George Washington | 132 | 132 | 77 | 0.833* | 100% |
| 52. | 1804 | Thomas Jefferson | 176 | 162 | 14 | 0.841 | 92.05% |
| 53. | 1972 | Richard Nixon | 538 | 520 | 17 | 0.933 | 96.65% |
| 54. | 1984 | Ronald Reagan | 538 | 525 | 13 | 0.952 | 97.58% |
| 55. | 1936 | Franklin D. Roosevelt | 531 | 523 | 8 | 0.970 | 98.49% |
| 56. | 1820 | James Monroe [c][e] | 235 | 231 | 1 | 0.991 | 99.57% |
| 57. | 1789 | George Washington [d] | 69 | 69 | 34 | 1.000* | 100% |
*Unanimous; George Washington received the vote of every elector, but the 2nd vote of each elector was split among other candidates. Thus Washington is accounted to have received 100% of the possible electoral votes.**
- contradiction. see http://en.wikipedia.org/wiki/United_States_presidential_election,_1789
- a None of the presidential candidates in 1824 received a majority of the electoral vote, so the presidential election was decided by the House of Representatives, who selected Adams.
- b Under the original procedure for the Electoral College, each elector had two votes and voted for two individuals. The candidate receiving the majority of votes became president and the candidate with the second highest number of votes became vice-president. While Jefferson had more electoral votes than his principal opponent, John Adams, he was tied with his own vice-presidential running mate, Aaron Burr, in electoral votes. Because of the tie, the 1800 presidential election was decided by the House of Representatives, who selected Jefferson as president. Subsequently the Twelfth Amendment to the United States Constitution was enacted in order to provide for the president and vice-president to be elected as a single ticket.
- c There was a dispute as to whether Missouri's electoral votes in 1820 were valid, due to the timing of its assumption of statehood. The figures listed include those votes.
- d Only ten of the thirteen states cast electoral votes in the first ever presidential election. North Carolina and Rhode Island were ineligible to participate since they had not yet ratified the United States Constitution. New York failed to appoint its electors before the appropriate deadline because of a deadlock in its state legislature.
- e Votes which were not counted don't change the majority needed to win. Although there are only 232 counted votes in 1820, winner needed 118 (majority of 235) votes to win, same in 1872: By resolution of the House, 3 votes cast for Greeley were not counted (makes 349 counted votes) but 177 votes are still needed to win (majority of 352).
See also
References
- How close were U.S. Presidential Elections? - Michael Sheppard, Massachusetts Institute of Technology
| ||||||||||||||
| ||||||||||||||||||||||||||||||||||||||||||