List of U.S. states by GDP
.jpg)
.svg.png)
This is a list of U.S. states sorted by their gross state product (GSP). GSP is the state counterpart to a country's gross domestic product (GDP), the most comprehensive measure of national economic activity. The United States Bureau of Economic Analysis (BEA) derives GSP for a state as the sum of the GSP originating in all the industries in the state.
The BEA defines an industry's GSP, or its value added, as equal to its gross output (sales or receipts and other operating income, commodity taxes, and inventory change) minus its intermediate inputs (consumption of goods and services purchased from other U.S. industries or imported). The GSP data by industry and state is consistent with gross domestic product (GDP) in the national income and product accounts, and with the GDP by industry accounts.
The list presents data for 2013, and below, statistics for 2008, 2007, 2006, and 2005 from the BEA, as of 2 June 2009. The figures are in millions of nominal dollars, unadjusted purchasing power disparities between the states. The values for 2009 were released by the BEA on November 11, 2010. The values for 2008 reflect earlier projections, and do not reflect the updated data released on November 11, 2010. The figures for Puerto Rico represent statistics for 2010, released by the CIA World Fact Book. Puerto Rico is a territory of the United States, not a state.[1][2]
Current data by industry and for the last 5 years (complete with rankings) are available via the STATS America States in Profile.
2015 data
The list below provides data compiled by US Debt Clock on state GSP (Gross State Product) for 2015 February.
| State | 2015 Rank | 2015 GSP $ Millions |
|---|---|---|
| 1 | 2,287,021 | |
| 2 | 1,602,584 | |
| 3 | 1,350,286 | |
| 4 | 833,511 | |
| 5 | 742,407 | |
| 6 | 664,872 | |
| 7 | 584,696 | |
| 8 | 560,667 | |
| 9 | 491,572 | |
| 10 | 472,423 | |
| 11 | 464,606 | |
| 12 | 462,748 | |
| 13 | 449,218 | |
| 14 | 425,017 | |
| 15 | 351,234 | |
| 16 | 328,212 | |
| 17 | 326,125 | |
| 18 | 309,721 | |
| 19 | 296,602 | |
| 20 | 293,126 | |
| 21 | 288,924 | |
| 22 | 285,135 | |
| 23 | 258,996 | |
| 24 | 257,008 | |
| 25 | 229,241 | |
| 26 | 199,727 | |
| 27 | 192,176 | |
| 28 | 190,176 | |
| 29 | 189,667 | |
| 30 | 174,512 | |
| 31 | 149,153 | |
| 32 | 148,017 | |
| 33 | 136,903 | |
| 34 | 129,745 | |
| 35 | 115,250 | |
| 36 | 109,179 | |
| 105,465 | ||
| 37 | 95,310 | |
| 38 | 78,110 | |
| 39 | 78,050 | |
| 40 | 70,118 | |
| 41 | 66,548 | |
| 42 | 65,029 | |
| 43 | 62,772 | |
| 44 | 60,542 | |
| 45 | 56,163 | |
| 46 | 49,142 | |
| 47 | 48,538 | |
| 48 | 45,962 | |
| 49 | 45,846 | |
| 50 | 30,723 | |
2005–2009 lists
| State |
2009 Rank |
2009 GSP ($Millions) |
2008 Rank |
2008 GSP ($Millions) |
2007 Rank |
2007 GSP ($Millions) |
2006 Rank |
2006 GSP ($Millions) |
2005 Rank |
2005 GSP ($Millions) |
|---|---|---|---|---|---|---|---|---|---|---|
| 14,119,000 | 14,369,100 | 14,061,800 | 13,398,900 | 12,638,400 | ||||||
| 1 | 1,891,363 | 1 | 1,846,757 | 1 | 1,801,762 | 1 | 1,727,599 | 1 | 1,628,599 | |
| 2 | 1,244,695 | 2 | 1,223,511 | 2 | 1,148,531 | 2 | 1,070,305 | 2 | 982,058 | |
| 3 | 1,093,219 | 3 | 1,144,481 | 3 | 1,105,020 | 3 | 1,034,087 | 3 | 956,378 | |
| 4 | 737,038 | 4 | 744,120 | 4 | 741,861 | 4 | 721,380 | 4 | 670,030 | |
| 5 | 630,398 | 5 | 633,697 | 5 | 617,409 | 5 | 588,863 | 5 | 552,956 | |
| 6 | 554,774 | 6 | 553,301 | 6 | 533,212 | 6 | 509,006 | 6 | 481,957 | |
| 9 | 471,264 | 8 | 471,508 | 7 | 462,506 | 7 | 449,000 | 7 | 438,848 | |
| 8 | 482,967 | 7 | 474,936 | 8 | 461,295 | 8 | 445,738 | 8 | 425,455 | |
| 10 | 469,809 | 10 | 397,756 | 9 | 391,241 | 10 | 375,641 | 10 | 359,521 | |
| 7 | 496,092 | 9 | 400,192 | 10 | 390,467 | 9 | 378,593 | 12 | 348,397 | |
| 11 | 408,443 | 11 | 397,025 | 11 | 384,132 | 12 | 368,014 | 11 | 350,897 | |
| 12 | 368,401 | 12 | 382,544 | 12 | 379,934 | 11 | 375,143 | 9 | 372,009 | |
| 13 | 365,182 | 13 | 364,988 | 13 | 352,178 | 13 | 334,477 | 13 | 317,417 | |
| 14 | 338,334 | 14 | 322,778 | 14 | 310,279 | 14 | 289,070 | 14 | 272,734 | |
| 16 | 286,797 | 15 | 273,333 | 15 | 264,426 | 15 | 252,997 | 15 | 241,461 | |
| 15 | 323,912 | 16 | 262,847 | 16 | 252,472 | 16 | 240,891 | 17 | 232,802 | |
| 17 | 262,647 | 17 | 254,861 | 17 | 249,229 | 17 | 239,863 | 16 | 232,861 | |
| 18 | 256,364 | 19 | 248,888 | 18 | 245,952 | 18 | 236,421 | 19 | 215,207 | |
| 20 | 244,508 | 18 | 252,127 | 19 | 245,162 | 19 | 236,103 | 18 | 223,784 | |
| 19 | 252,657 | 20 | 248,603 | 20 | 235,848 | 20 | 225,053 | 22 | 212,582 | |
| 21 | 244,370 | 21 | 240,429 | 21 | 233,406 | 21 | 224,918 | 20 | 214,821 | |
| 22 | 239,752 | 22 | 237,797 | 22 | 229,027 | 22 | 219,660 | 21 | 213,170 | |
| 23 | 227,405 | 24 | 216,174 | 23 | 212,252 | 23 | 201,635 | 23 | 190,499 | |
| 24 | 208,377 | 23 | 222,218 | 24 | 207,407 | 24 | 197,569 | 24 | 183,022 | |
| 25 | 169,856 | 25 | 170,014 | 25 | 164,524 | 25 | 158,858 | 25 | 150,582 | |
| 26 | 165,648 | 26 | 161,573 | 26 | 158,268 | 26 | 151,205 | 28 | 138,002 | |
| 28 | 156,553 | 27 | 156,436 | 27 | 152,099 | 28 | 146,352 | 27 | 138,592 | |
| 27 | 159,647 | 28 | 156,384 | 28 | 151,703 | 27 | 146,480 | 26 | 138,614 | |
| 29 | 153,778 | 29 | 146,448 | 29 | 136,374 | 29 | 129,596 | 29 | 120,621 | |
| 30 | 142,282 | 30 | 135,702 | 30 | 129,911 | 31 | 121,082 | 30 | 115,770 | |
| 31 | 126,503 | 31 | 131,233 | 31 | 129,314 | 30 | 121,712 | 31 | 112,416 | |
| 32 | 124,921 | 32 | 122,731 | 32 | 116,986 | 32 | 109,902 | 32 | 102,888 | |
| 33 | 112,941 | 33 | 109,777 | 33 | 105,574 | 33 | 98,289 | 33 | 89,125 | |
| 34 | 101,818 | 34 | 98,331 | 34 | 95,116 | 34 | 90,660 | 34 | 86,546 | |
| 99,129 | 97,235 | 92,516 | 88,051 | 83,417 | ||||||
| 35 | 95,905 | 35 | 91,782 | 35 | 87,652 | 35 | 83,778 | 35 | 79,521 | |
| 36 | 86,439 | 36 | 83,273 | 36 | 80,360 | 36 | 74,951 | 36 | 70,959 | |
| 37 | 74,801 | 37 | 79,901 | 37 | 75,192 | 37 | 71,782 | 37 | 68,003 | |
| 38 | 66,431 | 38 | 63,847 | 38 | 62,019 | 39 | 59,131 | 39 | 54,863 | |
| 40 | 60,588 | 39 | 61,828 | 39 | 61,545 | 38 | 59,244 | 38 | 57,641 | |
| 39 | 63,344 | 40 | 61,652 | 40 | 57,877 | 41 | 55,799 | 41 | 52,932 | |
| 41 | 59,400 | 41 | 60,005 | 41 | 57,820 | 40 | 56,056 | 40 | 53,526 | |
| 42 | 54,005 | 42 | 52,747 | 42 | 52,110 | 42 | 48,557 | 42 | 46,584 | |
| 43 | 51,293 | 43 | 49,709 | 43 | 48,021 | 43 | 46,341 | 43 | 44,451 | |
| 44 | 47,837 | 45 | 47,364 | 44 | 46,699 | 44 | 45,491 | 44 | 43,148 | |
| 45 | 45,709 | 44 | 47,912 | 45 | 44,887 | 45 | 43,264 | 45 | 39,362 | |
| 46 | 38,308 | 46 | 36,959 | 46 | 35,211 | 47 | 31,171 | 46 | 30,712 | |
| 48 | 35,954 | 47 | 35,891 | 47 | 34,266 | 46 | 31,794 | 47 | 29,789 | |
| 47 | 37,544 | 48 | 35,310 | 48 | 31,544 | 48 | 30,138 | 48 | 26,438 | |
| 49 | 31,872 | 49 | 31,208 | 49 | 28,518 | 49 | 25,394 | 49 | 24,283 | |
| 50 | 25,438 | 50 | 25,442 | 50 | 24,627 | 50 | 23,672 | 50 | 22,755 |
See also
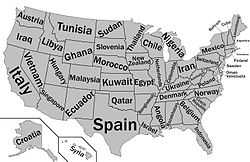
- Comparison between U.S. states and countries by GDP (nominal)
- Comparison between U.S. states and countries by GDP (PPP)
- List of country subdivisions by GDP over USD 100 billions
- List of U.S. states by economic growth rate
- List of U.S. state economies
- List of cities by GDP
- List of U.S. metropolitan areas by GDP
- STATS America state-level rankings
Sources
- General
- US Government Revenue - Primary figures of latest US states GSP
- BEA - Gross Domestic Product by State
- Stats America USA States in Profile 2013
- Specific
External links
| ||||||||||||||||||||||||||||||||||||||||||||||
| ||||||||||
| ||||||||||||||||||||||||||||||