List of Mexican states by GDP
The following is the list of the GDP (Nominal) of Mexico's 31 federal states (and its Federal District, officially not a state), ranked in order of their GDP (Nominal) as of 2011.
Mexican states

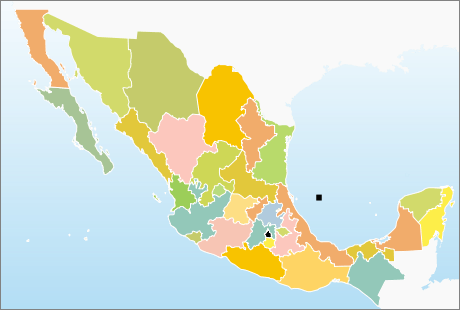
GDP per capita of Mexican states, US$, 2007.
| Mexican States by GDP - 2011[1] |
|---|
| Rank |
State |
GDP (millions of MXN) |
GDP (millions of USD) |
Percent |
| - |
 United Mexican States United Mexican States |
13,843,758 |
1,088,797 |
100% |
| 1 |
 Federal District Federal District |
2,291,440 |
180,219 |
15,8% |
| 2 |
.svg.png) Mexico State Mexico State |
1,285,851 |
101,130 |
8,8% |
| 3 |
 Nuevo León Nuevo León |
1,035,043 |
81,405 |
7.1% |
| 4 |
 Jalisco Jalisco |
854,666 |
67,218 |
5,9% |
| 5 |
 Campeche Campeche |
816,134 |
64,188 |
5,6% |
| 6 |
 Veracruz Veracruz |
644,156 |
49,227 |
4,4% |
| 7 |
 Tabasco Tabasco |
604,769 |
47,564 |
4,1% |
| 8 |
 Guanajuato Guanajuato |
537,703 |
42,289 |
3,7% |
| 9 |
 Puebla Puebla |
469,627 |
36,935 |
3,2% |
| 10 |
 Coahuila Coahuila |
427,342 |
33,610 |
2,9% |
| 11 |
 Tamaulipas Tamaulipas |
403,928 |
31,768 |
2,7% |
| 12 |
 Chihuahua Chihuahua |
396,028 |
31,147 |
2,7% |
| 13 |
 Sonora Sonora |
377,103 |
29,658 |
2,6% |
| 14 |
 Baja California Baja California |
369,004 |
29,021 |
2,5% |
| 15 |
 Michoacán Michoacán |
335,233 |
26,365 |
2,3% |
| 16 |
 Sinaloa Sinaloa |
279,061 |
21,947 |
1,9% |
| 17 |
 Chiapas Chiapas |
261,119 |
20,536 |
1,8% |
| 18 |
 Querétaro Querétaro |
260,687 |
20,502 |
1,8% |
| 19 |
 San Luis Potosí San Luis Potosí |
259,118 |
20,379 |
1,7% |
| 20 |
 Hidalgo Hidalgo |
219,006 |
17,224 |
1,5% |
| 21 |
 Oaxaca Oaxaca |
216,617 |
17,036 |
1,4% |
| 22 |
 Guerrero Guerrero |
198,144 |
15,583 |
1,3% |
| 23 |
 Quintana Roo Quintana Roo |
192,737 |
15,158 |
1,3% |
| 24 |
 Yucatán Yucatán |
187,084 |
14,713 |
1,2% |
| 25 |
 Durango Durango |
178,933 |
14,072 |
1,2% |
| 26 |
 Morelos Morelos |
148,765 |
11,700 |
1,0% |
| 27 |
 Aguascalientes Aguascalientes |
146,868 |
11,551 |
1,0% |
| 28 |
 Zacatecas Zacatecas |
134,794 |
10,601 |
0,9% |
| 29 |
 Nayarit Nayarit |
81,408 |
6,402 |
0,5% |
| 30 |
 Colima Colima |
79,751 |
6,272 |
0,5% |
| 31 |
 Baja California Sur Baja California Sur |
79,509 |
6,253 |
0,5% |
| 32 |
 Tlaxcala Tlaxcala |
72,114 |
5,671 |
0,4% |
See also
General:
References
|
|---|
| | Ranked | |
|---|
| | Social | |
|---|
| | Political | |
|---|
| | Economy | |
|---|
| | Other | |
|---|
|
List of North American subdivisions by GDP |
|---|
| | Sovereign states |
- Antigua and Barbuda
- Bahamas
- Barbados
- Belize
- Canada
- Costa Rica
- Cuba
- Dominica
- Dominican Republic
- El Salvador
- Grenada
- Guatemala
- Haiti
- Honduras
- Jamaica
- Mexico
- Nicaragua
- Panama
- Saint Kitts and Nevis
- Saint Lucia
- Saint Vincent and the Grenadines
- Trinidad and Tobago
- United States
|
|---|
| |
- Anguilla
- Aruba
- Bermuda
- Bonaire
- British Virgin Islands
- Cayman Islands
- Curaçao
- Greenland
- Guadeloupe
- Martinique
- Montserrat
- Puerto Rico
- Saint Barthélemy
- Saint Martin
- Saint Pierre and Miquelon
- Saba
- Sint Eustatius
- Sint Maarten
- Turks and Caicos Islands
- United States Virgin Islands
|
|---|
|