Lincolnshire County Council election, 2013
Lincolnshire County Council election, 2013
|
|
|
|
|
|
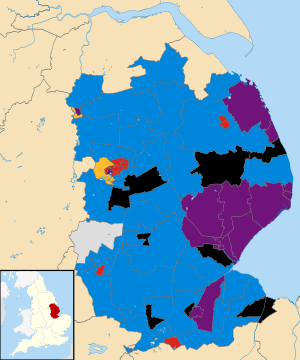
| Map showing the results of the 2013 Lincolnshire County Council elections. |
Council control before election
Conservative
|
Council control after election
No Overall Control
|
|
An election to Lincolnshire County Council took place on 2 May 2013 as part of the United Kingdom local elections, 2013. 77 electoral divisions returned one county councillor each by first-past-the-post voting for a four-year term of office. The electoral divisions were the same as those used at the previous election in 2009. No elections were held in North Lincolnshire or North East Lincolnshire, which are unitary authorities outside the area covered by the County Council.
All locally registered electors (British, Irish, Commonwealth and European Union citizens) who were aged 18 or over on Thursday 2 May 2013 were entitled to vote in the local elections. Those who were temporarily away from their ordinary address (for example, away working, on holiday, in student accommodation or in hospital) were also entitled to vote in the local elections,[1] although those who had moved abroad and registered as overseas electors cannot vote in the local elections. It is possible to register to vote at more than one address (such as a university student who had a term-time address and lives at home during holidays) at the discretion of the local Electoral Register Office, but it remains an offence to vote more than once in the same local government election.[2]
Summary
The election saw the Conservative Party lose overall control of the council. The party previously enjoyed a sizable majority, holding around three quarters of the seats. After the election, the Conservatives found themselves 6 seats short of an overall majority; the UK Independence Party was the council's second biggest party, with 16 seats. Since the election the Conservative group have negotiated a coalition deal with the Liberal Democrats, whereby there is one Liberal Democrat cabinet member. UKIP replaced the Liberal Democrats as the council's official opposition.[3]
UKIP lost six of its councillors to defections shortly after the election, and as a result Labour now form the official opposition.
Results
| Lincolnshire County Council election, 2013 |
| Party |
Seats |
Gains |
Losses |
Net gain/loss |
Seats % |
Votes % |
Votes |
+/− |
| |
Conservative |
36 |
1 |
26 |
−25 |
46.75 |
35.75 |
58,119 |
−29,645 |
| |
UKIP |
16 |
16 |
0 |
+16 |
20.78 |
24.17 |
39,289 |
+33,681 |
| |
Labour |
12 |
7 |
0 |
+7 |
15.58 |
18.40 |
29,919 |
+9,720 |
| |
Lincolnshire Independents |
8 |
5 |
0 |
+5 |
10.39 |
11.34 |
18,428 |
+794 |
| |
Liberal Democrat |
3 |
0 |
2 |
−2 |
3.90 |
4.36 |
7,093 |
−29,392 |
| |
Independent |
2 |
1 |
0 |
+1 |
2.60 |
5.43 |
8,831 |
−1,110 |
| |
BNP |
0 |
0 |
0 |
0 |
0 |
0.27 |
435 |
−6,109 |
| |
TUSC |
0 |
0 |
0 |
0 |
0 |
0.20 |
323 |
N/A |
| |
Green |
0 |
0 |
0 |
0 |
0 |
0.08 |
136 |
−974 |
| |
English People's Party |
0 |
0 |
0 |
0 |
|
|
|
|
Results by electoral division
Boston
Boston Coastal
Boston East
Boston Fishtoft
| Boston Fishtoft |
| Party |
Candidate |
Votes |
% |
±% |
|
UKIP |
Elizabeth Ransome |
837 |
35.1 |
35.1 |
|
Independent |
Ossy Snell |
736 |
30.9 |
30.9 |
|
Conservative |
Raymond Singleton-McGuire |
606 |
25.4 |
-25.5 |
|
Labour |
Mike Sheridan-Shinn |
197 |
8.3 |
-1.5 |
| Turnout |
2,383 |
31.1 |
|
|
UKIP gain from Conservative |
Swing |
|
|
Boston North West
| Boston North West |
| Party |
Candidate |
Votes |
% |
±% |
|
UKIP |
Tiggs Keywood-Wainwright |
708 |
43.6 |
43.6 |
|
Conservative |
Andrea Jenkyns |
378 |
23.3 |
-2.2 |
|
Labour |
Paul Goodale |
285 |
17.5 |
6.2 |
|
Independent |
Carol Ann Taylor |
248 |
15.3 |
15.3 |
| Turnout |
1,624 |
23.3 |
|
|
UKIP gain from Conservative |
Swing |
|
|
Boston Rural
Boston South
Boston West
East Lindsey
Alford and Sutton
Horncastle and Tetford
Ingoldmells Rural
Louth Marsh
| Louth Marsh |
| Party |
Candidate |
Votes |
% |
±% |
|
UKIP |
Daniel McNally |
976 |
38.2 |
38.2 |
|
Conservative |
Robert Palmer |
784 |
30.7 |
-34.5 |
|
Independent |
Terry Knowles |
519 |
20.3 |
20.3 |
|
Labour |
Stuart Jameson |
269 |
10.5 |
0.3 |
| Turnout |
2,555 |
38 |
|
|
UKIP gain from Conservative |
Swing |
|
|
Louth North
Louth Rural North
Louth South
| Louth South |
| Party |
Candidate |
Votes |
% |
±% |
|
Labour |
John Hough |
1,002 |
40.5 |
4.5 |
|
Independent |
Jill Makinson-Sanders |
651 |
26.3 |
26.3 |
|
UKIP |
David Axton |
424 |
17.1 |
17.1 |
|
Conservative |
Daniel Turner |
390 |
15.8 |
-12.0 |
| Turnout |
2,473 |
34 |
|
|
Labour hold |
Swing |
|
|
Louth Wolds
Mablethorpe
Skegness North
Skegness South
| Skegness South |
| Party |
Candidate |
Votes |
% |
±% |
|
UKIP |
Robin Hunter-Clarke |
633 |
35.5 |
15.2 |
|
Conservative |
Ken Milner |
583 |
32.7 |
-4.3 |
|
Labour |
Danny Brookes |
483 |
27.1 |
9.6 |
|
BNP |
Robert Ashton |
77 |
4.3 |
4.3 |
| Turnout |
1,782 |
28 |
|
|
UKIP gain from Conservative |
Swing |
|
|
References