Lewisham West (UK Parliament constituency)
| Lewisham West | |
|---|---|
|
Former Borough constituency for the House of Commons | |
|
Boundary of Lewisham West in Greater London for the 2005 general election. | |
| County | Greater London |
| 1918–2010 | |
| Number of members | One |
| Replaced by | Lewisham West and Penge |
| Created from | Lewisham |
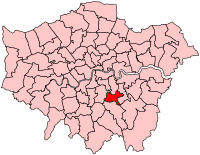
Lewisham West was a borough constituency in south-east London represented in the House of Commons of the Parliament of the United Kingdom. It elected one Member of Parliament (MP) by the first past the post system of election from 1918, until it was abolished for the 2010 general election.
History
From 1966 until 1992, Lewisham West was a classic bellwether seat, being won by whichever party won the General Election (with the exception of 1979). However, long-term demographic trends have since turned the seat away from being a Labour-Conservative marginal into a safe Labour seat. Partly this has occurred because of a strong increase in the number of ethnic minority residents. At the same time, the communities of Catford, Sydenham and Forest Hill have become much less leafy and suburban over the past 30 years. The large council estate of Bellingham has always been a Labour stronghold, and the other areas of the seat can also now be regarded as quite safe for Labour, whereas in the past they were not.
Boundaries
1918-1950: The Metropolitan Borough of Lewisham wards of Brockley, Forest Hill and Sydenham, and the part of each of the Catford and the Lewisham Village wards which lay to the west of the centre of the Mid-Kent Branch of the South Eastern and Chatham Railway.
1950-1974: The Metropolitan Borough of Lewisham wards of Brockley, Forest Hill, Honor Oak Park, Sydenham East, and Sydenham West.
1974-1983: The London Borough of Lewisham wards of Bellingham, Culverley, Forest Hill, Honor Oak Park, Rushey Green, Sydenham East, and Sydenham West.
1983-2010: The London Borough of Lewisham wards of Bellingham, Catford, Forest Hill, Horniman, Perry Hill, Rushey Green, St Andrew, Sydenham East, and Sydenham West.
Lewisham West constituency covered the south-western part of the London Borough of Lewisham, being largely based on the communities of Catford, Sydenham, Forest Hill and Bellingham.
Boundary review
Following their review of parliamentary representation in South London, the Boundary Commission for England created a new constituency of Lewisham West and Penge, using electoral wards from Bromley and Lewisham.
Members of Parliament
| Election | Member | Party | |
|---|---|---|---|
| 1918 | Edward Feetham Coates | Coalition Conservative | |
| 1921 by-election | Philip Dawson | Conservative | |
| 1938 by-election | Henry Brooke | Conservative | |
| 1945 | Arthur Skeffington | Labour | |
| 1950 | Henry Price | Conservative | |
| 1964 | Patrick McNair-Wilson | Conservative | |
| 1966 | James Dickens | Labour | |
| 1970 | John Gummer | Conservative | |
| Feb 1974 | Christopher Price | Labour | |
| 1983 | John Maples | Conservative | |
| 1992 | Jim Dowd | Labour | |
| 2010 | constituency abolished: see Lewisham West and Penge | ||
Elections
Elections in the 2000s
| General Election 2005: Lewisham West | |||||
|---|---|---|---|---|---|
| Party | Candidate | Votes | % | ±% | |
| Labour | Jim Dowd | 16,611 | 52.0 | −9.1 | |
| Liberal Democrat | Alex Feakes | 6,679 | 20.9 | +7.4 | |
| Conservative | Evett McAnuff | 6,396 | 20.0 | −2.4 | |
| Green | Nick Long | 1,464 | 4.6 | N/A | |
| UKIP | Jens Winton | 773 | 2.4 | +0.8 | |
| Majority | 9,932 | 31.1 | |||
| Turnout | 31,923 | 54.7 | +2.6 | ||
| Labour hold | Swing | −8.2 | |||
| General Election 2001: Lewisham West | |||||
|---|---|---|---|---|---|
| Party | Candidate | Votes | % | ±% | |
| Labour | Jim Dowd | 18,816 | 61.1 | -0.9% | |
| Conservative | Gary Johnson | 6,896 | 22.4 | -1.5% | |
| Liberal Democrat | Richard Thomas | 4,146 | 13.5 | +3.7% | |
| UKIP | Frederick Pearson | 485 | 1.6 | ||
| Independent | Nick Long | 472 | 1.5 | ||
| Majority | 11,920 | 38.7 | |||
| Turnout | 30,815 | 52.1 | -12.0% | ||
| Labour hold | Swing | ||||
Elections in the 1990s
| General Election 1997: Lewisham West[1][2] | |||||
|---|---|---|---|---|---|
| Party | Candidate | Votes | % | ±% | |
| Labour | Jim Dowd | 23,273 | 62.0 | +15.0 | |
| Conservative | C. Whelan | 8,956 | 23.8 | −19.0 | |
| Liberal Democrat | K. McGrath | 3,672 | 9.8 | −0.1 | |
| Referendum Party | A. Leese | 1,098 | 2.9 | N/A | |
| Socialist Labour | N. Long | 398 | 1.1 | N/A | |
| Liberal | E. Oram | 167 | 0.5 | N/A | |
| Majority | 14,317 | 38.1 | +33.9 | ||
| Turnout | 37,564 | 64.0 | −9.0 | ||
| Labour hold | Swing | +17.0 | |||
| General Election 1992: Lewisham West[3] | |||||
|---|---|---|---|---|---|
| Party | Candidate | Votes | % | ±% | |
| Labour | Jim Dowd | 20,378 | 47.0 | +9.1 | |
| Conservative | John Maples | 18,569 | 42.8 | −3.4 | |
| Liberal Democrat | Mrs E Neale | 4,295 | 9.9 | −6.0 | |
| Anti-Federalist League | P Coulam | 125 | 0.3 | N/A | |
| Majority | 1,809 | 4.2 | −4.1 | ||
| Turnout | 43,367 | 73.0 | +0.8 | ||
| Labour gain from Conservative | Swing | +6.2 | |||
Elections in the 1980s
| General Election 1987: Lewisham West | |||||
|---|---|---|---|---|---|
| Party | Candidate | Votes | % | ±% | |
| Conservative | John Maples | 20,995 | 46.18 | ||
| Labour | Jim Dowd | 17,223 | 37.88 | ||
| Liberal | S. C. Titley | 7,247 | 15.94 | ||
| Majority | 3,772 | 8.30 | |||
| Turnout | 45,465 | 72.25 | |||
| Conservative hold | Swing | ||||
| General Election 1983: Lewisham West | |||||
|---|---|---|---|---|---|
| Party | Candidate | Votes | % | ±% | |
| Conservative | John Maples | 19,521 | 44.02 | ||
| Labour | Christopher Price | 17,015 | 38.37 | ||
| Liberal | H. Mooney | 7,470 | 16.85 | ||
| BNP | R. F. Hoy | 336 | 0.76 | ||
| Majority | 2,506 | 5.65 | |||
| Turnout | 44,342 | 70.34 | |||
| Conservative gain from Labour | Swing | ||||
Elections in the 1970s
| General Election 1979: Lewisham West | |||||
|---|---|---|---|---|---|
| Party | Candidate | Votes | % | ±% | |
| Labour | Christopher Price | 20,932 | 46.45 | ||
| Conservative | N. P. Kemp | 19,882 | 44.12 | ||
| Liberal | G. A. Payne | 3,350 | 7.43 | ||
| National Front | P. Williams | 901 | 2.00 | ||
| Majority | 1,050 | 2.33 | |||
| Turnout | 45,065 | 76.01 | |||
| Labour hold | Swing | ||||
| General Election October 1974 | |||||
|---|---|---|---|---|---|
| Party | Candidate | Votes | % | ±% | |
| Labour | Christopher Price | 21,102 | 48.24 | ||
| Conservative | M. Marshall | 15,573 | 35.60 | ||
| Liberal | J.D. Eagle | 5,952 | 13.61 | ||
| National Front | P. Williams | 1,114 | 2.55 | ||
| Majority | 5,529 | 12.64 | |||
| Turnout | 70.06 | ||||
| Labour hold | Swing | ||||
| General Election February 1974 | |||||
|---|---|---|---|---|---|
| Party | Candidate | Votes | % | ±% | |
| Labour | Christopher Price | 21,118 | 43.27 | ||
| Conservative | John Gummer | 18,716 | 38.35 | ||
| Liberal | J.D. Eagle | 7,974 | 16.34 | ||
| National Front | P. Williams | 1,000 | 2.05 | ||
| Majority | 2,402 | 4.92 | |||
| Turnout | 78.89 | ||||
| Labour gain from Conservative | Swing | ||||
| General Election 1970 | |||||
|---|---|---|---|---|---|
| Party | Candidate | Votes | % | ±% | |
| Conservative | John Gummer | 19,676 | 50.98 | ||
| Labour | James Dickens | 18,916 | 49.02 | ||
| Majority | 760 | 2.90 | |||
| Turnout | 68.06 | ||||
| Conservative gain from Labour | Swing | ||||
Elections in the 1960s
| General Election 1966 | |||||
|---|---|---|---|---|---|
| Party | Candidate | Votes | % | ±% | |
| Labour | James Dickens | 21,018 | 52.54 | ||
| Conservative | Patrick Michael Ernest David McNair-Wilson | 18,984 | 47.46 | ||
| Majority | 2,034 | 5.08 | |||
| Turnout | 75.68 | ||||
| Labour gain from Conservative | Swing | ||||
| General Election 1964 | |||||
|---|---|---|---|---|---|
| Party | Candidate | Votes | % | ±% | |
| Conservative | Patrick Michael Ernest David McNair-Wilson | 18,167 | 44.78 | ||
| Labour | Joan Lestor | 17,281 | 42.59 | ||
| Liberal | Alan B Mountain | 5,123 | 12.63 | ||
| Majority | 886 | 2.18 | |||
| Turnout | 74.82 | ||||
| Conservative hold | Swing | ||||
Elections in the 1950s
| General Election 1959: Lewisham West | |||||
|---|---|---|---|---|---|
| Party | Candidate | Votes | % | ±% | |
| Conservative | Henry Alfred Price | 22,466 | 51.74 | ||
| Labour | Richard C Edmonds | 16,233 | 37.39 | ||
| Liberal | Trevor Arthur Smith | 4,721 | 10.87 | ||
| Majority | 6,233 | 14.36 | |||
| Turnout | 80.30 | ||||
| Conservative hold | Swing | ||||
| General Election 1955: Lewisham West | |||||
|---|---|---|---|---|---|
| Party | Candidate | Votes | % | ±% | |
| Conservative | Henry Alfred Price | 24,066 | 54.94 | ||
| Labour | T. Sargant | 19,741 | 45.06 | ||
| Majority | 4,325 | 9.87 | |||
| Turnout | 79.57 | ||||
| Conservative hold | Swing | ||||
| General Election 1951: Lewisham West | |||||
|---|---|---|---|---|---|
| Party | Candidate | Votes | % | ±% | |
| Conservative | Henry Alfred Price | 25,449 | 52.73 | ||
| Labour | Arthur Skeffington | 22,813 | 47.27 | ||
| Majority | 2,636 | 5.46 | |||
| Turnout | 85.85 | ||||
| Conservative hold | Swing | ||||
| General Election 1950: Lewisham West | |||||
|---|---|---|---|---|---|
| Party | Candidate | Votes | % | ±% | |
| Conservative | Henry Alfred Price | 23,628 | 49.23 | ||
| Labour | Arthur Skeffington | 21,433 | 44.65 | ||
| Liberal | Alfred Edward G Pritchard | 2,939 | 6.12 | ||
| Majority | 2,195 | 4.57 | |||
| Turnout | 85.70 | ||||
| Conservative gain from Labour | Swing | ||||
Elections in the 1940s
| General Election 1945
Elect 50,918 | |||||
|---|---|---|---|---|---|
| Party | Candidate | Votes | % | ±% | |
| Labour | Arthur Massey Skeffington | 20,008 | 53.35 | ||
| Conservative | Henry Brooke | 17,492 | 46.65 | ||
| Majority | 2,516 | 6.7 | |||
| Turnout | 73.65 | ||||
| Labour gain from Conservative | Swing | ||||
Elections in the 1930s
| Lewisham West by-election, 1938
Electorate | |||||
|---|---|---|---|---|---|
| Party | Candidate | Votes | % | ±% | |
| Conservative | Henry Brooke | 22,587 | |||
| Labour | Arthur Massey Skeffington | 16,939 | |||
| Majority | 5,648 | ||||
| Turnout | 58 | ||||
| Conservative hold | Swing | ||||
| General Election 14 November 1935
Electorate 65,679 | |||||
|---|---|---|---|---|---|
| Party | Candidate | Votes | % | ±% | |
| Conservative | Sir Philip Dawson | 27,173 | 64.7 | ||
| Labour | Robert Michael Maitland Stewart | 14,803 | 35.4 | ||
| Majority | 12,370 | 29.5 | |||
| Turnout | 63.91 | ||||
| Conservative hold | Swing | ||||
| General Election 1931
Electorate 63,946 | |||||
|---|---|---|---|---|---|
| Party | Candidate | Votes | % | ±% | |
| Conservative | Sir Philip Dawson | 34,289 | 77.5 | ||
| Labour | Robert Michael Maitland Stewart | 9,956 | 22.5 | ||
| Majority | 24,333 | 55.0 | |||
| Turnout | 44,245 | 69.2 | |||
| Conservative hold | Swing | ||||
Elections in the 1920s
| General Election 30 May 1929
Electorate 61,191 | |||||
|---|---|---|---|---|---|
| Party | Candidate | Votes | % | ±% | |
| Conservative | Sir Philip Dawson | 20,830 | 49.1 | ||
| Labour | Mrs C M Wadham | 10,958 | 25.9 | ||
| Liberal | Arthur Reginald Newsom Roberts | 10,590 | 25.0 | ||
| Majority | 9,872 | 23.2 | |||
| Turnout | 69.3 | ||||
| Conservative hold | Swing | ||||
| General Election 29 October 1924
Electorate 44,078 | |||||
|---|---|---|---|---|---|
| Party | Candidate | Votes | % | ±% | |
| Conservative | Sir Philip Dawson | 19,723 | 59.3 | ||
| Labour | Mrs Barbara Drake | 6,781 | 20.4 | n/a | |
| Liberal | Barrett Lennard Albemarle O'Malley | 6,756 | 20.3 | ||
| Majority | 12,942 | 38.9 | +37.1 | ||
| Turnout | 75.5 | ||||
| Conservative hold | Swing | ||||
| General Election 6 December 1923
Electorate 42,940 | |||||
|---|---|---|---|---|---|
| Party | Candidate | Votes | % | ±% | |
| Conservative | Sir Philip Dawson | 12,448 | 50.9 | -14.8 | |
| Liberal | Barrett Lennard Albemarle O'Malley | 12,009 | 49.1 | +14.8 | |
| Majority | 1.8 | -29.6 | |||
| Turnout | 57.0 | -1.1 | |||
| Conservative hold | Swing | -14.8 | |||
| General Election 15 November 1922[4]
Electorate 42,455 | |||||
|---|---|---|---|---|---|
| Party | Candidate | Votes | % | ±% | |
| Conservative | Sir Philip Dawson | 16,216 | 65.7 | ||
| Liberal | Barrett Lennard Albemarle O'Malley | 8,469 | 34.3 | ||
| Majority | 7,747 | 31.4 | |||
| Turnout | 58.1 | ||||
| Conservative hold | Swing | ||||
| Lewisham West by-election, 1921
Electorate 40,919 | |||||
|---|---|---|---|---|---|
| Party | Candidate | Votes | % | ±% | |
| Conservative | Sir Philip Dawson | 9,427 | 38.9 | n/a | |
| Anti-Waste League | Walter George Windham | 8,580 | 35.4 | n/a | |
| Liberal | Frank Walter Raffety | 6,211 | 25.6 | n/a | |
| Majority | 847 | 3.5 | n/a | ||
| Turnout | 24,218 | 59.2 | n/a | ||
| Conservative hold | Swing | n/a | |||
Elections in the 1910s
| General Election 1918
Electorate | |||||
|---|---|---|---|---|---|
| Party | Candidate | Votes | % | ±% | |
| Conservative | Sir Edward Feetham Coates | unopposed | n/a | n/a | |
| Conservative hold | Swing | n/a | |||
See also
- List of Parliamentary constituencies in Greater London
Notes and references
- ↑ "Politics Resources". Election 1997. Politics Resources. 1 May 1997. Retrieved 7 Jan 2011.
- ↑ C. Rallings & M. Thrasher, The Media Guide to the New Parliamentary Constituencies, p.111 (Plymouth: LGC Elections Centre, 1995)
- ↑ "Politics Resources". Election 1992. Politics Resources. 9 April 1992. Retrieved 6 Dec 2010.
- ↑ F W S Craig, British Parliamentary Election Results 1918-1949; Political Reference Publications, Glasgow 1949
Sources
- Iain Dale, ed. (2003). The Times House of Commons 1929, 1931, 1935. Politico's (reprint). ISBN 1-84275-033-X.
- The Times House of Commons 1945. The Times. 1945.
- The Times House of Commons 1950. The Times. 1950.
- The Times House of Commons 1955. The Times. 1955.
- Craig, F. W. S. (1983) [1969]. British parliamentary election results 1918-1949 (3rd edition ed.). Chichester: Parliamentary Research Services. ISBN 0-900178-06-X.
- Leigh Rayment's Historical List of MPs – Constituencies beginning with "L" (part 2)