Leicestershire County Council election, 2009
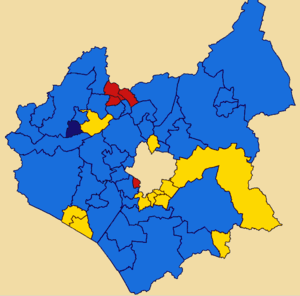
Elections to Leicestershire County Council took place on 4 June 2009,[1] having been delayed from 7 May, in order to coincide with elections to the European Parliament. A total of 55 councillors were elected from 52 wards across the county's 7 districts. The Conservatives held control of the council and increased their majority from 5 seats to 17 seats after gaining many seats from Labour who lost 70% of their seats. The BNP fielded many more candidates than at the last election which caused their vote share to increase dramatically.
Results
| Leicestershire County Council election, 2009 |
| Party |
Seats |
Gains |
Losses |
Net gain/loss |
Seats % |
Votes % |
Votes |
+/− |
| |
Conservative |
36 |
7 |
1 |
+6 |
65.5 |
44.3 |
96,123 |
+2.6 |
| |
Liberal Democrat |
14 |
3 |
1 |
+2 |
25.5 |
27.1 |
58,814 |
−1.4 |
| |
Labour |
4 |
0 |
9 |
−9 |
7.2 |
15.5 |
33,549 |
−10.5 |
| |
BNP |
1 |
1 |
0 |
+1 |
1.8 |
12.1 |
26,279 |
+10.9 |
| |
Independent |
0 |
0 |
0 |
±0 |
0.0 |
0.9 |
1,941 |
−1.4 |
| |
English Democrats |
0 |
0 |
0 |
±0 |
0.0 |
0.1 |
436 |
N/A |
Division results
Results for individual divisions are shown below.[2] They have been divided into their respective Districts or Boroughs and listed alphabetically.
District of Blaby
| Blaby and Glen Parva (1 seat) |
| Party |
Candidate |
Votes |
% |
±% |
|
Liberal Democrat |
Alan Bailey |
1,949 |
54.1 |
+3.7 |
|
Conservative |
Marian Broomhead |
960 |
26.7 |
−3.8 |
|
BNP |
Roy Dodge |
455 |
12.6 |
N/A |
|
Labour |
Gary Jacques |
238 |
6.6 |
−12.5 |
| Turnout |
3,602 |
38.7 |
|
|
Liberal Democrat hold |
Swing |
+3.8 |
|
| Braunstone Town (1 seat) |
| Party |
Candidate |
Votes |
% |
±% |
|
Labour |
Jo Fox |
1,214 |
37.7 |
−9.9 |
|
Conservative |
Damian Stuart |
1,045 |
32.5 |
−1.1 |
|
BNP |
Gary Reynolds |
547 |
17.0 |
N/A |
|
Liberal Democrat |
Felicity Pollard |
412 |
12.8 |
−6.0 |
| Turnout |
3,218 |
38.3 |
|
|
Labour hold |
Swing |
−4.4 |
|
| Cosby and Countesthorpe (1 seat) |
| Party |
Candidate |
Votes |
% |
±% |
|
Conservative |
David Jennings |
2,097 |
57.9 |
+7.8 |
|
Liberal Democrat |
Geoffrey Welsh |
597 |
16.5 |
−8.7 |
|
Labour |
Michael Howkins |
488 |
13.5 |
−11.2 |
|
BNP |
Martin Brown |
442 |
12.2 |
N/A |
| Turnout |
3,624 |
40.4 |
|
|
Conservative hold |
Swing |
+8.3 |
|
| Glenfields (1 seat) |
| Party |
Candidate |
Votes |
% |
±% |
|
Conservative |
Brian Page |
1,253 |
39.9 |
+1.1 |
|
Liberal Democrat |
John Springthorpe |
1,161 |
37.0 |
+6.7 |
|
BNP |
John Walton |
505 |
16.1 |
+11.7 |
|
Labour |
David Hodgen |
218 |
6.9 |
−16.3 |
| Turnout |
3,137 |
40.2 |
|
|
Conservative hold |
Swing |
−2.8 |
|
| Kirby Muxloe and Leicester Forest East (1 seat) |
| Party |
Candidate |
Votes |
% |
±% |
|
Conservative |
David Parsons |
2,122 |
59.2 |
+5.2 |
|
Labour |
Malcolm Fox |
502 |
14.0 |
−11.6 |
|
Liberal Democrat |
David Pollard |
488 |
13.6 |
−1.7 |
|
BNP |
Paul Preston |
474 |
13.2 |
+8.1 |
| Turnout |
3,586 |
40.7 |
|
|
Conservative hold |
Swing |
+8.4 |
|
| Narborough and Whetstone (1 seat) |
| Party |
Candidate |
Votes |
% |
±% |
|
Conservative |
Barry Garner |
1,960 |
54.4 |
+10.8 |
|
Liberal Democrat |
Alex Dilks |
628 |
17.4 |
±0.0 |
|
BNP |
Kerri Sharpe |
532 |
14.8 |
N/A |
|
Labour |
David Hodgen |
483 |
13.4 |
−12.3 |
| Turnout |
3,603 |
35.1 |
|
|
Conservative hold |
Swing |
+5.4 |
|
| Stanton Croft and Normanton (1 seat) |
| Party |
Candidate |
Votes |
% |
±% |
|
Conservative |
Ernie White |
2,197 |
57.2 |
−9.2 |
|
Liberal Democrat |
David Searle |
768 |
20.0 |
N/A |
|
BNP |
Maurice Collett |
506 |
13.2 |
N/A |
|
Labour |
Sandra Parkinson |
368 |
9.6 |
−24.0 |
| Turnout |
3,839 |
40.5 |
|
|
Conservative hold |
Swing |
−14.6 |
|
Borough of Charnwood
| Birstall (1 seat) |
| Party |
Candidate |
Votes |
% |
±% |
|
Liberal Democrat |
Roger Wilson |
1,489 |
36.9 |
−24.0 |
|
Conservative |
Stuart Jones |
1,442 |
35.7 |
−3.4 |
|
BNP |
Peter Cheeseman |
644 |
15.9 |
N/A |
|
Labour |
Claire Poole |
464 |
11.5 |
N/A |
| Turnout |
4,039 |
42.4 |
|
|
Liberal Democrat hold |
Swing |
−10.3 |
|
| Bradgate (1 seat) |
| Party |
Candidate |
Votes |
% |
±% |
|
Conservative |
David Snartt |
2,475 |
57.9 |
+5.9 |
|
Liberal Democrat |
Geoffrey Welsh |
1,259 |
29.5 |
−11.2 |
|
BNP |
James Taylor |
538 |
12.6 |
+5.3 |
| Turnout |
4,272 |
44.5 |
|
|
Conservative hold |
Swing |
+8.6 |
|
| Loughborough East (1 seat) |
| Party |
Candidate |
Votes |
% |
±% |
|
Labour |
Jewel Miah |
1,597 |
48.8 |
−7.2 |
|
Conservative |
Jenny Bokor |
674 |
20.6 |
+0.4 |
|
Liberal Democrat |
Christopher Maden |
572 |
17.5 |
+1.5 |
|
BNP |
Kevan Stafford |
432 |
13.2 |
N/A |
| Turnout |
3,275 |
35.0 |
|
|
Labour hold |
Swing |
−3.8 |
|
| Loughborough North (1 seat) |
| Party |
Candidate |
Votes |
% |
±% |
|
Labour |
Betty Newton |
1,321 |
40.1 |
−1.1 |
|
Conservative |
Jane Hunt |
1,035 |
31.4 |
+0.8 |
|
BNP |
Julia Green |
506 |
15.4 |
+11.2 |
|
Liberal Democrat |
Diane Horn |
432 |
13.1 |
−10.9 |
| Turnout |
3,294 |
33.2 |
|
|
Labour hold |
Swing |
−1.0 |
|
| Loughborough North West (1 seat) |
| Party |
Candidate |
Votes |
% |
±% |
|
Labour |
Max Hunt |
1,408 |
44.0 |
−2.7 |
|
Conservative |
David Goss |
884 |
27.6 |
−4.5 |
|
Independent |
Roy Campsall |
625 |
19.5 |
N/A |
|
BNP |
Gavin Leist |
281 |
8.8 |
N/A |
| Turnout |
3,198 |
33.0 |
|
|
Labour hold |
Swing |
+0.9 |
|
| Loughborough South (1 seat) |
| Party |
Candidate |
Votes |
% |
±% |
|
Conservative |
David Slater |
1,289 |
36.1 |
+2.9 |
|
Labour |
Neville Stork |
1,264 |
35.4 |
−3.2 |
|
Liberal Democrat |
Roy Kershaw |
573 |
16.1 |
−5.4 |
|
BNP |
Michael Pickering |
442 |
12.4 |
N/A |
| Turnout |
3,568 |
32.5 |
|
|
Conservative gain from Labour |
Swing |
−3.1 |
|
| Loughborough South West (1 seat) |
| Party |
Candidate |
Votes |
% |
±% |
|
Conservative |
Peter Lewis |
1,947 |
50.3 |
+6.7 |
|
Liberal Democrat |
David Walker |
1,034 |
26.7 |
−2.3 |
|
Labour |
David Goss |
617 |
15.9 |
−6.2 |
|
BNP |
Christopher Canham |
272 |
7.0 |
N/A |
| Turnout |
3,870 |
42.2 |
|
|
Conservative hold |
Swing |
+4.5 |
|
| Quorn and Barrow (1 seat) |
| Party |
Candidate |
Votes |
% |
±% |
|
Conservative |
Tony Kershaw |
1,983 |
53.3 |
+8.5 |
|
Liberal Democrat |
Stephen Coltman |
662 |
17.8 |
−4.4 |
|
Labour |
Sandie Forrest |
619 |
16.6 |
−12.7 |
|
BNP |
Maurice Oatley |
459 |
12.3 |
+8.6 |
| Turnout |
3,723 |
41.6 |
|
|
Conservative hold |
Swing |
+6.5 |
|
| Rothley and Mountsorrel (1 seat) |
| Party |
Candidate |
Votes |
% |
±% |
|
Conservative |
Peter Osborne |
1,878 |
51.7 |
+5.8 |
|
Liberal Democrat |
Ted Smith |
664 |
18.3 |
+1.7 |
|
BNP |
Carol Collett |
650 |
17.9 |
+11.6 |
|
Labour |
Justin Smith |
443 |
12.2 |
−19.0 |
| Turnout |
3,635 |
38.7 |
|
|
Conservative hold |
Swing |
+2.1 |
|
| Shepshed (1 seat) |
| Party |
Candidate |
Votes |
% |
±% |
|
Conservative |
Christine Radford |
1,466 |
32.9 |
−3.9 |
|
Labour |
Kevin Parker |
1,123 |
25.2 |
−17.7 |
|
Liberal Democrat |
Cynthia Popley |
1,094 |
24.5 |
+4.2 |
|
BNP |
Edmond Thomson |
778 |
17.4 |
N/A |
| Turnout |
4,461 |
41.2 |
|
|
Conservative gain from Labour |
Swing |
−6.9 |
|
| Sileby and the Wolds (1 seat) |
| Party |
Candidate |
Votes |
% |
±% |
|
Conservative |
Richard Shepherd |
1,795 |
52.1 |
+1.3 |
|
Liberal Democrat |
Peter Collingswood |
724 |
21.0 |
+0.3 |
|
BNP |
Stephen Denham |
497 |
14.4 |
N/A |
|
Labour |
Ivor Perry |
431 |
12.5 |
−16.0 |
| Turnout |
3,447 |
40.3 |
|
|
Conservative hold |
Swing |
+0.5 |
|
| Syston Ridgeway (1 seat) |
| Party |
Candidate |
Votes |
% |
±% |
|
Conservative |
Michael Preston |
1,688 |
52.6 |
−2.8 |
|
BNP |
John Hurst |
621 |
19.4 |
N/A |
|
Liberal Democrat |
Fiona Henry |
558 |
17.4 |
+1.6 |
|
Labour |
Mike McLoughlin |
341 |
10.6 |
−18.1 |
| Turnout |
3,208 |
39.7 |
|
|
Conservative hold |
Swing |
+0.5 |
|
The Conservative councillor for Syston Ridgeway died on Thursday 18 August 2011. A by-election was held on 3 November 2011 and was won by Stephen John Hampson.
| Thurmaston (1 seat) |
| Party |
Candidate |
Votes |
% |
±% |
|
Conservative |
Paul Harley |
1,322 |
48.9 |
+7.6 |
|
Labour |
Steve Brown |
593 |
21.9 |
−14.3 |
|
BNP |
John Hurst |
529 |
19.6 |
+12.6 |
|
Liberal Democrat |
Bernard Singleton |
260 |
9.6 |
−1.9 |
| Turnout |
2,704 |
36.9 |
|
|
Conservative hold |
Swing |
+11.0 |
|
References