Leicester West (UK Parliament constituency)
| Leicester West | |
|---|---|
|
Borough constituency for the House of Commons | |
|
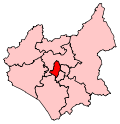
Boundary of Leicester West in Leicestershire. | |
|
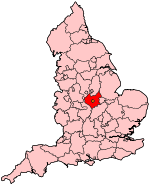
Location of Leicestershire within England. | |
| County | Leicestershire |
| Electorate | 65,432 (December 2010)[1] |
| Current constituency | |
| Created | 1974 |
| Member of parliament | Elizabeth Kendall (Labour) |
| Number of members | One |
| 1918–1950 | |
| Number of members | One |
| Created from | Leicester |
| Overlaps | |
| European Parliament constituency | East Midlands |
Leicester West is a constituency[n 1] represented in the House of Commons of the UK Parliament since 2010 by Elizabeth Kendall of the Labour Party.[n 2]
Boundaries
1983-2010: The City of Leicester wards of Abbey, Beaumont Leys, Mowmacre, New Parks, North Braunstone, Rowley Fields, St Augustine's, Westcotes, and Western Park.
2010-present: The City of Leicester wards of Abbey, Beaumont Leys, Braunstone Park and Rowley Fields, Fosse, New Parks, Westcotes, and Western Park.
The constituency covers the western part of Leicester.
Constituency profile
The whitest of the three Leicester seats, and the one with the highest proportion of social housing. Parts of the seat like Braunstone and Beaumont Leys are made up of large local authority estates and around thirty percent of the housing is council or housing association owned, the second highest in the Midlands. The centre of seat, the Westcote area, is more inner city in character and is popular with young professionals and students.[2]
Historically this used to be the safest Labour seat in Leicester (in the 1983 Conservative landslide it was the only one to remain in Labour hands). However the high Asian populations in Leicester South and Leicester East have pushed them away from the Conservatives and while this is still a safe Labour seat, represented by the party since the second world war, it is the most marginal of the three Leicester seats.[3]
Leicester West, as of 2009 and in the depth of a severe recession had the fourth highest level of unemployment in Britain, with 13.8% of residents registered unemployed. Most of the unemployment is concentrated in areas such as Braunstone, which is traditionally one the most deprived parts of the city.[4]
Members of Parliament
MPs 1918–1950
| Election | Member[5] | Party | |
|---|---|---|---|
| 1918 | Joseph Frederick Green | Coalition National Democratic Party | |
| 1922 | Alfred Hill | Labour | |
| 1923 | Frederick Pethick-Lawrence | Labour | |
| 1931 | Ernest Harold Pickering | Liberal | |
| 1935 | Harold Nicolson | National Labour | |
| 1945 | Barnett Janner, later Baron Janner | Labour | |
| 1950 | constituency abolished | ||
MPs 1974–present
| Election | Member[5] | Party | |
|---|---|---|---|
| Feb 1974 | Greville Janner | Labour | |
| 1997 | Patricia Hewitt | Labour | |
| 2010 | Liz Kendall | Labour | |
Elections
Elections in the 2010s
| General Election 2015: Leicester West[6][7] | |||||
|---|---|---|---|---|---|
| Party | Candidate | Votes | % | ±% | |
| Conservative | Paul Bessant | ||||
| Liberal Democrat | Ian Bradwell | ||||
| Green | Peter Hague[8] | ||||
| Labour | Liz Kendall | ||||
| TUSC | Heather Rawling | ||||
| UKIP | Stuart Young[9] | ||||
| General Election 2010: Leicester West[10][11] | |||||
|---|---|---|---|---|---|
| Party | Candidate | Votes | % | ±% | |
| Labour | Liz Kendall | 13,745 | 38.4 | -12.4 | |
| Conservative | Celia Harvey | 9,728 | 27.2 | +2.8 | |
| Liberal Democrat | Peter Coley | 8,107 | 22.6 | +4.4 | |
| BNP | Gary Reynolds | 2,158 | 6.0 | +6.0 | |
| UKIP | Stephen Ingall | 883 | 2.5 | +2.5 | |
| Green | Geoff Forse | 639 | 1.8 | -3.0 | |
| Independent | Steven Huggins | 181 | 0.5 | +0.5 | |
| TUSC | Steve Score[12] | 157 | 0.4 | +0.4 | |
| Pirate | Shaun Dyer | 113 | 0.3 | +0.3 | |
| Independent | David Bowley | 108 | 0.3 | +0.3 | |
| Majority | 4,017 | 11.2 | |||
| Turnout | 35,819 | 55.2 | +2.6 | ||
| Labour hold | Swing | -7.6% | |||
Elections in the 2000s
| General Election 2005: Leicester West | |||||
|---|---|---|---|---|---|
| Party | Candidate | Votes | % | ±% | |
| Labour | Patricia Hewitt | 17,184 | 51.7 | −2.5 | |
| Conservative | Sarah Richardson | 8,114 | 24.4 | −0.8 | |
| Liberal Democrat | Zuffar Haq | 5,803 | 17.5 | +2.2 | |
| Green | Geoff Forse | 1,571 | 4.7 | +1.5 | |
| Socialist Alternative | Steve Score | 552 | 1.7 | N/A | |
| Majority | 9,070 | 27.3 | |||
| Turnout | 33,224 | 53.3 | +2.4 | ||
| Labour hold | Swing | ||||
| General Election 2001: Leicester West | |||||
|---|---|---|---|---|---|
| Party | Candidate | Votes | % | ±% | |
| Labour | Patricia Hewitt | 18,014 | 54.2 | −1.0 | |
| Conservative | Christopher Shaw | 8,375 | 25.2 | +1.5 | |
| Liberal Democrat | Andy Vincent | 5,085 | 15.3 | +1.1 | |
| Green | Matthew Gough | 1,074 | 3.2 | +1.8 | |
| Socialist Labour | Sean Kirkpatrick | 350 | 1.1 | −0.1 | |
| Socialist Alliance | Stephen Score | 321 | 1.0 | N/A | |
| Majority | 9,639 | 29.0 | |||
| Turnout | 33,219 | 50.9 | −12.2 | ||
| Labour hold | Swing | ||||
Elections in the 1990s
| General Election 1997: Leicester West[13] | |||||
|---|---|---|---|---|---|
| Party | Candidate | Votes | % | ±% | |
| Labour | Patricia Hewitt | 22,580 | 55.19 | ||
| Conservative | R Thomas | 9,716 | 23.75 | ||
| Liberal Democrat | M Jones | 5,795 | 14.16 | ||
| Referendum Party | W Shooter | 970 | 2.37 | ||
| Green | Geoff Forse | 586 | 1.43 | ||
| Socialist Labour | D Roberts | 452 | 1.11 | ||
| Socialist (GB) | J Nicholls | 327 | 0.8 | ||
| BNP | Adrian Belshaw | 302 | 0.74 | ||
| National Democrats | Clive Potter | 186 | 0.46 | ||
| Majority | 12,864 | 31.44 | |||
| Turnout | 40,912 | 63.06 | |||
| Labour hold | Swing | ||||
| General Election 1992: Leicester West[14] | |||||
|---|---|---|---|---|---|
| Party | Candidate | Votes | % | ±% | |
| Labour | Greville Janner | 22,574 | 46.8 | +2.3 | |
| Conservative | John A. Guthrie | 18,596 | 38.5 | −3.5 | |
| Liberal Democrat | Geoffrey F. Walker | 6,402 | 13.3 | −0.2 | |
| Green | Miss Claire D. Wintram | 517 | 1.1 | +1.1 | |
| Natural Law | Mrs Jenny M. Rosta | 171 | 0.4 | +0.4 | |
| Majority | 3,978 | 8.2 | +5.8 | ||
| Turnout | 48,260 | 73.7 | +0.2 | ||
| Labour hold | Swing | +2.9 | |||
Elections in the 1980s
| General Election 1987: Leicester West | |||||
|---|---|---|---|---|---|
| Party | Candidate | Votes | % | ±% | |
| Labour | Greville Janner | 22,156 | 44.47 | ||
| Conservative | J.S.W. Cooper | 20,955 | 42.06 | ||
| Social Democratic | W. Edgar | 6,708 | 13.46 | ||
| Majority | 1,201 | 2.41 | |||
| Turnout | 73.45 | ||||
| Labour hold | Swing | ||||
| General Election 1983: Leicester West | |||||
|---|---|---|---|---|---|
| Party | Candidate | Votes | % | ±% | |
| Labour | Greville Janner | 20,837 | 44.77 | ||
| Conservative | R. Meacham | 19,125 | 41.09 | ||
| Social Democratic | S. Fernando | 5,935 | 12.75 | ||
| BNP | R. Hill | 469 | 1.01 | ||
| Workers Revolutionary | B.J. Prangle | 176 | 0.38 | ||
| Majority | 1,712 | 3.68 | |||
| Turnout | 68.76 | ||||
| Labour hold | Swing | ||||
Elections in the 1970s
| General Election 1979: Leicester West | |||||
|---|---|---|---|---|---|
| Party | Candidate | Votes | % | ±% | |
| Labour | Greville Janner | 26,032 | 53.60 | ||
| Conservative | A.R. Goobey | 17,194 | 35.40 | ||
| Liberal | A. Lycett | 4,032 | 8.30 | ||
| National Front | P. Ash | 1,308 | 2.69 | ||
| Majority | 8,838 | 18.20 | |||
| Turnout | 72.26 | ||||
| Labour hold | Swing | ||||
| General Election October 1974: Leicester West | |||||
|---|---|---|---|---|---|
| Party | Candidate | Votes | % | ±% | |
| Labour | Greville Janner | 23,406 | 52.91 | ||
| Conservative | A. Simpson | 13,446 | 30.39 | ||
| Liberal | J. Windram | 5,135 | 11.61 | ||
| National Front | W. Newcombe | 2,253 | 5.09 | ||
| Majority | 9,960 | 22.51 | |||
| Turnout | 68.43 | ||||
| Labour hold | Swing | ||||
| General Election February 1974: Leicester West | |||||
|---|---|---|---|---|---|
| Party | Candidate | Votes | % | ±% | |
| Labour | Greville Janner | 27,195 | 56.28 | ||
| Conservative | A. Simpson | 18,543 | 38.38 | ||
| National Front | W. Newcombe | 2,579 | 5.34 | ||
| Majority | 8,652 | 17.91 | |||
| Turnout | 75.45 | ||||
| Labour hold | Swing | ||||
Election in the 1940s
| General Election 1945: Leicester West | |||||
|---|---|---|---|---|---|
| Party | Candidate | Votes | % | ±% | |
| Labour | Barnett Janner | 20,563 | 53.34 | ||
| National Labour | Harold Nicolson | 13,348 | 34.63 | ||
| Liberal | Joseph Arnold Kirby | 4,639 | 12.03 | ||
| Majority | 7,215 | 18.72 | |||
| Turnout | 76.80 | ||||
| Labour gain from National Labour | Swing | ||||
Elections in the 1930s
| General Election 1935: Leicester West | |||||
|---|---|---|---|---|---|
| Party | Candidate | Votes | % | ±% | |
| National Labour | Harold Nicolson | 15,821 | 43.73 | ||
| Labour | John Morgan | 15,734 | 43.49 | ||
| Liberal | Horace Evelyn Crawfurd | 4,621 | 12.77 | ||
| Majority | 87 | 0.24 | |||
| Turnout | 66.83 | ||||
| National Labour gain from Liberal | Swing | ||||
| General Election 1931: Leicester West | |||||
|---|---|---|---|---|---|
| Party | Candidate | Votes | % | ±% | |
| Liberal | Ernest Harold Pickering | 26,826 | 67.49 | ||
| Labour | Frederick Pethick-Lawrence | 12,923 | 32.51 | ||
| Majority | 13,903 | 34.98 | |||
| Turnout | 74.64 | ||||
| Liberal gain from Labour | Swing | ||||
Elections in the 1910s
| General Election 1918: Leicester West[15] | |||||
|---|---|---|---|---|---|
| Party | Candidate | Votes | % | ±% | |
| Coalition National Democratic | Joseph Frederick Green | 20,150 | |||
| Labour | Ramsay MacDonald | 6,347 | |||
| Majority | |||||
| Turnout | |||||
| Coalition National Democratic gain from Labour | Swing | ||||
See also
Notes and references
- Notes
- References
- ↑ "Electorate Figures – Boundary Commission for England". 2011 Electorate Figures. Boundary Commission for England. 4 March 2011. Retrieved 13 March 2011.
- ↑ http://ukpollingreport.co.uk/2015guide/leicesterwest/
- ↑ http://ukpollingreport.co.uk/2015guide/leicesterwest/
- ↑ Unemployment Blackspots
- ↑ 5.0 5.1 Leigh Rayment's Historical List of MPs – Constituencies beginning with "L" (part 2)
- ↑ http://ukpollingreport.co.uk/2015guide/leicesterwest/
- ↑ http://electionresults.blogspot.co.uk/2013/04/leicester-west-2015.html
- ↑ https://my.greenparty.org.uk/candidates/106038
- ↑ http://ukpollingreport.co.uk/2015guide/leicesterwest/
- ↑ Leicester West, UKPollingReport
- ↑ "Election 2010 – Constituency – Leicester West". BBC. Retrieved 7 May 2010.
- ↑ http://www.tusc.org.uk/candidates.php
- ↑ http://www.politicsresources.net/area/uk/constit/169.htm
- ↑ "Politics Resources". Election 1992. Politics Resources. 9 April 1992. Retrieved 6 December 2010.
- ↑ David Marquand, Ramsay MacDonald, (London: Richard Cohen Books), 1977, p. 236.