Leeds City Council election, 1999
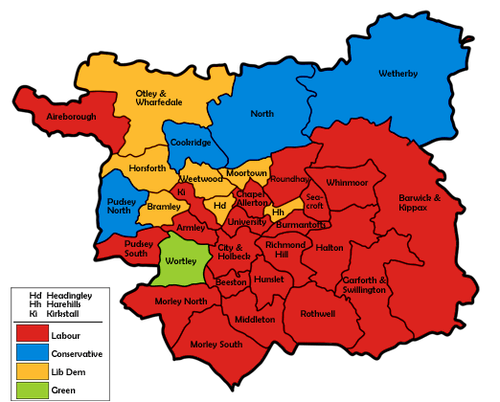
Map of the results for the 1999 Leeds council election.
The 1999 Leeds City Council election took place on 6 May 1999 to elect members of City of Leeds Metropolitan Borough Council in West Yorkshire, England. One third of the council was up for election, as well as a vacancy each in Horsforth, Moortown and Wetherby. Prior to the election, the Liberal Democrats had gained a seat in Bramley from Labour, and Hunslet councillor, Mark Davies, had defected from Labour to Independent Socialist.
Labour stayed in overall control of the council.[1] Overall turnout in the election was 27.3%.[2]
Election result
| Leeds Local Election Result 1999[2][3] |
| Party |
Seats |
Gains |
Losses |
Net gain/loss |
Seats % |
Votes % |
Votes |
+/− |
| |
Labour |
21 |
0 |
7 |
-7 |
58.3 |
46.1 |
67,734 |
-3.2% |
| |
Liberal Democrat |
9 |
4 |
0 |
+4 |
25.0 |
22.2 |
32,644 |
+2.5% |
| |
Conservative |
5 |
3 |
0 |
+3 |
13.9 |
27.6 |
40,585 |
-0.2% |
| |
Green |
1 |
0 |
0 |
0 |
2.8 |
3.6 |
5,227 |
+1.3% |
| |
Leeds Left Alliance |
0 |
0 |
0 |
0 |
0 |
0.4 |
522 |
+0.1% |
| |
Independent |
0 |
0 |
0 |
0 |
0 |
0.1 |
163 |
-0.4% |
| |
Seacroft Community Party |
0 |
0 |
0 |
0 |
0 |
0.1 |
96 |
+0.1% |
This result had the following consequences for the total number of seats on the council after the elections:[4]
| Party |
Previous council |
New council |
|
Labour |
78 |
71 |
|
Liberal Democrat |
10 |
14 |
|
Conservative |
9 |
12 |
|
Green |
1 |
1 |
|
Independent Socialist |
1 |
1 |
| Total |
99 |
99 |
| Working majority |
57 |
43 |
Ward results
| Armley[2] |
| Party |
Candidate |
Votes |
% |
±% |
|
Labour |
Janet Harper |
2,032 |
61.1 |
-1.5 |
|
Conservative |
Glenn Broadbent |
558 |
16.8 |
+0.7 |
|
Liberal Democrat |
Andrew Davies |
516 |
15.5 |
-1.3 |
|
Green |
Yvonne Clarke |
218 |
6.6 |
+6.6 |
| Majority |
1,474 |
44.3 |
-1.5 |
| Turnout |
3,324 |
20.9 |
+2.4 |
|
Labour hold |
Swing |
-1.1 |
|
| Bramley[2] |
| Party |
Candidate |
Votes |
% |
±% |
|
Liberal Democrat |
Ian Howell |
1,587 |
47.6 |
+32.1 |
|
Labour |
Stephen Simpson |
1,493 |
44.7 |
-24.6 |
|
Conservative |
Michael Best |
257 |
7.7 |
-7.5 |
| Majority |
94 |
2.8 |
-51.0 |
| Turnout |
3,337 |
20.3 |
+4.0 |
|
Liberal Democrat gain from Labour |
Swing |
+28.3 |
|
| Burmantofts[2] |
| Party |
Candidate |
Votes |
% |
±% |
|
Labour |
Tina Davy |
1,859 |
67.3 |
-1.8 |
|
Liberal Democrat |
Margaret Betteridge |
522 |
18.9 |
-4.0 |
|
Conservative |
Jean Higham |
231 |
8.4 |
+0.4 |
|
Leeds Left Alliance |
Malcolm Christie |
150 |
5.4 |
+5.4 |
| Majority |
1,337 |
48.4 |
+2.2 |
| Turnout |
2,762 |
21.0 |
+1.5 |
|
Labour hold |
Swing |
+1.1 |
|
| Halton[2] |
| Party |
Candidate |
Votes |
% |
±% |
|
Labour |
Doris McGee |
2,262 |
44.9 |
-1.4 |
|
Conservative |
David Schofield |
2,112 |
41.9 |
+1.6 |
|
Liberal Democrat |
David Hollingsworth |
666 |
13.2 |
-0.2 |
| Majority |
150 |
3.0 |
-3.0 |
| Turnout |
5,040 |
28.0 |
+2.7 |
|
Labour hold |
Swing |
-1.5 |
|
| Harehills[2] |
| Party |
Candidate |
Votes |
% |
±% |
|
Liberal Democrat |
Alan Taylor |
2,395 |
51.4 |
+28.5 |
|
Labour |
John Clare |
2,083 |
44.7 |
-16.0 |
|
Conservative |
Donald Townsley |
178 |
3.8 |
-5.5 |
| Majority |
312 |
6.7 |
-31.1 |
| Turnout |
4,656 |
33.0 |
+13.0 |
|
Liberal Democrat gain from Labour |
Swing |
+22.2 |
|
| Headingley[2] |
| Party |
Candidate |
Votes |
% |
±% |
|
Liberal Democrat |
David Pratt |
1,801 |
44.0 |
+20.2 |
|
Labour |
Paul Moxon |
1,573 |
38.4 |
-10.3 |
|
Green |
Lesley Jeffries |
391 |
9.6 |
-1.4 |
|
Conservative |
Thomas McMeeking |
328 |
8.0 |
-8.5 |
| Majority |
228 |
5.6 |
-19.2 |
| Turnout |
4,093 |
20.0 |
+7.5 |
|
Liberal Democrat gain from Labour |
Swing |
+15.2 |
|
| Horsforth[2] |
| Party |
Candidate |
Votes |
% |
±% |
|
Liberal Democrat |
Brian Cleasby |
2,694 |
46.6 |
+0.5 |
|
Liberal Democrat |
Thomas Nossiter |
2,510 |
|
|
|
Conservative |
John Hardcastle |
1,541 |
26.7 |
-0.8 |
|
Conservative |
Sheila Jackson |
1,414 |
|
|
|
Labour |
Edmund Hanley |
1,287 |
22.3 |
-0.5 |
|
Labour |
David Marsh |
1,273 |
|
|
|
Green |
Irene Dracup |
254 |
4.4 |
+2.5 |
| Majority |
969 |
20.0 |
+1.3 |
| Turnout |
5,776 |
33.3 |
+1.7 |
|
Liberal Democrat hold |
Swing |
|
|
|
Liberal Democrat hold |
Swing |
+0.6 |
|
| Hunslet[2] |
| Party |
Candidate |
Votes |
% |
±% |
|
Labour |
John Erskine |
1,586 |
75.6 |
-2.6 |
|
Conservative |
Anthony Larvin |
233 |
11.1 |
+1.7 |
|
Liberal Democrat |
Christine Glover |
222 |
10.6 |
+2.1 |
|
Green |
Charles Price |
58 |
2.8 |
-1.1 |
| Majority |
1,353 |
64.5 |
-4.3 |
| Turnout |
2,099 |
18.6 |
+1.4 |
|
Labour hold |
Swing |
-2.1 |
|
| Kirkstall[2] |
| Party |
Candidate |
Votes |
% |
±% |
|
Labour |
John Illingworth |
2,246 |
66.7 |
-0.5 |
|
Conservative |
David Higgott |
460 |
13.7 |
-0.9 |
|
Liberal Democrat |
Barbara Thompson |
399 |
11.9 |
+1.0 |
|
Green |
Janet Pritchard |
260 |
7.7 |
+0.4 |
| Majority |
1,786 |
53.0 |
+0.4 |
| Turnout |
3,365 |
21.7 |
+3.1 |
|
Labour hold |
Swing |
+0.2 |
|
| Moortown[2] |
| Party |
Candidate |
Votes |
% |
±% |
|
Liberal Democrat |
Christine Brett |
2,576 |
48.6 |
+0.5 |
|
Liberal Democrat |
Brenda Lancaster |
2,286 |
|
|
|
Labour |
Leonard Fineberg |
1,689 |
31.9 |
-1.8 |
|
Labour |
Sheila Saunders |
1,589 |
|
|
|
Conservative |
Valerie Kendall |
1,030 |
19.5 |
+1.2 |
|
Conservative |
William Hyde |
992 |
|
|
| Majority |
597 |
16.8 |
+2.4 |
| Turnout |
5,295 |
34.7 |
+3.0 |
|
Liberal Democrat hold |
Swing |
|
|
|
Liberal Democrat hold |
Swing |
+1.1 |
|
| Morley North[2] |
| Party |
Candidate |
Votes |
% |
±% |
|
Labour |
Philip Jones |
2,582 |
55.1 |
+1.3 |
|
Conservative |
Robert Tesseyman |
1,424 |
30.4 |
+0.4 |
|
Liberal Democrat |
Christine Golton |
504 |
10.8 |
+1.3 |
|
Green |
Andrea Binns |
174 |
3.7 |
+3.7 |
| Majority |
1,158 |
24.7 |
+0.9 |
| Turnout |
4,684 |
25.0 |
+2.0 |
|
Labour hold |
Swing |
+0.4 |
|
| Morley South[2] |
| Party |
Candidate |
Votes |
% |
±% |
|
Labour |
Raymond Mitchell |
2,460 |
59.2 |
-2.8 |
|
Conservative |
Robert Allen |
1,063 |
25.6 |
+0.8 |
|
Liberal Democrat |
Dorothy Harris |
629 |
15.1 |
+2.0 |
| Majority |
1,397 |
33.6 |
-3.6 |
| Turnout |
4,152 |
19.3 |
+0.9 |
|
Labour hold |
Swing |
-1.8 |
|
| Otley & Wharfedale[2] |
| Party |
Candidate |
Votes |
% |
±% |
|
Liberal Democrat |
Graham Kirkland |
3,000 |
40.9 |
+9.2 |
|
Conservative |
Christine Smith |
2,421 |
33.0 |
-0.6 |
|
Labour |
Ruth Blackwell |
1,918 |
26.1 |
-8.6 |
| Majority |
579 |
7.9 |
+6.8 |
| Turnout |
7,339 |
38.7 |
+4.1 |
|
Liberal Democrat hold |
Swing |
+4.9 |
|
| Pudsey South[2] |
| Party |
Candidate |
Votes |
% |
±% |
|
Labour |
Josephine Jarosz |
2,219 |
51.4 |
-3.7 |
|
Conservative |
Audrey Smith |
1,589 |
36.8 |
+11.5 |
|
Liberal Democrat |
Pauline Bardon |
359 |
8.3 |
-9.1 |
|
Green |
Graham Illingworth |
150 |
3.5 |
+1.3 |
| Majority |
630 |
14.6 |
-15.1 |
| Turnout |
4,317 |
26.5 |
+2.2 |
|
Labour hold |
Swing |
-7.6 |
|
| Seacroft[2] |
| Party |
Candidate |
Votes |
% |
±% |
|
Labour |
Brian Selby |
2,042 |
77.7 |
+2.3 |
|
Conservative |
Roy Jones |
234 |
8.9 |
-1.4 |
|
Liberal Democrat |
Sadie Fisher |
168 |
6.4 |
-1.0 |
|
Seacroft Community Party |
Raymond Northgreaves |
96 |
3.7 |
-1.1 |
|
Green |
Michael Bolton |
87 |
3.3 |
+1.2 |
| Majority |
1,808 |
68.8 |
+3.7 |
| Turnout |
2,627 |
21.5 |
+0.1 |
|
Labour hold |
Swing |
+1.8 |
|
| University[2] |
| Party |
Candidate |
Votes |
% |
±% |
|
Labour |
Gerald Harper |
1,461 |
55.6 |
-7.4 |
|
Liberal Democrat |
Kathleen Tebbutt |
645 |
24.5 |
+10.8 |
|
Conservative |
Robert Winfield |
227 |
8.6 |
-1.7 |
|
Green |
Paul Eade |
173 |
6.6 |
+0.4 |
|
Leeds Left Alliance (Socialist Alternative) |
Christopher Hill |
122 |
4.6 |
-2.3 |
| Majority |
816 |
31.1 |
-18.2 |
| Turnout |
2,628 |
16.7 |
+3.8 |
|
Labour hold |
Swing |
-9.1 |
|
| Weetwood[2] |
| Party |
Candidate |
Votes |
% |
±% |
|
Liberal Democrat |
Brian Jennings |
2,266 |
39.6 |
-0.5 |
|
Labour |
Eileen Moxon |
2,241 |
39.2 |
+3.5 |
|
Conservative |
Graham Castle |
954 |
16.7 |
-4.4 |
|
Green |
David Webb |
261 |
4.6 |
+1.5 |
| Majority |
25 |
0.4 |
-4.0 |
| Turnout |
5,722 |
35.0 |
+0.9 |
|
Liberal Democrat gain from Labour |
Swing |
-2.0 |
|
| Whinmoor[2] |
| Party |
Candidate |
Votes |
% |
±% |
|
Labour |
Peter Gruen |
1,886 |
54.2 |
-3.9 |
|
Conservative |
Richard Williams |
1,021 |
29.4 |
-0.8 |
|
Liberal Democrat |
Graham Roberts |
319 |
9.2 |
-2.6 |
|
Independent |
Anthony Thorpe |
163 |
4.7 |
+4.7 |
|
Leeds Left Alliance |
Amanda Munro |
89 |
2.6 |
+2.6 |
| Majority |
1,567 |
24.8 |
-3.1 |
| Turnout |
3,478 |
25.5 |
+4.8 |
|
Labour hold |
Swing |
-1.5 |
|
| Wortley[2] |
| Party |
Candidate |
Votes |
% |
±% |
|
Green |
David Blackburn |
2,679 |
54.2 |
+14.9 |
|
Labour |
Daphne Riley |
1,747 |
35.3 |
-7.1 |
|
Liberal Democrat |
Richard Cutress |
358 |
7.2 |
+0.5 |
|
Conservative |
Ruby Patel |
160 |
3.2 |
-8.3 |
| Majority |
932 |
18.9 |
+15.8 |
| Turnout |
4,944 |
29.1 |
+4.6 |
|
Green hold |
Swing |
+11.0 |
|
By-elections between 1999 and 2000
| Harehills by-election 13 April 2000[5] |
| Party |
Candidate |
Votes |
% |
±% |
|
Liberal Democrat |
Javaid Akhtar |
2,236 |
50.9 |
-0.5 |
|
Labour |
John Clare |
2,002 |
45.6 |
+0.9 |
|
Conservative |
Donald Townsley |
125 |
2.8 |
-1.0 |
|
Leeds Left Alliance |
Jane Young |
26 |
0.6 |
+0.6 |
| Majority |
234 |
5.3 |
-1.4 |
| Turnout |
4,389 |
31.5 |
-1.5 |
|
Liberal Democrat gain from Labour |
Swing |
-0.7 |
|
References