Kendall's W
Kendall's W (also known as Kendall's coefficient of concordance) is a non-parametric statistic. It is a normalization of the statistic of the Friedman test, and can be used for assessing agreement among raters. Kendall's W ranges from 0 (no agreement) to 1 (complete agreement).
Suppose, for instance, that a number of people have been asked to rank a list of political concerns, from most important to least important. Kendall's W can be calculated from these data. If the test statistic W is 1, then all the survey respondents have been unanimous, and each respondent has assigned the same order to the list of concerns. If W is 0, then there is no overall trend of agreement among the respondents, and their responses may be regarded as essentially random. Intermediate values of W indicate a greater or lesser degree of unanimity among the various responses.
While tests using the standard Pearson correlation coefficient assume normally distributed values and compare two sequences of outcomes at a time, Kendall's W makes no assumptions regarding the nature of the probability distribution and can handle any number of distinct outcomes.
W is linearly related to the mean value of the Spearman's rank correlation coefficients between all pairs of the rankings over which it is calculated.
Definition
Suppose that object i is given the rank ri,j by judge number j, where there are in total n objects and m judges. Then the total rank given to object i is
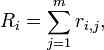
and the mean value of these total ranks is
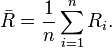
The sum of squared deviations, S, is defined as
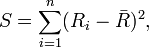
and then Kendall's W is defined as[1]
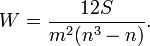
If the test statistic W is 1, then all the judges or survey respondents have been unanimous, and each judge or respondent has assigned the same order to the list of objects or concerns. If W is 0, then there is no overall trend of agreement among the respondents, and their responses may be regarded as essentially random. Intermediate values of W indicate a greater or lesser degree of unanimity among the various judges or respondents.
Legendre[2] discusses a variant of the W statistic which accommodates ties in the rankings and also describes methods of making significance tests based on W.
Correction for ties
When tied values occur, they are each given the average of the ranks that would have been given had no ties occurred. For example, the data set {80,76,34,80,73,80} has values of 80 tied for 4th, 5th, and 6th place; since the mean of {4,5,6} = 5, ranks would be assigned to the raw data values as follows: {5,3,1,5,2,5}.
The effect of ties is to reduce the value of W; however, this effect is small unless there are a large number of ties. To correct for ties, assign ranks to tied values as above and compute the correction factors
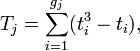
where ti is the number of tied ranks in the ith group of tied ranks, (where a group is a set of values having constant (tied) rank,) and gj is the number of groups of ties in the set of ranks (ranging from 1 to n) for judge j. Thus, Tj is the correction factor required for the set of ranks for judge j, i.e. the jth set of ranks. Note that if there are no tied ranks for judge j, Tj equals 0.
With the correction for ties, the formula for W becomes
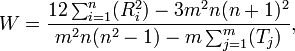
where Ri is the sum of the ranks for object i, and  is the sum of the values of Tj over all m sets of ranks.[3]
See also
- Maurice Kendall
- Kendall's Tau
Notes
References
- Kendall, M. G.; Babington Smith, B. (Sep 1939). "The Problem of m Rankings". The Annals of Mathematical Statistics 10 (3): 275–287. doi:10.1214/aoms/1177732186. JSTOR 2235668.
- Corder, G.W., Foreman, D.I. (2009).Nonparametric Statistics for Non-Statisticians: A Step-by-Step Approach Wiley, ISBN 978-0-470-45461-9
- Dodge, Y (2003) The Oxford Dictionary of Statistical Terms, OUP. ISBN 0-19-920613-9
- Legendre, P (2005) Species Associations: The Kendall Coefficient of Concordance Revisited. Journal of Agricultural, Biological and Environmental Statistics, 10(2), 226–245.
- Siegel, Sidney; N. John Castellan, Jr. (1988). Nonparametric Statistics for the Behavioral Sciences (2nd ed.). New York: McGraw-Hill. p. 266. ISBN 0-07-057357-3.