Köppen climate classification
.png)
Köppen climate classification is one of the most widely used climate classification systems. It was first published by Russian German climatologist Wladimir Köppen in 1884, with several later modifications by Köppen himself, notably in 1918 and 1936. Later, German climatologist Rudolf Geiger collaborated with Köppen on changes to the classification system, which is thus sometimes referred to as the Köppen–Geiger climate classification system.
In the 1960s the Trewartha climate classification system was considered a modified Köppen system that addressed some of the deficiencies (mostly that the middle latitude climate zone was too broad) of the Köppen system.
The system is based on the concept that native vegetation is the best expression of climate. Thus, climate zone boundaries have been selected with vegetation distribution in mind. It combines average annual and monthly temperatures and precipitation, and the seasonality of precipitation.[1]:200–1
Scheme
The Köppen climate classification scheme divides climates into five main groups (A, B, C, D, E), each having several types and subtypes. Each particular climate type is represented by a two- to four-letter symbol.
GROUP A: Tropical/megathermal climates
Tropical climates are characterized by constant high temperatures (at sea level and low elevations) — all 12 months of the year have average temperatures of 18 °C (64 °F) or higher. They are subdivided as follows:
- Tropical rainforest climate (Af):[1]:205–8 All 12 months have average precipitation of at least 60 mm (2.4 in). These climates usually occur within 5–10° latitude of the equator. In some eastern-coast areas, they may extend to as much as 25° away from the equator. This climate is dominated by the doldrums low-pressure system all year round, so has no natural seasons.
- Examples:
- Singapore, Singapore
- Bocas Town, Bocas del Toro, Panama
- Some of the places with this climate are indeed uniformly and monotonously wet throughout the year (e.g., the northwest Pacific coast of South and Central America, from Ecuador to Costa Rica; see, for instance, Andagoya, Colombia), but in many cases, the period of higher sun and longer days is distinctly wettest (as at Palembang, Indonesia) or the time of lower sun and shorter days may have more rain (as at Sitiawan, Malaysia).
- A few places with this climate are found at the outer edge of the tropics, almost exclusively in the Southern Hemisphere; one example is Santos, Brazil.
Note. The term aseasonal refers to the lack in the tropical zone of large differences in daylight hours and mean monthly (or daily) temperature throughout the year. Annual cyclic changes occur in the tropics, but not as predictable as those in the temperate zone, albeit unrelated to temperature, but to water availability whether as rain, mist, soil, or ground water. Plant response (e. g., phenology), animal (feeding, migration, reproduction, etc.), and human activities (plant sowing, harvesting, hunting, fishing, etc.) are tuned to this 'seasonality'. Indeed, in tropical South America and Central America, the 'rainy season' (and the 'high water season') is called invierno or inverno, though it could occur in the Northern Hemisphere summer; likewise, the 'dry season' (and 'low water season') is called verano or verão, and can occur in the Northern Hemisphere winter.
- Examples:
- Tropical monsoon climate (Am):[1]:208 This type of climate, most common in South America, results from the monsoon winds which change direction according to the seasons. This climate has a driest month (which nearly always occurs at or soon after the "winter" solstice for that side of the equator) with rainfall less than 60 mm, but more than 1/25 the total annual precipitation.
- Examples:
- Cairns, Queensland, Australia[2]
- Miami, Florida, United States[3]
- Also, another scenario exists under which some places fit into this category; this is referred to as the 'trade-wind littoral' climate because easterly winds bring enough precipitation during the "winter" months to prevent the climate from becoming a tropical wet-and-dry climate. Nassau, Bahamas, is included among these locations.
- Examples:
- Tropical wet and dry or savanna climate (Aw):[1]:208–11 These climates have a pronounced dry season, with the driest month having precipitation less than 60 mm and less than 1/25 of the total annual precipitation.
- Examples:
- Most places that have this climate are found at the outer margins of the tropical zone, but occasionally an inner-tropical location (e.g., San Marcos, Antioquia, Colombia) also qualifies. Actually, the Caribbean coast, eastward from the Gulf of Urabá on the Colombia–Panamá border to the Orinoco River delta, on the Atlantic Ocean (about 4,000 km), have long dry periods (the extreme is the BSh climate (see below), characterised by very low, unreliable precipitation, present, for instance, in extensive areas in the Guajira, and Coro, western Venezuela, the northernmost peninsulas in South America, which receive <300 mm total annual precipitation, practically all in two or three months). This condition extends to the Lesser Antilles and Greater Antilles forming the circum-Caribbean dry belt. The length and severity of the dry season diminishes inland (southward); at the latitude of the Amazon River — which flows eastward, just south of the equatorial line — the climate is Af. East from the Andes, between the dry, arid Caribbean and the ever-wet Amazon are the Orinoco River's llanos or savannas, from where this climate takes its name.
- Sometimes As is used in place of Aw if the dry season occurs during the time of higher sun and longer days. This is the case in parts of Hawaii, northwestern Dominican Republic (Monte Cristi, Villa Vásquez, Luperón), East Africa (Mombasa, Kenya), and Sri Lanka (Trincomalee), for instance. In most places that have tropical wet and dry climates, however, the dry season occurs during the time of lower sun and shorter days because of rainshadow effects during the 'high-sun' part of the year.
GROUP B: Dry (arid and semiarid) climates
These climates are characterized by actual precipitation less than a threshold value set equal to the potential evapotranspiration.[1]:212 The threshold value (in millimeters) is determined as:
- Multiply the average annual temperature in °C by 20, then add (a) 280 if 70% or more of the total precipitation is in the high-sun half of the year (April through September in the Northern Hemisphere, or October through March in the Southern), or (b) 140 if 30%–70% of the total precipitation is received during the applicable period, or (c) 0 if less than 30% of the total precipitation is so received.
- If the annual precipitation is less than 50% of this threshold, the classification is BW (desert climate); if it is in the range of 50%–100% of the threshold, the classification is BS (steppe climate).
- A third letter can be included to indicate temperature. Originally, h signified low-latitude climate (average annual temperature above 18 °C) while k signified middle-latitude climate (average annual temperature below 18 °C), but the more common practice today (especially in the United States) is to use h to mean the coldest month has an average temperature above 0 °C (32 °F), with k denoting that at least one month averages below 0 °C.
- Desert areas situated along the west coasts of continents at tropical or near-tropical locations are characterized by cooler temperatures than encountered elsewhere at comparable latitudes (due to the nearby presence of cold ocean currents) and frequent fog and low clouds, despite the fact that these places rank among the driest on earth in terms of actual precipitation received. This climate is sometimes labelled BWn.
The BSn category can be found in foggy coastal steppes.
- Examples:
- Kabul, Afghanistan (BSk)
- Turpan, China (BWk)
- Lima, Peru (BWn)
- Walvis Bay, Namibia (BWn)
- Phoenix, Arizona, United States (BWh)
- Denver, Colorado, United States (BSk)
- Tabriz, Iran (BSk)
- Isfahan, Iran (BSk)
- Lethbridge, Alberta, Canada (BSk)
- On occasion, a fourth letter is added to indicate if either the winter or summer is "wetter" than the other half of the year. To qualify, the wettest month must have at least 60 mm (2.4 in) of average precipitation if all 12 months are above 18 °C (64 °F), or 30 mm (1.2 in) if not; plus at least 70% of the total precipitation must be in the same half of the year as the wettest month — but the letter used indicates when the 'dry' season occurs, not the 'wet' one. This would result in Khartoum, Sudan, being reckoned as BWhw; Niamey, Niger, as BShw; Alexandria, Egypt, as BWhs; Asbi'ah, Libya, as BShs; Ömnögovi Province, Mongolia, as BWkw; and Xining, Qinghai, China, as BSkw (BWks and BSks do not exist if 0 °C in the coldest month is recognized as the h/k boundary). If the standards for neither w nor s are met, no fourth letter is added.
GROUP C: Temperate/mesothermal climates
These climates have an average monthly temperature above 10 °C (50 °F) in their warmest months (April to September in northern hemisphere), and an average monthly temperature above −3 C (27 F) in their coldest months. (Some climatologists prefer to observe 0 °C rather than −3 °C (27 °F) in the coldest month as the boundary between this group and the colder group D (humid continental).
In Asia, this includes areas from South Korea, to east- China from Beijing southward, to northern Japan . In Europe this includes areas from coastal Norway south to southern France, In the USA, areas from near 40 latitude in the central and eastern states (the NYC/NJ/CT area southward, the lower Ohio Valley, lower Midwest and southern Plains, are located in the Köppen C group.
- The second letter indicates the precipitation pattern — w indicates dry winters (driest winter month average precipitation less than one-tenth wettest summer month average precipitation; one variation also requires that the driest winter month have less than 30 mm average precipitation), s indicates dry summers (driest summer month less than 40 mm average precipitation and less than one-third wettest winter month precipitation) and f means significant precipitation in all seasons (neither above-mentioned set of conditions fulfilled).[6]
- The third letter indicates the degree of summer heat — a indicates warmest month average temperature above 22 °C (72 °F) with at least four months averaging above 10 °C, b indicates warmest month averaging below 22 °C, but with at least four months averaging above 10 °C, while c means three or fewer months with mean temperatures above 10 °C.
- The order of these two letters is sometimes reversed, especially by climatologists in the United States.
C climates (or mesothermal) are broken down into two types: 1) A dry-summer or Mediterranean climate and a temperate climate:
- Dry-summer or Mediterranean climates (Csa/Csb):[1]:221–3 These climates usually occur on the western sides of continents between the latitudes of 30° and 50°.[7] These climates are in the polar front region in winter, and thus have moderate temperatures and changeable, rainy weather. Summers are hot and dry, due to the domination of the subtropical high pressure systems, except in the immediate coastal areas, where summers are milder due to the nearby presence of cold ocean currents that may bring fog but prevent rain.
- Examples:
- Beirut, Lebanon (Csa)
- Los Angeles, United States (Csa)
- Khorramabad, Iran (Csa)
- Rome, Italy (Csa)
- Seville, Spain (Csa)
- Santiago, Chile (Csb)
- Essaouira, Morocco (Csb)
- Porto, Portugal (Csb)
- San Francisco, United States (Csb)
- Cape Town, South Africa (Csb)
- Seattle, United States (Csb)
- Under the Köppen–Geiger classification, dry-summer (Csb) extends to additional areas not typically associated with a typical Mediterranean climate, such as much of the Pacific Northwest, much of southern Chile, parts of west-central Argentina, parts of the Atlantic coastline of Morocco, and areas of northern Spain and Portugal.[6] Many of these areas would be oceanic (Cfb), except dry-summer patterns meet Köppen's Cs minimum thresholds. Additional highland areas in the subtropics also meet Cs requirements, although they, too, are not normally associated with Mediterranean climates.
- Examples:
- Warm Temperate climates (Cfa, Cwa):[1]:223–6 These climates usually occur on the eastern coasts and eastern sides of continents, from 30 to 50 latitude. Unlike the dry summer Mediterranean climates, warm temperate climates have a warm and wet flow from the tropics that creates warm and moist conditions in the summer months. As such, summer (not winter as is the case in Mediterranean climates) is often the wettest season. The flow out of the subtropical highs and the summer monsoon creates a southern flow from the tropics that brings warm and moist air to the lower east sides of continents. This flow is often what brings the frequent but short-lived summer thundershowers so typical of subtropical east-coast climates. East Asia has the world's best developed subtropical monsoons, and the classic dry winter/wet summer is characteristic of the region. In other eastern subtropical areas, like the Pampas and Southern Europe, mobile weather fronts/midlatitude storms tend to disrupt the normal dry winter/wet summer monsoon pattern.
- Examples:
- Bengbu, Anhui, China (Cwa)
- Hong Kong (Cwa)
- Hanoi, Vietnam (Cwa)
- Cordoba, Argentina (Cwa)
- Rasht, Gilan, Iran (Cfa)
- Jacksonville, Florida, United States (Cfa)
- Houston, Texas, United States (Cfa)
- Washington D.C., United States (Cfa)
- Atlanta, Georgia, United States (Cfa)
- Buenos Aires, Argentina (Cfa)
- Montevideo, Uruguay (Cfa)
- Porto Alegre, Brazil (Cfa)
- Examples:
- Maritime temperate climates or Oceanic climates (Cfb, Cfc, Cwb, Cwc):[1]:226–9 Cfb climates usually occur on the western sides of continents between the latitudes of 45° and 60°; they are typically situated immediately poleward of the Mediterranean climates, although in Australia and extreme southern Africa this climate is found immediately poleward of temperate climates, and at a somewhat lower latitude. In western Europe, this climate occurs in coastal areas up to 63°N in Norway. These climates are dominated all year round by the polar front, leading to changeable, often overcast weather. Summers are cool due to cool ocean currents, but winters are milder than other climates in similar latitudes, but usually very cloudy.
- Examples:
- Auckland, New Zealand (Cfb)
- Bordeaux, France (Cfb)
- Copenhagen, Denmark (Cfb)
- Skagen, Denmark (Cfb)[8]
- Haus, Norway (Cfc)[9]
- London, United Kingdom (Cfb)
- Paris, France (Cfb)
- Mar del Plata, Argentina (Cfb)
- Vancouver, British Columbia, Canada (Cfb)
- Cfb climates are also encountered at high elevations in certain subtropical and tropical areas, where the climate would be that of a subtropical/tropical rain forest if not for the altitude. These climates are called "highlands".
- Temperate highland tropical climate with dry winters (Cwb, Cwc) is a type of climate characteristic of the highlands inside the tropics of Mexico, Peru, Bolivia, Madagascar, Zambia, Zimbabwe and South Africa, but it is also found in central Argentina, outside the tropics. Winters are noticeable and dry, and summers can be very rainy. In the tropics, the rainy season is provoked by the tropical air masses and the dry winters by subtropical high pressure.
- Examples:
- Mexico City (Cwb)
- Bogotá, Colombia (Cwb)
- Juliaca, Peru (Cwb)[10]
- Copacabana, Bolivia (Cwc)
- Examples:
- Maritime subarctic climates or subpolar oceanic climates (Cfc):[1] These climates occur poleward of the maritime temperate climates, and are confined either to narrow coastal strips on the western poleward margins of the continents, or, especially in the Northern Hemisphere, to islands off such coasts.
- Examples:
- Dry-summer maritime subalpine climates (Csc):[1] This climate exists in high-elevation areas adjacent to coastal Csb climate areas, where the strong maritime influence prevent the average winter monthly temperature from dropping below −3 °C. This climate is extremely rare and is only found in isolated areas of the Cascades and Andes Mountains, as the dry-summer climate extends further poleward in the Americas than elsewhere.
- Examples:
- Balmaceda, Chile
- Bohemia Mountain, Oregon
- Examples:
GROUP D: Continental/microthermal climates

These climates have an average temperature above 10 °C (50 °F) in their warmest months, and a coldest month average below −3 °C (or 0 °C in some versions, as noted previously). These usually occur in the interiors of continents and on their upper east coasts, normally north of 40°N. In the Southern Hemisphere, group D climates are extremely rare due to the smaller land masses in the middle latitudes and the almost complete absence of land at 40–60°S, existing only in some highland locations.
- The second and third letters are used as for group C climates, while a third letter of d indicates three or fewer months with mean temperatures above 10 °C and a coldest month temperature below −3 °C.
Group D climates are subdivided as:
Lettering
- The second letter indicates the precipitation pattern — w indicates dry winters (driest winter month average precipitation less than one-tenth wettest summer month average precipitation; one variation also requires that the driest winter month have less than 30 mm average precipitation), s indicates dry summers (driest summer month less than 30 mm average precipitation and less than one-third wettest winter month precipitation) and f means significant precipitation in all seasons (neither above mentioned set of conditions fulfilled).
- The third letter indicates the degree of summer heat — a indicates warmest month average temperature above 22 °C (72 °F) with at least four months averaging above 10 °C, b indicates warmest month averaging below 22 °C, but with at least four months averaging above 10 °C, while c means three or fewer months with mean temperatures above 10 °C.
Scheme
- Hot summer continental climates (Dfa, Dwa, Dsa):[1]:231–2 Dfa climates usually occur in the high 40 and low 50 latitudes, with a qualifying average temperature in the warmest month of >22 °C/72 °F. In Europe, these climates tend to be much drier than in North America. In eastern Asia, Dwa climates extend further south due to the influence of the Siberian high pressure system, which also causes winters there to be dry, and summers can be very wet because of monsoon circulation. Dsa exists at higher elevations adjacent to areas with hot summer Mediterranean (Csa) climates.
- Examples:
- Chicago, Illinois, United States (Dfa)
- Cleveland, Ohio, United States (Dfa)
- Dayton, Ohio, United States (Dfa)
- Windsor, Ontario, Canada (Dfa)
- Pyongyang, North Korea (Dwa)
- Seoul, South Korea (Dwa)
- Beijing, China (Dwa)
- Dsa exists only at higher elevations adjacent to areas with hot summer Mediterranean (Csa) climates. Examples include:
- Sanandaj, Kordestan, Iran
- Arak, Markazi Province, Iran
- Muş, Turkey
- Saqqez, Iran
- Salt Lake City, Utah, United States
- Examples:
- Warm summer continental or hemiboreal climates (Dfb, Dwb, Dsb):[1] Dfb and Dwb climates are immediately north of hot summer continental climates, generally in the high 45° and low 58° in latitude in North America and Asia, and also in central and eastern Europe and Russia, between the maritime temperate and continental subarctic climates, where it extends up to high 50 and even low 65 degrees latitude.
- Examples:
- Dsb arises from the same scenario as Dsa, but at even higher altitudes or latitudes, and chiefly in North America, since the Mediterranean climates extend further poleward than in Eurasia. Examples include:
- Sivas, Turkey
- Chaghcharan, Afghanistan
- Skagway, Alaska- exceptionally rare example of a coastal Ds climate
- Continental subarctic or boreal (taiga) climates (Dfc, Dwc, Dsc):[1]:232–5 Dfc and Dwc climates occur poleward of the other group D climates, mostly in the 50° and low 60° north latitude, although it might occur as far north as 70°N.
- Murmansk, Russia (Dfc)
- Yellowknife, Northwest Territories (Dfc)
- Fairbanks, Alaska (Dfc)
- Homer, Alaska (Dsc)
- Mohe County, Heilongjiang (Dwc)
- Continental subarctic climates with extremely severe winters (Dfd, Dwd, Dsd):[1] Places with this climate have the temperature in their coldest month lower than −38 °C. These climates occur only in eastern Siberia. The names of some of the places with this climate — most notably Verkhoyansk (Dfd) and Oymyakon (Dwd)— have become veritable synonyms for extreme, severe winter cold.
GROUP E: Polar and alpine climates
These climates are characterized by average temperatures below 10 °C in all 12 months of the year:
- Tundra climate (ET):[1]:235–7 Warmest month has an average temperature between 0 and 10 °C. These climates occur on the northern edges of the North American and Eurasian land masses, and on nearby islands. It also occurs on some islands near the Antarctic Convergence (Stanley, Falkland Islands is an example).
- ET is also found at high elevations outside the polar regions, above the tree line:
- Mount Fuji, Japan
- Mount Washington, New Hampshire
- Jotunheimen, Norway
- Iqaluit, Nunavut, Canada
- El Alto, Bolivia, population 974,754 (largest city in E zone).
- ET is also found at high elevations outside the polar regions, above the tree line:
- Ice cap climate (EF):[1]:237 All twelve months have average temperatures below 0 °C (32 °F). This climate is dominant in Antarctica (e.g., Scott Base) and in inner Greenland (e.g., Eismitte or North Ice).
- Occasionally, a third, lower-case letter is added to ET climates if either the summer or winter is clearly drier than the other half of the year; thus Herschel Island ('Qikiqtaruk', in Inuvialuit) off the coast of Canada's Yukon Territory, becomes ETw, with Pic du Midi de Bigorre in the French Pyrenees acquiring an ETs designation. If the precipitation is more or less evenly spread throughout the year, ETf may be used, such as for Hebron, Labrador. When the option to include this letter is exercised, the same standards that are used for Groups C and D apply, with the additional requirement that the wettest month must have an average of at least 30 mm precipitation (Group E climates can be as dry or even drier than Group B climates based on actual precipitation received, but their rate of evaporation is much lower). Seasonal precipitation letters are almost never attached to EF climates, mainly due to the difficulty in distinguishing between falling and blowing snow, as snow is the sole source of moisture in these climates.
Ecological significance
The Köppen climate classification is based on the empirical relationship between climate and vegetation. This classification provides an efficient way to describe climatic conditions defined by temperature and precipitation and their seasonality with a single metric. Because climatic conditions identified by the Köppen classification are ecologically relevant, it has been widely used to map geographic distribution of long term climate and associated ecosystem conditions.[13]
Over the recent years, there has been an increasing interest in using the classification to identify changes in climate and potential changes in vegetation over time.[14] The most importance ecological significance of the Köppen climate classification is that it helps to predict the dominant vegetation type based on the climatic data and vice versa.[15]
World Map of the Köppen–Geiger climate classification for the period 1951–2000
Based on recent data sets from the Climatic Research Unit (CRU) of the University of East Anglia and the Global Precipitation Climatology Centre (GPCC) at the German Weather Service, a new digital Köppen–Geiger world map on climate classification for the second half of the 20th century has been compiled.[3]
Trewartha climate classification scheme
The Trewartha climate classification is a climate classification system published by American geographer Glenn Thomas Trewartha in 1966, and updated in 1980. It is a modified version of the 1899 Köppen system, created to answer some of the deficiencies of the Köppen system. The Trewartha system attempts to redefine the middle latitudes to be closer to vegetation zoning and genetic climate systems. It was considered a more true or "real world" reflection of the global climate.
For example, under the standard Köppen system, western Washington and Oregon are classed into the same climate zone as southern California, even though the two regions have strikingly different weather and vegetation. Under the old Köppen system cool oceanic climates like that of London were classed in the same zone as hot subtropical cities like Savannah, GA or Brisbane, Australia. In the USA, locations in the Midwest like Ohio and Iowa which have long, severe winter climates where plants are completely dormant, were classed into the same climate zone as Louisiana or northern Florida which have mild winters and a green winter landscape.
Other maps
All maps use the ≥0 °C definition for temperate climates and the 18 °C annual mean temperature threshold to distinguish between hot and cold dry climates.[6]
-
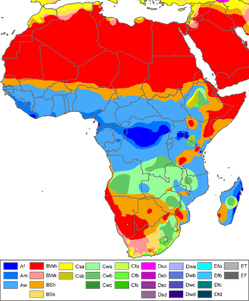
Köppen map of Africa
-
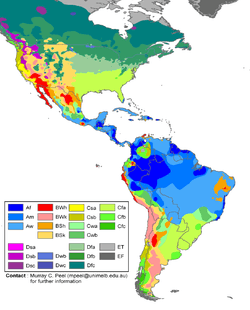
Köppen map of the Americas
-
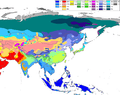
Köppen map of Asia
-

Köppen map of Australia/Oceania
-

Köppen map of Brazil
-
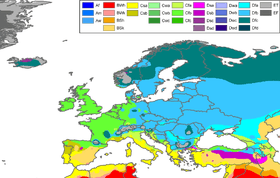
Köppen map of Europe
-
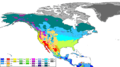
Köppen map of North America
-

Köppen map of South Asia
-

Köppen map of Russia
-
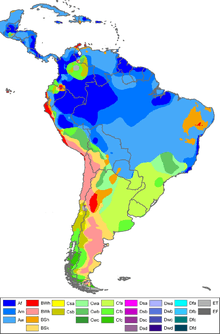
Köppen map of South America
-
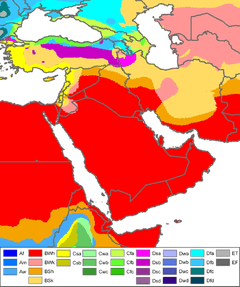
Köppen map of the Middle East
See also
- Holdridge life zones climate classification by three dimensions: precipitation, humidity, and potential evapotranspiration ratio
References
- ↑ 1.0 1.1 1.2 1.3 1.4 1.5 1.6 1.7 1.8 1.9 1.10 1.11 1.12 1.13 1.14 1.15 McKnight, Tom L; Hess, Darrel (2000). "Climate Zones and Types". Physical Geography: A Landscape Appreciation. Upper Saddle River, NJ: Prentice Hall. ISBN 0-13-020263-0.
- ↑ Linacre, Edward; Bart Geerts (1997). Climates and Weather Explained. London: Routledge. p. 379. ISBN 0-415-12519-7.
- ↑ 3.0 3.1 3.2 Kottek, M., J. Grieser, C. Beck, B. Rudolf, and F. Rubel (2006). "World Map of the Köppen–Geiger climate classification updated" (PDF). Meteorol. Z. 15 (3): 259–263. Bibcode:2006MetZe..15..259K. doi:10.1127/0941-2948/2006/0130. Retrieved 2013-06-01.
- ↑ "CHAPTER 7: Introduction to the Atmosphere". physicalgeography.net. Retrieved 2008-07-15.
- ↑ Engineering Weather Data CD-ROM Station List, National Climate Data Center. Retrieved 2013-06-01
- ↑ 6.0 6.1 6.2
- ↑ "Mediterranean Climate". California Rangelands. California Ragelands. Retrieved 2015-01-26.
- ↑ "Clima:Skagen". Climate.Date. Climate Date.org. Retrieved 2015-01-26.
- ↑ "Clima:Haus". Climate.Date. Climate Date.org. Retrieved 2015-01-26.
- ↑ "Climatological Information for Juliaca, Peru". Hong Kong Observatory.
- ↑
- ↑ "Iceland Met office: Monthly Averages for Reykjavík". Iceland Met Office. 2012. Retrieved on January 4, 2013.
- ↑ Chen, D. and H. W. Chen (2013). "Using the Köppen classification to quantify climate variation and change: An example for 1901–2010". Environmental Development 6: 69–79. doi:10.1016/j.envdev.2013.03.007. (direct: Final Revised Paper)
- ↑ http://hanschen.org/koppen/
- ↑ Critchfield, Howard J (1983). General Climatology (4th ed.). New Delhi: Prentice Hall. pp. 154–161. ISBN 978-81-203-0476-5.
External links
| Wikimedia Commons has media related to Köppen-Geiger. |
- World Map of the Köppen–Geiger climate classification for the period 1951–2000
- Global climate maps, using Köppen classification (FAO, 1999)
Climate records
| ||||||||||||||||||||||