Italian general election, 1987
Italian general election, 1987
|
|
|
|
|
|
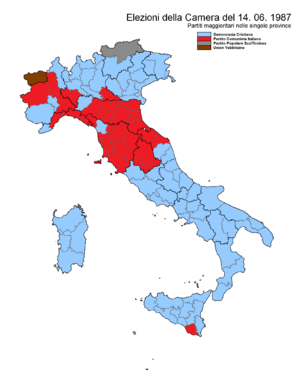
| Legislative election results map. Light Blue denotes provinces with a Christian Democratic plurality, Red denotes those with a Communist plurality, Gray and Brown denotes those with an Autonomist plurality. |
|
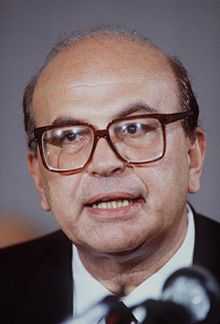
General elections were held in Italy on June 14, 1987.[1] This election marked the final inversion of the trend of the entire republican history of Italy: for the first time, the distance between the Christian Democrats and the Communists grew significantly instead of decreasing, and this fact was seen as the result of the deindustrialization of the country. The growth of the service sector of the economy, and the leadership of former PM Bettino Craxi, gave instead a new strength to the Socialists. A remarkable novelty was the rise of the new Green Lists, while a new party obtained its first two parliamentary seats: the North League.
Electoral system
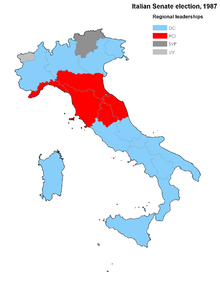
Regional pluralities in Senate
The pure party-list proportional representation had traditionally become the electoral system for the Chamber of Deputies. Italian provinces were united in 32 constituencies, each electing a group of candidates. At constituency level, seats were divided between open lists using the largest remainder method with Imperiali quota. Remaining votes and seats were transferred at national level, where they was divided using the Hare quota, and automatically distributed to best losers into the local lists.
For the Senate, 237 single-seat constituencies were established, even if the assembly had risen to 315 members. The candidates needed a landslide victory of two thirds of votes to be elected, a goal which could be reached only by the German minorities in South Tirol. All remained votes and seats were grouped in party lists and regional constituencies, where a D'Hondt method was used: inside the lists, candidates with the best percentages were elected.
Parties and leaders
| Party |
Ideology |
Leader |
|
Christian Democracy (DC) |
Christian democracy, popularism |
Ciriaco De Mita |
|
Italian Communist Party (PCI) |
Communism, Eurocommunism |
Alessandro Natta |
|
Italian Socialist Party (PSI) |
Democratic socialism, social democracy |
Bettino Craxi |
|
Italian Social Movement (MSI) |
Neo-fascism, Italian nationalism |
Giorgio Almirante |
|
Italian Republican Party (PRI) |
Social liberalism, centrism |
Giorgio La Malfa |
|
Italian Democratic Socialist Party (PSDI) |
Social democracy, centrism |
Franco Nicolazzi |
|
Radical Party (PR) |
Radicalism, Anti-clericalism |
Marco Pannella |
|
Green Lists (LV) |
Green politics, ecologism |
Alexander Langer |
|
Italian Liberal Party (PLI) |
Liberalism, conservatism |
Renato Altissimo |
|
Proletarian Democracy (DP) |
Communism, Trotskyism |
Mario Capanna |
Results
Chamber of Deputies
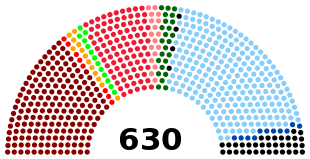
Composition of the Chamber of Deputies after the election.
| Party |
Votes |
% |
Seats |
+/– |
|---|
|
Christian Democracy | 13,233,620 | 34.31 | 234 | +9 |
|
Italian Communist Party | 10,250,644 | 26.58 | 177 | –21 |
|
Italian Socialist Party | 5,501,696 | 14.26 | 94 | +21 |
|
Italian Social Movement | 2,281,126 | 5.91 | 35 | –7 |
|
Italian Republican Party | 1,428,663 | 3.70 | 21 | –8 |
|
Italian Democratic Socialist Party | 1,140,209 | 2.96 | 17 | –6 |
|
Radical Party | 987,720 | 2.56 | 13 | +2 |
|
Green List | 969,218 | 2.51 | 13 | New |
|
Italian Liberal Party | 809,946 | 2.10 | 11 | –5 |
|
Proletarian Democracy | 641,901 | 1.66 | 8 | +1 |
|
Liga Veneta–United Pensioners | 298,402 | 0.77 | 1 | +1 |
|
South Tyrolean People's Party | 202,022 | 0.52 | 3 | – |
|
Lega Lombarda | 186,255 | 0.48 | 1 | New |
|
Sardinian Action Party | 169,978 | 0.44 | 2 | +1 |
|
Piedmont Regional Autonomy | 72,064 | 0.19 | 0 | New |
|
Piedmont | 61,701 | 0.16 | 0 | New |
|
Hunting, Fishing, Environment | 55,977 | 0.14 | 0 | New |
|
Aosta Valley | 41,707 | 0.11 | 1 | – |
|
Others | 238,2725 | 0.63 | 0 | – |
| Invalid/blank votes | 2,015,065 | – | – | – |
| Total | 40,586,573 | 100 | 630 | 0 |
| Registered voters/turnout | 45,692,417 | 88.83 | – | – |
| Source: Ministry of the Interior |
Senate of the Republic
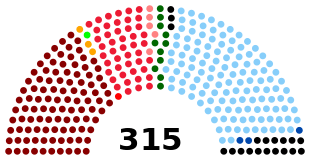
Composition of the Senate after the election.
| Party |
Votes |
% |
Seats |
+/– |
|---|
|
Christian Democracy | 10,897,036 | 33.62 | 125 | +5 |
|
Italian Communist Party | 9,181,579 | 28.33 | 101 | –6 |
|
Italian Socialist Party | 3,535,457 | 10.91 | 36 | –2 |
|
Italian Social Movement | 2,121,026 | 6.54 | 16 | –2 |
|
Italian Republican Party | 1,248,641 | 3.85 | 8 | –2 |
|
PSI–PSDI–PR | 962,215 | 2.97 | 9 | – |
|
Italian Democratic Socialist Party | 764,370 | 2.36 | 5 | –3 |
|
Italian Liberal Party | 700,330 | 2.16 | 3 | –3 |
|
Green List | 634,182 | 1.96 | 1 | New |
|
Radical Party | 572,461 | 1.77 | 3 | +2 |
|
Proletarian Democracy | 493,667 | 1.52 | 1 | +1 |
|
Liga Veneta–United Pensioners | 298,552 | 0.92 | 0 | –1 |
|
South Tyrolean People's Party | 171,539 | 0.53 | 2 | –1 |
|
Lega Lombarda | 137,276 | 0.42 | 1 | New |
|
Sardinian Action Party | 124,266 | 0.38 | 1 | – |
|
Secular-Socialist Alliance | 84,883 | 0.26 | 1 | New |
|
Piedmont Regional Autonomy | 60,742 | 0.19 | 0 | New |
|
PSI–PSDI–PR–Greens | 58,501 | 0.18 | 1 | – |
|
Pensioners Popular Alliance | 51,790 | 0.16 | 0 | New |
|
Piedmont | 51,340 | 0.16 | 0 | New |
|
Molisean Democratic Alliance | 49,297 | 0.15 | 0 | New |
|
Hunting, Fishing, Environment | 41,135 | 0.13 | 0 | New |
|
Aosta Valley | 35,830 | 0.11 | 1 | – |
|
Others | 137,746 | 0.43 | 0 | – |
| Invalid/blank votes | 2,007,369 | – | – | – |
| Total | 34,421,230 | 100 | 315 | 0 |
| Registered voters/turnout | 38,951,485 | 88.37 | – | – |
| Source: Ministry of the Interior |
References
- ↑ Nohlen, D & Stöver, P (2010) Elections in Europe: A data handbook, p1048 ISBN 978-3-8329-5609-7