Ishikawa diagram
| Ishikawa diagram | |
|---|---|
 | |
| One of the Seven Basic Tools of Quality | |
| First described by | Kaoru Ishikawa |
| Purpose | To break down (in successive layers of detail) root causes that potentially contribute to a particular effect |
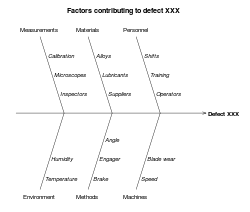
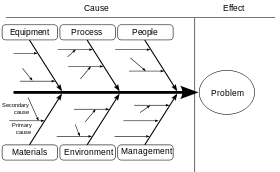
Ishikawa diagrams (also called fishbone diagrams, herringbone diagrams, cause-and-effect diagrams, or Fishikawa) are causal diagrams created by Kaoru Ishikawa (1968) that show the causes of a specific event.[1][2] Common uses of the Ishikawa diagram are product design and quality defect prevention, to identify potential factors causing an overall effect. Each cause or reason for imperfection is a source of variation. Causes are usually grouped into major categories to identify these sources of variation. The categories typically include
- People: Anyone involved with the process
- Methods: How the process is performed and the specific requirements for doing it, such as policies, procedures, rules, regulations and laws
- Machines: Any equipment, computers, tools, etc. required to accomplish the job
- Materials: Raw materials, parts, pens, paper, etc. used to produce the final product
- Measurements: Data generated from the process that are used to evaluate its quality
- Environment: The conditions, such as location, time, temperature, and culture in which the process operates
Overview
Ishikawa diagrams were popularized by Kaoru Ishikawa[3] in the 1960s, who pioneered quality management processes in the Kawasaki shipyards, and in the process became one of the founding fathers of modern management.
The basic concept was first used in the 1920s, and is considered one of the seven basic tools of quality control.[4] It is known as a fishbone diagram because of its shape, similar to the side view of a fish skeleton.
Mazda Motors famously used an Ishikawa diagram in the development of the Miata sports car, where the required result was "Jinba Ittai" (Horse and Rider as One — jap. 人馬一体). The main causes included such aspects as "touch" and "braking" with the lesser causes including highly granular factors such as "50/50 weight distribution" and "able to rest elbow on top of driver's door". Every factor identified in the diagram was included in the final design.
Causes
Causes in the often categorized, such as to the 5 M's, described below. Cause-and-effect diagrams can reveal key relationships among various variables, and the possible causes provide additional insight into process behavior.
Causes can be derived from brainstorming sessions. These groups can then be labeled as categories of the fishbone. They will typically be one of the traditional categories mentioned above but may be something unique to the application in a specific case. Causes can be traced back to root causes with the 5 Whys technique.
Typical categories are
The 5 Ms (used in manufacturing industry)
- Machine (technology)
- Method (process)
- Material (Includes Raw Material, Consumables and Information.)
- Man Power (physical work)/Mind Power (brain work): Kaizens, Suggestions
- Measurement (Inspection)
The original 5 Ms used by the Toyota Production System have been expanded by some to include the following and are referred to as the 8 Ms. However, this is not globally recognized. It has been suggested to return to the roots of the tools and to keep the teaching simple while recognizing the original intent; most programs do not address the 8Ms.
- Milieu/Mother Nature(Environment)
- Management/Money Power
- Maintenance
The 7 Ps (used in marketing industry)
- Product/Service
- Price
- Place
- Promotion
- People/personnel
- Process
- Physical Evidence
The 7 Ps are primarily used in service marketing.
The 5 Ss (used in service industry)
- Surroundings
- Suppliers
- Systems
- Skills
- Safety
See also
- Seven Basic Tools of Quality
- Five whys
References
- ↑ Ishikawa, Kaoru (1968). Guide to Quality Control. Tokyo: JUSE.
- ↑ Ishikawa, Kaoru (1976). Guide to Quality Control. Asian Productivity Organization. ISBN 92-833-1036-5.
- ↑ Hankins, Judy (2001). Infusion Therapy in Clinical Practice. p. 42.
- ↑ Tague, Nancy R. (2004). "Seven Basic Quality Tools". The Quality Toolbox. Milwaukee, Wisconsin: American Society for Quality. p. 15. Retrieved 2010-02-05.
Further reading
- Ishikawa, Kaoru (1990); (Translator: J. H. Loftus); Introduction to Quality Control; 448 p; ISBN 4-906224-61-X OCLC 61341428
- Dale, Barrie G. et al. (2007); Managing Quality 5th ed; ISBN 978-1-4051-4279-3 OCLC 288977828
External links
| Wikimedia Commons has media related to Ishikawa diagrams. |