Instrumental temperature record

The instrumental temperature record shows fluctuations of the temperature of earth's climate system. Initially the instrumental temperature record only documented land and sea surface temperature, but in recent decades instruments have also begun recording sub-surface ocean temperature. This data is collected from several thousand meteorological stations, Antarctic research stations, satellite observations of sea-surface temperature, and subsurface ocean sensors. The longest-running temperature record is the Central England temperature data series, that starts in 1659. The longest-running quasi-global record starts in 1850.[1]
Global records databases
The Hadley Centre maintains the HadCRUT4, a monthly-mean global surface temperature analysis,[2] and NASA maintains GISTEMP, another monthly-mean global surface temperature analysis, for the period since 1880.[3] The two analyses differ in the details of how they obtain temperature values on a regular grid from the network of irregularly spaced observation sites; thus, their results for global and regional temperature differ slightly. The United States National Oceanic and Atmospheric Administration (NOAA) maintains the Global Historical Climatology Network (GHCN-Monthly) data base contains historical temperature, precipitation, and pressure data for thousands of land stations worldwide.[4] Also, NOAA's National Climatic Data Center (NCDC), which has "the world's largest active archive"[5] of surface temperature measurements, maintains a global temperature record since 1880.[6]
Calculating the global temperature


Deriving a reliable global temperature from the instrument data is not easy because the instruments are not evenly distributed across the planet, the hardware and observing locations have changed over the years, and there has been extensive land use change (such as urbanization) around some of the sites.
The calculation needs to filter out the changes that have occurred over time that are not climate related (e.g. urban heat islands), then interpolate across regions where instrument data has historically been sparse (e.g. in the southern hemisphere and at sea), before an average can be taken.
There are three main datasets showing analyses of global temperatures, all developed since the late 1970s: the HadCRUT analysis is compiled in a collaboration between the University of East Anglia's Climatic Research Unit and the Hadley Centre for Climate Prediction and Research,, independent analyses largely based on the same raw data are produced using different levels of interpolation by the Goddard Institute for Space Studies and by the National Climatic Data Center.[7] These datasets are updated on a monthly basis and are generally in close agreement.
In the late 1990s, the Goddard team used the same data to produce a global map of temperature anomalies to illustrate the difference between the current temperature and average temperatures prior to 1950 across every part of the globe.[8]
Absolute temperatures v. anomalies
Records of global average surface temperature are usually presented as anomalies rather than as absolute temperatures. A temperature anomaly is measured against a reference value or long-term average.[9] For example, if the reference value is 15 °C, and the measured temperature is 17 °C, then the temperature anomaly is +2 °C (i.e., 17 °C -15 °C).
Temperature anomalies are useful for deriving average surface temperatures because they tend to be highly correlated over large distances (of the order of 1000 km).[10] In other words, anomalies are representative of temperatures over large areas and distances. By comparison, absolute temperatures vary markedly over even short distances.
Absolute temperatures for the Earth's average surface temperature have been derived, with a best estimate of roughly 14 °C (57.2 °F).[11] However, the correct temperature could easily be anywhere between 13.3 and 14.4 °C (56 and 58 °F) and uncertainty increases at smaller (non-global) scales.
Temperature processing software
In September 2007, the GISTEMP software which is used to process the GISS version of the historical instrument data was made public. The software that was released has been developed over more than 20 years by numerous staff and is mostly in FORTRAN; large parts of it were developed in the 1980s before massive amounts of computer memory was available as well as modern programming languages and techniques.
Two recent open source projects have been developed by individuals to re-write the processing software in modern open code. One, http://www.opentemp.org/, was by John van Vliet. More recently, a project which began in April 2008 (Clear Climate Code) by staff of Ravenbrook Ltd to update the code to Python has so far detected two minor bugs in the original software which did not significantly change any results.[12]
Global record from 1850
The period for which reasonably reliable instrumental records of near-surface temperature exist with quasi-global coverage is generally considered to begin around 1850. Earlier records exist, but with sparser coverage and less standardized instrumentation.
The temperature data for the record come from measurements from land stations and ships. On land, temperature sensors are kept in a Stevenson screen or a maximum minimum temperature system (MMTS). The sea record consists of surface ships taking sea temperature measurements from engine inlets or buckets. The land and marine records can be compared.[13] Land and sea measurement and instrument calibration is the responsibility of national meteorological services. Standardization of methods is organized through the World Meteorological Organization and its predecessor, the International Meteorological Organization.[14]
Most meteorological observations are taken for use in weather forecasts. Centers such as ECMWF show instantaneous map of their coverage; or the Hadley Centre show the coverage for the average of the year 2000. Coverage for earlier in the 20th and 19th centuries would be significantly less. While temperature changes vary both in size and direction from one location to another, the numbers from different locations are combined to produce an estimate of a global average change.
Warming in the instrumental temperature record

Most of the observed warming occurred during two periods: 1910 to 1945 and 1976 to 2000; the cooling/plateau from 1945 to 1976 has been mostly attributed to sulphate aerosol.[15][16] Some of the temperature variations over this time period may also be due to ocean circulation patterns.[17]
Attribution of the temperature change to natural or anthropogenic (i.e., human-induced) factors is an important question: see global warming and attribution of recent climate change.
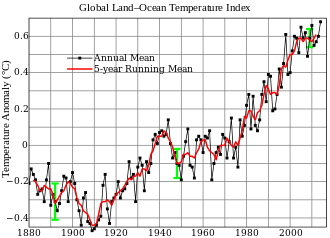
Land and sea measurements independently show much the same warming since 1860.[18] The data from these stations show an average surface temperature increase of about 0.74 °C during the last 100 years. The Intergovernmental Panel on Climate Change (IPCC) stated in its Fourth Assessment Report (AR4) that the temperature rise over the 100-year period from 1906–2005 was 0.74 °C [0.56 to 0.92 °C] with a 90% confidence interval.[19]
For the last 50 years, the linear warming trend has been 0.13 °C [0.10 to 0.16 °C] per decade according to AR4.[19]
The IPCC Fourth Assessment Report found that the instrumental temperature record for the past century included urban heat island effects but that these were primarily local, having a negligible influence on global temperature trends (less than 0.006 °C per decade over land and zero over the oceans).[19]
Uncertainties in the temperature record, e.g., the urban heat island effect, are discussed further in a later section.
Robustness of evidence
.png)
There is a scientific consensus that climate change is occurring and that greenhouse gases emitted by human activities are the primary driver.[21] The scientific consensus is reflected in, for example, reports by the Intergovernmental Panel on Climate Change (IPCC) and U.S. Global Change Research Program.[21]
Although the IPCC AR4 concluded that “warming of the climate system is unequivocal,” public debate over the evidence for global warming continues.[22] However, it is often confined to a small set of reiterated disputes about Land Surface Air Temperature (LSAT) records, diverting attention from the broader evidence basis.[22]
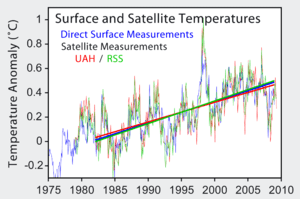
The methods used to derive the principal estimates of global surface temperature trends — HadCRUT3, NOAA and NASA/GISS — are largely independent.[22] So, the spread of the three estimates indicates the likely degree of uncertainty in the evolution of the global mean surface temperature.[22] Independently derived estimates of tropospheric temperature trends for the whole troposphere channel from satellites differ by an order of magnitude more than do estimated surface temperature trends.[22]
Numerous studies attest to the robustness of the global LSAT records and their non-reliance on individual stations.[22] Evidence from recent re-analyses lends further support.[22]
The IPCC conclusion that “warming of the climate system is unequivocal” does not rest solely upon LSAT records.[22] These constitute only one line of evidence among many, for example: uptake of heat by the oceans, melting of land ice such as glaciers, the associated rise in sea level and increased atmospheric surface humidity (see the figure opposite and effects of global warming).[22] If the land surface records were systematically flawed and the globe had not really warmed, then it would be almost impossible to explain the concurrent changes in this wide range of indicators produced by many independent groups.[22] The observed changes in a broad range of indicators provide a self-consistent story of a warming world.[22]
Other reports and assessments
.png)
The U.S. National Academy of Sciences, both in its 2002 report to President George W. Bush, and in later publications, has strongly endorsed evidence of an average global temperature increase in the 20th century.[24]
The preliminary results of an assessment carried out by the Berkeley Earth Surface Temperature group and made public in October 2011, found that over the past 50 years the land surface warmed by 0.911 °C, and their results mirrors those obtained from earlier studies carried out by the NOAA, the Hadley Centre and NASA's GISS. The study addressed concerns raised by "skeptics"[25][26] including urban heat island effect, "poor"[25] station quality, and the "issue of data selection bias"[25] and found that these effects did not bias the results obtained from these earlier studies.[25][27][28][29]
Internal climate variability and global warming
One of the issues that has been raised in the media is the view that global warming "stopped in 1998".[30][31] This view ignores the presence of internal climate variability.[31][32] Internal climate variability is a result of complex interactions between components of the climate system, such as the coupling between the atmosphere and ocean.[33] An example of internal climate variability is the El Niño Southern Oscillation (ENSO).[31][32] The El Niño in 1998 was particularly strong, possibly one of the strongest of the 20th century.[31]
Cooling between 2006 and 2008, for instance, has likely been driven by La Niña, the opposite of El Niño conditions.[34] The area of cooler-than-average sea surface temperatures that defines La Niña conditions can push global temperatures downward, if the phenomenon is strong enough.[34] Even accounting for the presence of internal climate variability, recent years rank among the warmest on record.[35] For example, every year of the 2000s was warmer than the 1990 average.[36]
Spatial variability


The global temperature changes are not uniform over the globe, nor would they be expected to be, whether the changes were naturally or humanly forced.
Temperature trends from 1901 are positive over most of the world's surface except for Atlantic Ocean south of Greenland, the southeastern United States, and parts of Bolivia. Warming is strongest over interior land area in Asia and North America as well as south-eastern Brazil and some area in the South Atlantic and Indian oceans.
Since 1979 temperatures increase is considerably stronger over land while cooling has been observed over some oceanic regions in the Pacific Ocean and Southern Hemisphere, the spatial pattern of ocean temperature trend in those regions is possibly related to the Pacific Decadal Oscillation and Southern Annular Mode.[37]
Seasonal temperature trends are positive over most of the globe but weak cooling is observed over the mid latitudes of the southern ocean but also over eastern Canada in spring due to strengthening of the North Atlantic Oscillation, warming is stronger over northern Europe, China and North America in winter, Europe and Asia interior in spring, Europe and north Africa in summer and northern North America, Greenland and Eastern Asia in autumn. Enhanced warming over north Eurasia is partly linked to the Northern Annular Mode,[38][39] while in the southern hemisphere the trend toward stronger westerlies over the southern ocean favoured a cooling over much of Antarctica with the exception of the Antarctic Peninsula where strong westerlies decrease cold air outbreak from the south.[40] The Antarctic Peninsula has warmed by 2.5 °C (4.5 °F) in the past five decades at Bellingshausen Station.[41]
Uncertainties in the temperature record
Systematic local biases in surface temperature trends may exist due to changes in station exposure and instrumentation over land, or changes in measurement techniques by ships and buoys in the ocean.[42][43] It is likely that these biases are largely random and therefore cancel out over large regions such as the globe or tropics.[42]
Some have expressed concern that land temperature data might be biased due to urbanization effects (see urban heat island effect for more information).[42] Studies specifically designed to identify systematic problems using a range of approaches have found no detectable urban influence in large-area averages in the data sets that have been adjusted to remove non-climatic influences (i.e., "homogenized").[42][44]
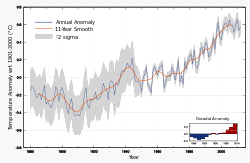
The uncertainty in annual measurements of the global average temperature (95% range) is estimated to be ≈0.05 °C since 1950 and as much as ≈0.15 °C in the earliest portions of the instrumental record. The error in recent years is dominated by the incomplete coverage of existing temperature records. Early records also have a substantial uncertainty driven by systematic concerns over the accuracy of sea surface temperature measurements.[45][46] A temperature drop of about 0.3 °C in 1945 could be the result of uncorrected instrumental biases in the sea surface temperature record.[43]
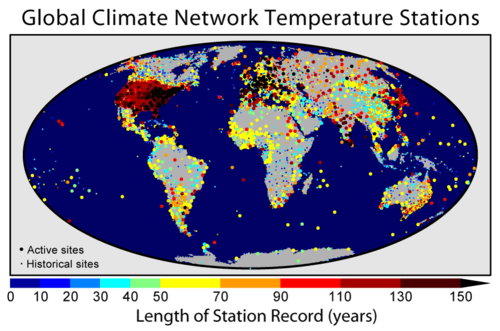
Station densities are highest in the northern hemisphere, providing more confidence in climate trends in this region. Station densities are far lower in other regions such as the tropics, northern Asia and the former Soviet Union. This results in less confidence in the robustness of climate trends in these areas. If a region with few stations includes a poor quality station, the impact on global temperature would be greater than in a grid with many weather stations.[47]
As stated, uncertainties in the instrumental record do not undermine the robust finding[48] of an observed long-term increase in global mean temperature, which is supported by a wide range of evidence.[20]
A number of scientists and scientific organizations have expressed concern about the possible deterioration of the land surface observing network.[49][50][51][52] Climate scientist Roger A. Pielke has stated that he has identified a number of sites where poorly sited stations in sparse regions "will introduce spatially unrepresentative data into the analyses."[53] University of Alabama-Huntsville professor of atmospheric science and former IPCC lead author John Christy has stated that "[t]he temperature records cannot be relied on as indicators of global change."[54] The metadata needed to quantify the uncertainty from poorly sited stations does not currently exist. Pielke has called for a similar documentation effort for the rest of the world.[55]
Evaluation of the United States land surface temperature record
In 1999 a panel of the U.S. National Research Council studied the state of US climate observing systems.[56] The panel evaluated many climate measurement aspects, 4 of which had to do with temperature, against ten climate monitoring principles proposed by Karl et al. 1995. Land surface temperature had "known serious deficiencies" in 5 principles, vertical distribution and sea surface in 9 and subsurface ocean in 7.
The U.S. National Weather Service Cooperative Observer Program has established minimum standards regarding the instrumentation, siting, and reporting of surface temperature stations.[57] The observing systems available are able to detect year-to-year temperature variations such as those caused by El Niño or volcanic eruptions.[58] These stations can undergo undocumented changes such as relocation, changes in instrumentation and exposure (including changes in nearby thermally emitting structures), changes in land use (e.g., urbanization), and changes in observation practices. All of these changes can introduce biases into the stations' long term records. In the past, these local biases were generally considered to be random and therefore would cancel each other out using many stations and the ocean record.[58]
A 2006 paper analyzed a subset of U.S. surface stations, 366 stations, and found that 95% displayed a warming trend after land use/land cover (LULC) changes. The authors stated "this does not necessarily imply that the LULC changes are the causative factor."[59] Another study [60] has documented examples of well and poorly sited monitoring stations in the United States, including ones near buildings, roadways, and air conditioning exhausts. Brooks investigated Historical Climate Network (USHCN) sites in Indiana, and assigned 16% of the sites an ‘excellent’ rating, 59% a ‘good’ rating, 12.5% a ‘fair’ rating, and 12.5% ‘poor’ rating.[61] Davey and Pielke visited 10 HCN sites in Eastern Colorado, but did not provide percentages of good or badly sited stations. They stated that some of the sites "are not at all representative of their surrounding region" and should be replaced in the instrumental temperature records with other sites from the U.S. cooperative observer network.[62]
Peterson has argued that existing empirical techniques for validating the local and regional consistency of temperature data are adequate to identify and remove biases from station records, and that such corrections allow information about long-term trends to be preserved.[63] Pielke and co-authors disagree.[64]
Warmest years

The list of hottest years on record is dominated by years from this millennium; every year of the 21st century is one of the 15 warmest on record (14 out of 15). This is the first time since 1990 that the high temperature record was broken in the absence of any El Niño conditions in the year, as indicated by NOAA's CPC Oceanic Niño Index. El Niño generally tends to increase global temperatures around the globe yet conditions remained neutral in during the entire year and the globe reached record warmth despite this. The previous recordholder (2010) occurred during an El Niño year. La Niña, on the other hand, usually causes years which are cooler than the short-term average. (though while the last La Niña year (2012) was relatively cool by recent standards it was still the 10th warmest year since records began). Slightly less recently, 2006 and 2009 are approximately tied for the warmest "La Niña year" between 1971 and 2014.[65]
Although the NCDC temperature record begins in 1880, less certain reconstructions of earlier temperatures suggest these years may be the warmest for several centuries to millennia.
| Year | Global[66] | Land[66] | Ocean[66] |
|---|---|---|---|
| 2014 | 0.69 | 1.00 | 0.57 |
| 2010 | 0.66 | 1.06 | 0.50 |
| 2005 | 0.65 | 1.05 | 0.50 |
| 1998 | 0.64 | 0.94 | 0.52 |
| 2013 | 0.62 | 0.99 | 0.48 |
| 2003 | 0.62 | 0.88 | 0.52 |
| 2002 | 0.61 | 0.93 | 0.49 |
| 2006 | 0.60 | 0.90 | 0.48 |
| 2009 | 0.59 | 0.85 | 0.50 |
| 2007 | 0.59 | 1.09 | 0.41 |
The last 38 years in a row were above the 20th century average.[65]
The values in the table above are anomalies from the 1901–2000 global mean of 13.9 °C.[67] For instance, the +0.59 °C anomaly in 2007 added to the 1901–2000 mean of 13.9 °C gives a global average temperature of 14.49 °C for 2007.[68]
The coolest year in the record was 1911. The warmest year was 2014.[66]
Warmest decades
.png)
Numerous cycles have been found to influence annual global mean temperatures. The tropical El Niño-La Niña cycle and the Pacific Decadal Oscillation are the most well-known of these cycles.[69] An examination of the average global temperature changes by decades reveals continuing climate change.[70] Following chart is from NASA data of combined land-surface air and sea-surface water temperature anomalies.
| Years | Temp. anomaly (°C anomaly (°F anomaly) from 1951–1980 mean) |
|---|---|
| 1880–1889 | −0.274 °C (−0.493 °F) |
| 1890–1899 | −0.254 °C (−0.457 °F) |
| 1900–1909 | −0.259 °C (−0.466 °F) |
| 1910–1919 | −0.276 °C (−0.497 °F) |
| 1920–1929 | −0.175 °C (−0.315 °F) |
| 1930–1939 | −0.043 °C (−0.0774 °F) |
| 1940–1949 | 0.035 °C (0.0630 °F) |
| 1950–1959 | −0.02 °C (−0.0360 °F) |
| 1960–1969 | −0.014 °C (−0.0252 °F) |
| 1970–1979 | −0.001 °C (−0.00180 °F) |
| 1980–1989 | 0.176 °C (0.317 °F) |
| 1990–1999 | 0.313 °C (0.563 °F) |
| 2000–2009 | 0.513 °C (0.923 °F) |
See also
- Berkeley Earth Surface Temperature project
- List of large-scale temperature reconstructions of the last 2,000 years
- Satellite temperature measurements
- Sea surface temperature
References
- ↑ Brohan, P., J.J. Kennedy, I. Harris, S.F.B. Tett, P.D. Jones (2006). "Uncertainty estimates in regional and global observed temperature changes: a new dataset from 1850". J. Geophys. Res. 111: D12106. Bibcode:2006JGRD..11112106B. doi:10.1029/2005JD006548.
- ↑ "Climate monitoring and data sets". Met Office. Retrieved 2013-04-04.
- ↑ "Datasets & Images – GISS Surface Temperature Analysis". Goddard Institute for Space Studies. Retrieved 2007-07-13.
- ↑ "GHCN-Monthly Version 2". NOAA. Retrieved 2007-07-13.
- ↑ NCDC State of the Climate Global Analysis, April 2010
- ↑ "Global Surface Temperature Anomalies". National Climatic Data Center. Retrieved 2010-06-16.
- ↑ Met Office Hadley Centre observations datasets FAQ
"GISS Surface Temperature Analysis".
NCDC: Global Surface Temperature Anomalies - ↑ Hansen, J., R. Ruedy, J. Glascoe, Mki. Sato (1999). "GISS analysis of surface temperature change". J. Geophys. Res. 104: 30997–31022. Bibcode:1999JGR...10430997H. doi:10.1029/1999JD900835.
- ↑ CMB and Crouch, J. (17 September 2012). "Global Surface Temperature Anomalies: Background Information – FAQ 1". NOAA NCDC
- ↑ Hansen, J.E. (20 November 2012). "Data.GISS: GISS Surface Temperature Analysis (GISTEMP)". New York, NY, USA: NASA GISS. Website curator: Schmunk, R.B.
- ↑ Hansen, J.E. (3 August 2010). "Data.GISS: GISTEMP -- Elusive Absolute Surface Air Temperature". New York, NY, USA: NASA GISS. Website curator: Schmunk, R.B.
- ↑ "GISS Surface Temperature Analysis – Updates to Analysis". NASA. Retrieved 2008-10-16.
- ↑ Houghton et al. (eds) (2001). "Climate Change 2001: Working Group I: The Scientific Basis – Figure 2.6". IPCC. Retrieved 2007-07-13.
- ↑ Guide to the Global Observing System. WMO. 2007. ISBN 978-9263134882.
- ↑ Houghton et al.(eds) (2001). "Climate Change 2001: Working Group I: The Scientific Basis – Chapter 12: Detection of Climate Change and Attribution of Causes". IPCC. Retrieved 2007-07-13.
- ↑ "Ch 6. Changes in the Climate System". http://www.nap.edu/openbook.php?record_id=12782&page=207 Missing or empty
|title=(help), in US NRC 2010, p. 207 - ↑ Swanson, K.L.; Sugihara, G.; Tsonis, A.A. (22 September 2009). "Long-term natural variability and 20th century climate change". Proc. Natl. Acad. Sci. U.S.A. 106 (38): 16120–3. Bibcode:2009PNAS..10616120S. doi:10.1073/pnas.0908699106. PMC 2752544. PMID 19805268.
- ↑ Houghton et al.(eds) (2001). "Climate Change 2001: Working Group I: The Scientific Basis – Chapter 2: Observed Climate Variability and Change". IPCC. Retrieved 2007-07-13.
- ↑ 19.0 19.1 19.2 Trenberth, K.E. et al. (2007). (Solomon, S. et al., ed. Executive summary, in: Observations: Surface and Atmospheric Climate Change. in: Climate Change 2007: The Physical Science Basis. Contribution of Working Group I to the Fourth Assessment Report of the Intergovernmental Panel on Climate Change. Cambridge University Press
- ↑ 20.0 20.1 Kennedy, J.J. et al. (2010). "How do we know the world has warmed?". 2. Global Climate (PDF). p. 26. In State of the Climate in 2009
- ↑ 21.0 21.1 Joint-statement by leaders of 18 scientific organizations: American Association for the Advancement of Science, American Chemical Society, American Geophysical Union, American Institute of Biological Sciences, American Meteorological Society, American Society of Agronomy, American Society of Plant Biologists, American Statistical Association, Association of Ecosystem Research Centers, Botanical Society of America, Crop Science Society of America, Ecological Society of America, Natural Science Collections, Alliance Organization of Biological Field Stations, Society for Industrial and Applied Mathematics, Society of Systematic Biologists, Soil Science Society of America, University Corporation for Atmospheric Research (21 October 2009). "Joint-statement on climate change by leaders of 18 scientific organizations" (PDF). Washington DC, USA: American Association for the Advancement of Science
- ↑ 22.0 22.1 22.2 22.3 22.4 22.5 22.6 22.7 22.8 22.9 22.10 Edited quote from public-domain source: 1 Introduction. p. 5. In State of the Climate in 2009. Full references are contained in this source.
- ↑ Walsh, J. et al., Figure 6: Short-term Variations Versus Long-term Trend, in: D. Is the global temperature still increasing? Isn’t there recent evidence that it is actually 1 cooling?, in: Appendix I: NCA Climate Science - Addressing Commonly Asked Questions from A to Z , in NCADAC 2013, p. 1065
- ↑ "Understanding and Responding to Climate Change – Highlights of National Academies Reports" (PDF). United States National Academies. 2005. Archived from the original on 2007-06-11. Retrieved 2007-07-13.
- ↑ 25.0 25.1 25.2 25.3 "Cooling the Warming Debate: Major New Analysis Confirms That Global Warming Is Real". Science Daily. 2011-10-21. Retrieved 2011-10-22.
- ↑ see also: PBS (January 10, 2007). "Interviews - James Hansen: Hot Politics: FRONTLINE: PBS". PBS. "(...) The 1990s is the real appearance of the science skeptics. How much did they come after you? I actually don't like the word "skeptics" for them; I think it's better to call them "contrarians," because skepticism is part of science; all scientists are skeptics (...)"
- ↑ Ian Sample (2011-10-20). "Global warming study finds no grounds for climate sceptics' concerns". The Guardian. Retrieved 2011-10-22.
- ↑ Richard Black (2011-10-21). "Global warming 'confirmed' by independent study". BBC News. Retrieved 2011-10-21.
- ↑ "Climate change: The heat is on". The Economist. 2011-10-22. Retrieved 2011-10-22.
- ↑ e.g., see Carter, B. (April 9, 2006). "There IS a problem with global warming... it stopped in 1998". The Daily Telegraph (Telegraph Media Group)
- ↑ 31.0 31.1 31.2 31.3 Edited quote from public-domain source: Scott, M. (December 31, 2009). "Short-term Cooling on a Warming Planet, p.1". ClimateWatch Magazine (NOAA). Introduction
- ↑ 32.0 32.1 Met Office, Fitzroy Road (14 September 2009). "Global warming set to continue". UK Met Office
- ↑ Albritton, D.L. et al. (2001). Houghton, J.T. et al., ed. Box 1: What drives changes in climate? in: Technical Summary, in: Climate Change 2001: The Scientific Basis. Contribution of Working Group I to the Third Assessment Report of the Intergovernmental Panel on Climate Change. Cambridge University Press
- ↑ 34.0 34.1 Edited quote from public-domain source: Scott, M. (December 31, 2009). "Short-term Cooling on a Warming Planet, p.3". ClimateWatch Magazine (NOAA). Deciphering Natural Variability
- ↑ Edited quote from public-domain source: Scott, M. (December 31, 2009). "Short-term Cooling on a Warming Planet, p.2". ClimateWatch Magazine (NOAA). Deciphering Natural Variability
- ↑ 36.0 36.1 1 Introduction. p. 5. In State of the Climate in 2009
- ↑ "IPCC Fourth Assessment Report, Chapter 3" (PDF). 2007-02-05. pp. 250–1. Retrieved 2009-03-14.
- ↑ Polyakov, I.V.; Bekryaev, R.V.; Bhatt, U.S.; Colony, R.L.; Maskshtas, A.P.; Walsh, D.; Bekryaev, R.V.; Alekseev, G.V. (2003). "Variability and trends of air temperature in the Maritime Arctic". J. Clim. 16 (12): 2067–77. Bibcode:2003JCli...16.2067P. doi:10.1175/1520-0442(2003)016<2067:VATOAT>2.0.CO;2.
- ↑ Liu, J.P.; Curry, J.A.; Da, Y.J.; Horton, Radley (2007). "Causes of the northern high-latitude land surface winter climate change". Geophys. Res. Lett. 34 (14): L14702. Bibcode:2007GeoRL..3414702L. doi:10.1029/2007GL030196.
- ↑ David W. J. Thompson and Susan Solomon (2002). "Interpretation of Recent Southern Hemisphere Climate Change". Science 296 (5569): 895–9. Bibcode:2002Sci...296..895T. doi:10.1126/science.1069270. PMID 11988571.
- ↑ "Antarctic temperature data – Monthly mean surface temperature data and derived statistics for some Antarctic stations". British Antarctic Survey. Retrieved 2007-07-13.
- ↑ 42.0 42.1 42.2 42.3
 This article incorporates public domain material from the US Climate Change Science Program document: Wigley, T.M.L. et al. (2006). "Executive Summary". In T. R. Karl, T.R. et al. Temperature Trends in the Lower Atmosphere: Steps for Understanding and Reconciling Differences. A Report by the Climate Change Science Program (CCSP) and the Subcommittee on Global Change Research. Washington, DC, USA: CCSP , p.7
- ↑ 43.0 43.1 Thompson D.W.J., J.J. Kennedy, J.M. Wallace and P.D. Jones (2008). "A large discontinuity in the mid-twentieth century in observed global-mean surface temperature". Nature 453 (7195): 646–9. Bibcode:2008Natur.453..646T. doi:10.1038/nature06982. PMID 18509442.
- ↑ See also: Venema, V., O. Mestre, E. Aguilar, I. Auer, J.A. Guijarro, P. Domonkos, G. Vertacnik, T. Szentimrey, P. Stepanek, P. Zahradnicek, J. Viarre, G. Müller-Westermeier, M. Lakatos, C.N. Williams, M.J. Menne, R. Lindau, D. Rasol, E. Rustemeier, K. Kolokythas, T. Marinova, L. Andresen, F. Acquaotta, S. Fratianni, S. Cheval, M. Klancar, M. Brunetti, Ch. Gruber, M. Prohom Duran, T. Likso, P. Esteban, Th. Brandsma. Benchmarking homogenization algorithms for monthly data. Climate of the Past, 8, pp. 89-115,doi:10.5194/cp-8-89-2012, 2012.
- ↑ Brohan, P., J.J. Kennedy, I. Haris, S.F.B. Tett, P.D. Jones (2006). "Uncertainty estimates in regional and global observed temperature changes: a new dataset from 1850" (PDF). J. Geophys. Res. 111: D12106. Bibcode:2006JGRD..11112106B. doi:10.1029/2005JD006548.
- ↑ Folland, C.K., N.A. Rayner, S.J. Brown, T.M. Smith, S.S.P. Shen, D.E. Parker, I. Macadam, P.D. Jones, R.N. Jones, N. Nicholls, D.M.H. Sexton (2001). "Global temperature change and its uncertainties since 1861" (PDF). Geophysical Research Letters 28 (13): 2621–4. Bibcode:2001GeoRL..28.2621F. doi:10.1029/2001GL012877.
- ↑ Davey, C.A.; Pielke Sr., R.A. (c. 2007). Comparing Station Density and Reported Temperature Trends for Land-Surface Sites, 1979-2004. Roger A. Pielke Sr. (submitted to Climatic change). Retrieved 2007-07-13.
- ↑ IPCC (2007). (Core Writing Team, Pachauri, R.K and Reisinger, A., ed. Sec 6.1 Observed changes in climate and their effects, and their causes: Robust findings , in: Synthesis report, in: Climate Change 2007: Synthesis Report. Contribution of Working Groups I, II and III to the Fourth Assessment Report of the Intergovernmental Panel on Climate Change. Geneva, Switzerland: IPCC
- ↑ UNITED NATIONS FRAMEWORK CONVENTION ON CLIMATE CHANGE October 1997
- ↑ Menne MJ, Frederick HV, Del Greco SA (2005). Monitoring the health of weather and climate observing networks. 21st International Conference on Interactive Information Processing Systems (IIPS) for Meteorology, Oceanography, and Hydrology.
- ↑ "Monitoring the Health of Weather and Climate Observing Networks". Health of the Networks. National Climatic Data Center.
- ↑ The Need for a Systems Approach to Climate Observations Trenberth, Karl, and Spence
- ↑ Climate Science: Roger Pielke Sr. Research Group Weblog
- ↑ The Sunday Times, February 14, 2010
- ↑ Climate Science: Roger Pielke Sr. Research Group Weblog
- ↑ National Research Council (1999). Adequacy of Climate Observing Systems. Washington, DC: National Academies Press. ISBN 978-0-309-07507-7.
- ↑ NOAA National Weather Service Cooperative Observer Program: Proper Siting
- ↑ 58.0 58.1 Temperature Trends in the Lower Atmosphere: Steps for Understanding and Reconciling Differences. Thomas R. Karl, Susan J. Hassol, Christopher D. Miller, and William L. Murray, editors, 2006. A Report by the Climate Change Science Program and the Subcommittee on Global Change Research, Washington, DC.
- ↑ Hale, R.C.; Gallo, K.P.; Owen, T.W.; Loveland, T.R. (June 2006). "Land use/land cover change effects on temperature trends at U.S. Climate Normals stations". Geophys. Res. Lett. 33 (11): L11703. Bibcode:2006GeoRL..3311703H. doi:10.1029/2006GL026358.
- ↑ Mahmood R, Foster SA, Logan D (2006). "The GeoProfile metadata, exposure of instruments, and measurement bias in climatic record revisited". International Journal of Climatology 26 (8): 1091–1124. Bibcode:2006IJCli..26.1091M. doi:10.1002/joc.1298.
- ↑ Indiana State Climate Office
- ↑ Davey, Christopher A.; Pielke Sr., Roger A. (April 2005). "Microclimate Exposures of Surface-Based Weather Stations: Implications For The Assessment of Long-Term Temperature Trends" (PDF). Bull. Amer. Meteor. Soc. 86 (4): 497–504. doi:10.1175/BAMS-86-4-497.
- ↑ Peterson, Thomas C. (August 2006). "Examination of potential biases in air temperature caused by poor station locations" (PDF). Bull. Amer. Meteor. Soc. 87 (8): 1073–89. doi:10.1175/BAMS-87-8-1073.
- ↑ Documentation of Uncertainties and Biases Associated with Surface Temperature Measurement Sites for Climate Change Assessment Pielke et alia.
- ↑ 65.0 65.1 "NOAA National Climatic Data Center, State of the Climate: Global Analysis for Annual 2014". NOAA. Retrieved 2015-01-21.
- ↑ 66.0 66.1 66.2 66.3 NCDC: Climate at a Glance
- ↑ NCDC: Global Surface Temperature Anomalies: Global Mean Temperature Estimates
- ↑ NCDC State of the Climate Global Analysis, Annual 2007
- ↑ Natural Climate Oscillations of Short Duration and the Long Term Climate Warming – Sorting Out the Climate System USGCRP Seminar, 20 March 2000 Updated 13 August, 2004
- ↑ NASA Research Finds Last Decade was Warmest on Record, 2009 One of Warmest Years
- Global average temperature for the last 150 years and discussion of trends
- IPCC Fourth Assessment Report (AR4) WGI Summary for Policy Makers (SPM)
- NCADAC (11 January 2013), Federal Advisory Committee Draft Climate Assessment. A report by the National Climate Assessment Development Advisory Committee (NCADAC), Washington, DC, USA: U.S. Global Change Research Program
- US NRC (2010). Advancing the Science of Climate Change. A report by the US National Research Council (US NRC). Washington, D.C.: The National Academies Press. ISBN 978-0-309-14588-6
- Preliminary data from the last 2000 years
- Arndt, D.S.; Baringer, M.O.; Johnson, M.R. (2010). "State of the Climate in 2009". Bull. Amer. Meteor. Soc. 91 (7): S1–S224. doi:10.1175/BAMS-91-7-StateoftheClimate.
External links
- The EdGCM project has provided GISTEMP stations in Google Earth
- GISTemp – A Human View, introduction & overview, how it's made.
- Met.office Global-average temperature records, condensed explanation
- Jones, P.D.; New, M.; Parker, D.E.; Martin, S.; Rigor, I.G. (May 1999). "Surface air temperature and its changes over the past 150 years" (PDF). Rev. Geophys. 37 (2): 173–199. Bibcode:1999RvGeo..37..173J. doi:10.1029/1999RG900002.
| ||||||