Income in the United Kingdom
In terms of global poverty criteria, the United Kingdom is a wealthy country, with virtually no people living on less than £4 a day. There is both significant income redistribution and income inequality; for instance, in 2008/09 income in the top and bottom fifth of households was £73,800 and £15,000, respectively, before taxes and benefits. After tax and benefits, household income disparities are significantly reduced (to £53,900 and £13,600 respectively).[1]
The UK Gini coefficient is estimated at 0.36. There were over 619,000 net worth Sterling millionaires in Britain in 2011.[2] The main sources for statistics on UK income are HM Revenue and Customs (HMRC) and the Office for National Statistics.
Taxable income
April 2010 median gross weekly earnings for full-time employees were £499.[3]
According to OECD statistics after tax, the average British family in 2009 was left with an average of 26,904 USD in disposable income, compared with 28,310 USD for the average French family, 28,799 USD for the average German family, 22,847 USD for the average Spanish family, and 24,216 USD for the average Italian family.[4] This represents a significant fall in the UK’s position when compared to 2002.[5] In 2003, the median wage was £20,000.[6] In 2006, average gross hourly pay for full-time and part-time men and women in the UK as a whole was £12.50 an hour.[7] In 2011, average individual earnings for full-time workers in Britain were £26,000 (dropping to £21,000 when part-time workers are included), while the average income for working-age households was around £33,000.[8] That same year, the after-tax earnings of the median household was around £26,000 per annum[9] while average net household income (after tax) stood at £38,547.[10]
In 2008, median hourly earnings (excluding overtime) for men was £12.50, and £10.91 for women. In 2010, the median wage in the UK for all jobs was £20,801.[11] A year later, a Department for Work and Pensions spokeswoman defined £15,000 as “quite a good wage.”[12]
In 2010, the real adjusted gross disposable income of households per capita in PPS in the United Kingdom was £21,919.[13] In 2011, the average household net-adjusted disposable income was 26,552 USD per annum,[14] while the median annual salary was £21,326.[15] In April 2012, average gross weekly earnings for full-time employees were £506, an increase of 1.5% cent from £498 in 2011. This brought the average full-time wage to £26,500.[16]
In the European Union in 2006, the highest gross hourly wage was recorded in Denmark, with 22.38 euros, followed by Ireland and the United Kingdom where average earnings were respectively 20.83 euros and 19.47 euros per hour.[17]
In 2009, 20.6% of full-time employees were estimated to be low-paid, defined by the OECD as earning less than two-thirds of the national gross median hourly full-time wage.[18]
According to an annual survey from 2012, the UK standard of living in 2011 was 18% higher than the European average.[19]
Data from HMRC 2004–2005; incomes are before tax for individuals. The personal allowance or income tax threshold was £4,745 (people with incomes below this level did not pay income tax). The mean income was £22,800 per year with the average Briton paying £4,060 in income tax.
| Range | Number of taxpayers |
|---|---|
| £4,745 to £6,000 | 1,440,000 |
| £6,000 to £7,000 | 1,160,000 |
| £7,000 to £8,000 | 1,590,000 |
| £8,000 to £10,000 | 2,950,000 |
| £10,000 to £12,000 | 2,760,000 |
| £12,000 to £15,000 | 3,650,000 |
| £15,000 to £20,000 | 4,950,000 |
| £20,000 to £30,000 | 6,000,000 |
| £30,000 to £50,000 | 4,090,000 |
| £50,000 to £70,000 | 859,000 |
| £70,000 to £100,000 | 410,000 |
| £100,000 to £200,000 | 300,000 |
| £200,000 to £500,000 | 89,000 |
| £500,000 to £1 million | 16,000 |
| Over £1 million | 6,000 |
Percentile points for income of taxpaying individuals before tax
For tax years 1999-00 to 2012–13 except 2008–09: note, this is taxpayers only.[20]
| 1% | 5% | 10% | 25% | 50% | 75% | 90% | 95% | 99% | Mean | |
|---|---|---|---|---|---|---|---|---|---|---|
| 1999-00 | £4,600 | £5,630 | £6,570 | £9,260 | £14,400 | £22,300 | £33,000 | £44,600 | £96,400 | £19,600 |
| 2000–01 | £4,620 | £5,520 | £6,480 | £9,280 | £14,800 | £23,000 | £34,200 | £46,700 | £102,000 | £20,300 |
| 2001–02 | £4,780 | £5,850 | £6,860 | £9,910 | £15,500 | £24,300 | £36,200 | £49,200 | £107,000 | £21,400 |
| 2002–03 | £4,860 | £5,960 | £6,970 | £10,000 | £15,800 | £24,700 | £36,700 | £49,800 | £108,000 | £21,600 |
| 2003–04 | £4,820 | £5,850 | £7,000 | £10,100 | £16,000 | £25,100 | £37,100 | £50,600 | £111,000 | £21,900 |
| 2004–05 | £4,980 | £6,070 | £7,260 | £10,300 | £16,400 | £26,100 | £39,000 | £52,400 | £117,000 | £22,800 |
| 2005–06 | £5,200 | £6,350 | £7,610 | £10,800 | £17,100 | £27,400 | £41,300 | £56,200 | £132,000 | £24,300 |
| 2006–07 | £5,410 | £6,600 | £7,880 | £11,200 | £17,700 | £28,400 | £42,900 | £58,500 | £141,000 | £25,500 |
| 2007–08 | £5,600 | £6,870 | £8,240 | £11,800 | £18,500 | £29,500 | £44,900 | £61,500 | £149,000 | £26,800 |
| 2009–10 | £6,800 | £7,970 | £9,510 | £12,900 | £19,600 | £30,900 | £46,600 | £63,200 | £149,000 | £28,400 |
| 2010–11 | £6,730 | £7,830 | £9,350 | £12,700 | £19,500 | £30,900 | £46,300 | £62,600 | £140,000 | £27,400 |
| 2011–12 | £7,740 | £8,840 | £10,200 | £13,500 | £20,300 | £32,100 | £48,300 | £66,200 | £147,000 | £26,500 |
| 2012–13 | £8,370 | £9,570 | £10,900 | £14,200 | £21,000 | £32,900 | £49,200 | £67,900 | £150,000 | £27,000 |
Income distribution across age bands 2004-5
Source for tax year 2004–05. To estimate for 2010–11, increase by 22% to allow for inflation.[21]
| Age band | Median income | Mean income | Median income (men) | Mean income (men) | Median income (women) | Mean income (women) |
|---|---|---|---|---|---|---|
| Under 20 | £8,130 | £9,570 | £8,490 | £9,810 | £7,990 | £9,250 |
| 20 – 24 | £11,800 | £13,200 | £12,400 | £13,800 | £11,200 | £12,300 |
| 25 – 29 | £17,000 | £19,300 | £17,800 | £20,600 | £15,900 | £17,800 |
| 30 – 34 | £19,500 | £23,900 | £21,600 | £26,700 | £16,400 | £20,100 |
| 35 – 39 | £20,100 | £26,800 | £23,600 | £31,700 | £15,500 | £20,100 |
| 40 – 44 | £20,200 | £28,100 | £24,600 | £34,600 | £14,900 | £19,800 |
| 45 – 49 | £20,300 | £28,600 | £24,800 | £35,400 | £15,200 | £20,100 |
| 50 – 54 | £19,300 | £27,000 | £23,500 | £33,400 | £15,100 | £19,200 |
| 55 – 59 | £17,200 | £24,500 | £20,900 | £29,900 | £13,100 | £17,200 |
| 60 – 64 | £13,600 | £20,000 | £16,500 | £24,300 | £10,700 | £14,200 |
| 65 – 69 | £12,600 | £17,900 | £13,600 | £19,500 | £11,100 | £14,800 |
| 70 – 74 | £13,300 | £18,100 | £15,600 | £21,100 | £10,700 | £14,300 |
| Over 75 | £12,400 | £16,700 | £15,300 | £19,900 | £10,400 | £14,100 |
Income distribution across UK regions 2007
- Office for National Statistic 2007[22]
| UK region | Gross income |
|---|---|
| London | £27,868 |
| South East England | £21,109 |
| Northern Ireland | £19,603 |
| East Anglia | £19,469 |
| Scotland | £19,282 |
| North West England | £19,236 |
| West Midlands | £18,801 |
| South West England | £18,629 |
| Yorkshire & the Humber | £18,614 |
| East Midlands | £18,321 |
| Wales | £17,651 |
| North East England | £17,594 |
Income distribution by job type
Median earnings between different job types in 2010 can be seen here.
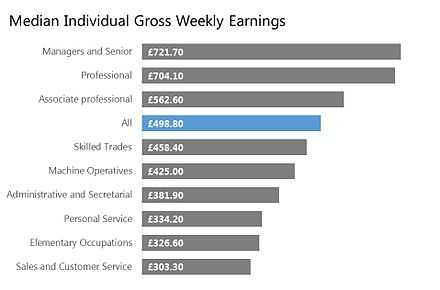
The graph was originally published here.
Further information can be obtained from the 2010 Annual Survey of Hours and Earnings (ASHE)
Post tax household income

The data below is taken from the Institute for Fiscal Studies and is based on a household with two adults and no children for 2006. This is taken from the Household income survey and includes net income after all taxes and including any social security benefits (i.e. the amount of money people actually have to spend). These figures can be converted to match household composition using an equivalence scale.

| Annual net household income | Percentile point |
|---|---|
| £5,000 | 3% |
| £10,000 | 10% |
| £15,000 | 31% |
| £20,000 | 50% |
| £25,000 | 66% |
| £30,000 | 77% |
| £35,000 | 85% |
| £40,000 | 90% |
| £45,000 | 93% |
| £50,000 | 95% |
| £60,000 | 97% |
| £75,000 | 99% |
Wealth
The net worth information is based on data from HMRC for 2004–2005[23] and includes marketable assets including house equity, cash, shares, bonds and investment trusts. These values do not include personal possessions.
| Percentile point | Wealth to qualify | Percentage of total wealth owned by people at and above this level |
|---|---|---|
| Top 1% | £688,228 | 21% of total UK wealth |
| 2% | £460,179 | 28% of total UK wealth |
| 5% | £270,164 | 40% of total UK wealth |
| 10% | £176,221 | 53% of total UK wealth |
| 25% | £76,098 | 72% of total UK wealth |
| 50% | £35,807 | 93% of total UK wealth |
High income
The Institute for Fiscal Studies issued a report on Britain's highest earners in January 2008. The report is available here . There are 42 million adults in Britain of whom 29 million are income tax payers. (The remainder are pensioners, students, homemakers, unemployed, those earning under the personal allowance, and unwaged other.) A summary of key findings is shown in the table below:
| All taxpayers | Top 10% to 1% (adults) | Top 1% to 0.1% (adults) | Top 0.1% (adults) | |
|---|---|---|---|---|
| Number | 29.5 million | 4.21 million | 421,000 | 42,000 |
| Entry level for group | £5,093 | £35,345 | £99,727 | £351,137 |
| Mean value for group | £24,769 | £49,960 | £155,832 | £780,043 |
| Average income tax paid | £4,415 | £10,550 | £49,477 | £274,482 |
| Percentage of national personal income | 100% | 27.6% | 8.6% | 4.2% |
The top 0.1% are 90% male and 50% of these people are in the 45 to 54 year age group. 31% of these people live in London and 21% in South East England. 33% of these people are company directors (as reported to HMRC). 30% work in finance and 38% in general business (includes law). The very richest rely on earnings (salary and bonuses) for 58% of income. Income from self-employment (such as partnerships in law or accountancy firms) accounts for 23% of income and about 18% from investment income (interest and share dividends).
Sources of income
The Family Resources Survey is a document produced by the Department for Work and Pensions. This details income amongst a representative sample of the British population. The 2005–2006 report can be found here . This report tabulates sources of income as a percentage of total income.
| Region | Employment (salaries & wages) | Self employed | Investment income | Working tax credit | State pensions | Occupational pensions | Disability benefits | Other social security benefits | Other income sources |
|---|---|---|---|---|---|---|---|---|---|
| UK | 64% | 11% | 2% | 1% | 6% | 7% | 2% | 5% | 2% |
| Northern Ireland | 60% | 11% | 1% | 2% | 7% | 5% | 4% | 7% | 3% |
| Scotland | 66% | 7% | 2% | 2% | 7% | 7% | 3% | 5% | 2% |
| Wales | 60% | 8% | 2% | 2% | 8% | 8% | 4% | 6% | 1% |
| England | 64% | 11% | 2% | 1% | 6% | 7% | 2% | 5% | 2% |
| North East England | 64% | 5% | 2% | 2% | 8% | 6% | 4% | 7% | 2% |
| North West England | 59% | 13% | 2% | 2% | 7% | 7% | 3% | 6% | 2% |
| Yorkshire | 64% | 7% | 2% | 2% | 7% | 7% | 2% | 5% | 3% |
| East Midlands | 65% | 9% | 2% | 1% | 7% | 6% | 2% | 5% | 3% |
| West Midlands | 62% | 8% | 3% | 2% | 8% | 6% | 2% | 5% | 3% |
| Eastern England | 56% | 22% | 2% | 1% | 5% | 7% | 1% | 3% | 2% |
| London | 71% | 10% | 2% | 1% | 4% | 4% | 1% | 5% | 3% |
| South East | 66% | 9% | 4% | 1% | 7% | 8% | 1% | 4% | 2% |
| South West England | 60% | 9% | 4% | 1% | 7% | 10% | 2% | 4% | 2% |
Other social security benefits include: Housing Benefit, Income Support and Jobseeker's Allowance
Historical statistics on earnings in the United Kingdom
Gross weekly earnings of full-time adult workers, April 1978 (in £)[24]
Lowest decile
Non-manual (men)
57.7
Non-manual (women)
37.1
Manual (men)
53.4
Manual (women)
33.7
Lower quartile
Non-manual (men)
72.0
Non-manual (women)
44.2
Manual (men)
63.2
Manual (women)
39.6
Median
Non-manual (men)
91.8
Non-manual (women)
53.9
Manual (men)
76.8
Manual (women)
47.6
Upper quartile
Non-manual (men)
117.4
Non-manual (women)
68.7
Manual (men)
93.1
Manual (women)
57.0
Highest decile
Non-manual (men)
150.4
Non-manual (women)
88.8
Manual (men)
112.2
Manual (women)
67.1
See also
- Poverty in the United Kingdom
- Taxation in the United Kingdom
- Pension provision in the United Kingdom
References
- ↑ Office for National Statistics (10, June 2010). Income inequality remains stable 2010 News release].
- ↑ http://www.telegraph.co.uk/finance/recession/8819427/Millionaires-number-of-wealthy-Britons-rises-despite-recession.html>
- ↑ Office for National Statistics (2010). Annual Survey of Hours and Earnings, 2010 Statistical Bulletin.
- ↑ "OECD Better Life Index". OECD Better Life Index. Retrieved 2013-12-30.
- ↑ Jill Insley (2002-06-10). "The mugs of Europe | Money". London: The Observer. Retrieved 2013-12-30.
- ↑ Polly Toynbee (2003-03-14). "Comment: Poverty of ambition | World news". London: The Guardian. Retrieved 2013-12-30.
- ↑ "Average Hourly Pay In 81 Out of 204 UK Areas Below 90% Of UK Average Of £12.50 Per Hour". ePolitix.com. 2006-01-10. Retrieved 2013-12-30.
- ↑ Prospect Magazine, Issue 178, January 2011 edition
- ↑ Patrick Collinson and Mark King (2010-10-05). "How benefit cuts could affect you | Politics". London: The Guardian. Retrieved 2013-12-30.
- ↑ "uSwitch Quality of Life Index: UK is the worst place to live in Europe". 2011-09-28. Archived from the original on 2012-04-04. Retrieved 2014-09-09.
- ↑ Rohrer, Finlo (2009-07-15). "UK | Magazine | Just what is a big salary?". BBC News. Retrieved 2013-12-30.
- ↑ Newman, Cathy (2010-05-27). "Better off on benefits than earning £15,000 a year?". Channel 4 – The FactCheck Blog. Retrieved 2013-12-30.
- ↑ "Eurostat – Tables, Graphs and Maps Interface (TGM) table". Epp.eurostat.ec.europa.eu. 2013-10-17. Retrieved 2013-12-30.
- ↑ "OECD Better Life Index". OECD Better Life Index. Retrieved 2013-12-30.
- ↑ Ball, James (2011-11-24). "Wages throughout the country: how does your area compare? | News". London: theguardian.com. Retrieved 2013-12-30.
- ↑ Russell Lynch (2012-11-22). "Women close pay gap but earnings lose ground to inflation – Business News – Business". London: The Independent. Retrieved 2013-12-30.
- ↑ http://epp.eurostat.ec.europa.eu/cache/ITY_OFFPUB/KS-SF-10-003/EN/KS-SF-10-003-EN.PDF
- ↑ http://www.resolutionfoundation.org/media/media/downloads/Beyond_the_Bottom_Line_-_FINAL.pdf
- ↑ Ed Monk (2012-12-13). "UK standard of living slides against EU rivals – Britain slips to sixth in table of nations". This is Money. Retrieved 2013-12-30.
- ↑ https://www.gov.uk/government/statistics/percentile-points-from-1-to-99-for-total-income-before-and-after-tax
- ↑ "Education and Museum | Inflation Calculator". Bank of England. Retrieved 2013-12-30.
- ↑ "Economic Data". investinmanchester. Archived from the original on 2012-04-27. Retrieved 2014-09-09.
- ↑ HMRC Distribution among the adult population of marketable wealth (Series C) (Table 13.5)
- ↑ Labour and Inequality: A Fabian Study of Labour in Power, 1974-79 edited by Nick Bosanquet and Peter Townsend
| ||||||