Immigration to Italy
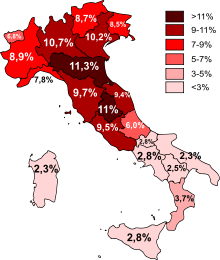
Foreign residents as a percentage of the regional population, 2011
Immigration to Italy occurs from a variety of countries.
As of January 2014, there were an estimated 5,000,073 foreign nationals resident in Italy.[1] This amounted to 8.3% of the country’s population and represented an increase of 612,352 (+13,95) over the previous year. These figures include 97,000 children born in Italy to foreign nationals (19% of total births in Italy) in 2014, but exclude foreign nationals who have subsequently acquired Italian nationality; this applied to 106,000 people in 2014.[1] They also exclude illegal immigrants whose numbers are difficult to determine. The distribution of foreign born population is largely uneven in Italy: 84.9% of immigrants live in the northern and central parts of the country (the most economically developed areas), while only 15.1% live in the southern half of the peninsula.[1]
There is a high level of illegal immigration to Italy - in May 2008, The Boston Globe quoted an estimate of 670,000 undocumented residents.[2] Many immigrants from Africa make the dangerous boat journey across the Mediterranean to Italy. This has led to numerous disasters such as the May 2007 Malta migrant shipwreck, the 2009 Mediterranean Sea migrant shipwreck, the 2011 Mediterranean Sea migrant shipwreck, the 2013 Lampedusa migrant shipwreck, the 2014 Libya migrant shipwreck, the 2014 Malta migrant shipwreck, and the April 2015 Libya migrant shipwrecks.[3] Once in Italy, immigrants seeking asylum often are unable to leave due to the Dublin Regulation requirement that they stay in the first country where they are processed.[4]
Since the expansion of the European Union, the most recent wave of migration has been from surrounding European states, particularly Eastern Europe, and increasingly Asia,[5] replacing North Africa as the major immigration area. About a million Romanians, around 10% of them being Roma,[6] are officially registered as living in Italy. As of 2013, the foreign born population origin was subdivided as follows: Europe (50.8%), Africa (22.1%), Asia (18.8%), America (8.3%), and Oceania (0.1%).[7]
Statistics
Total foreign population
Source: demo.istat.it
| Year | Population | Increase | % |
|---|
| 2003 | 1,549,373 | n.a. | n.a. |
| 2004 | 1,990,159 | 440,786 | +28.44 |
| 2005 | 2,402,157 | 411,998 | +20.70 |
| 2006 | 2,670,514 | 268,357 | +11.17 |
| 2007 | 2,938,922 | 268,408 | +10.05 |
| 2008 | 3,432,651 | 493,729 | +16.79 |
| 2009 | 3,891,295 | 458,644 | +13.36 |
| 2010 | 4,235,059 | 343,764 | +8.83 |
| 2011[note 1] | 4,029,145 | −205,914 | −4.87 |
| 2012 | 4,053,599 | 24,454 | +0.60 |
| 2013 | 4,387,721 | 334,122 | +8.24 |
| 2014[8] | 5,000,073 | 612,352 | +13,95 |
Immigration by country[note 2]
| Country | 2010[9] | 2011[10] | 2012[11] | 2013[12] | 2014[13] |
|---|
 Romania Romania | 887,763 | 823,100 | 834,465 | 933,354 | 1,081,400 |
 Morocco Morocco | 431,529 | 407,097 | 408,667 | 426,971 | 524,775 |
 Albania Albania | 466,684 | 451,437 | 450,908 | 464,962 | 502,546 |
 China China | 188,352 | 194,510 | 197,064 | 223,367 | 320,794 |
 Ukraine Ukraine | 174,129 | 178,534 | 180,121 | 191,725 | 233,726 |
 Philippines Philippines | 123,584 | 129,015 | 129,188 | 139,835 | 165,783 |
 India India | 105,863 | 116,797 | 118,409 | 128,903 | 160,296 |
 Moldova Moldova | 37.971 | 130,619 | 132,175 | 139,734 | 150,021 |
 Egypt Egypt | 82,064 | 65,985 | 66,932 | 76,691 | 135,.284 |
 Bangladesh Bangladesh | 73,965 | 80,639 | 81,683 | 92,695 | 127,861 |
 Tunisia Tunisia | 103,678 | 82,066 | 82,997 | 88,291 | 122,354 |
 Poland Poland | 105,608 | 84,619 | 84,749 | 88,839 | 97,566 |
 Serbia Serbia
 Montenegro Montenegro | 95,875 | n.a. | 43,816 | 109,474 |
 Pakistan Pakistan | 64,859 | 69,877 | 71,031 | 80,658 | 80,485 |
 Sri Lanka Sri Lanka | 75,343 | 71,203 | 71,573 | 79,530 | 84,405 |
 Senegal Senegal | 72,618 | 72,458 | 73,702 | 80,325 | 97,781 |
 Ecuador Ecuador | 85,940 | 80,645 | 80,333 | 82,791 | 91,145 |
 Macedonia Macedonia | 92,847 | 73,407 | 73,972 | 76,608 | 84,318 |
|
See also
Notes
- ↑ The figures for 2011 have been updated downward as a result of the 15th General Census of Italy which offered more precise data.
- ↑ Since 2013, the European Union foreign nationals are no longer counted in the immigration statistics. This includes the Romanians, the largest minority group in Italy.
References
|
|---|
| | Africa | |
|---|
| | Asia | |
|---|
| | Europe | |
|---|
| | Oceania | |
|---|
| | South America | |
|---|
|