Hull City Council election, 2010
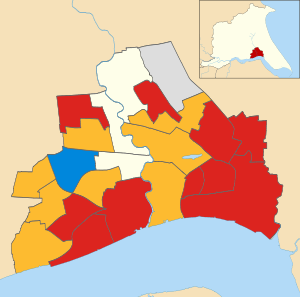
Map of the results of the 2010 Hull council election.
Labour in red, Liberal Democrats in yellow,
Conservatives in blue, Independent in grey, Uncontested in cream.
The 2010 Hull City Council election took place on 6 May 2010 to elect members of Hull City Council in England.[1] One third of the council was up for election and Liberal Democrats retained control of the council.[2]
After the election, the composition of the council was[2]
Ward results
No elections were held in Beverley, Kings Park and Newland wards.
Avenue
| Avenue[3] |
| Party |
Candidate |
Votes |
% |
±% |
|
Liberal Democrat |
Simone Butterworth |
2,793 |
49.6 |
|
|
Labour |
Andrew Michael Deane |
1,661 |
29.5 |
|
|
Green |
Martin John Deane |
673 |
11.9 |
|
|
Conservative |
Alexander David Hayward |
509 |
9.0 |
|
| Majority |
1,132 |
20.0 |
|
| Turnout |
5,665 |
60.1 |
|
|
Liberal Democrat hold |
Swing |
|
|
Boothferry
| Boothferry[4] |
| Party |
Candidate |
Votes |
% |
±% |
|
Liberal Democrat |
Stephen Baker |
2,202 |
40.4 |
|
|
Labour |
John Alfred Bailey |
1,811 |
33.2 |
|
|
Conservative |
Daniel Joseph Frazer |
771 |
14.1 |
|
|
UKIP |
Brian Shepherd |
428 |
7.8 |
|
|
English Democrats |
David Rust |
245 |
4.5 |
|
| Majority |
391 |
7.1 |
|
| Turnout |
5,480 |
57.4 |
|
|
Liberal Democrat hold |
Swing |
|
|
Bransholme East
| Bransholme East[5] |
| Party |
Candidate |
Votes |
% |
±% |
|
Independent |
Anita Harrison |
962 |
36.4 |
|
|
Labour |
Peter David Clark |
930 |
35.2 |
|
|
Liberal Democrat |
Robyn Randall |
466 |
17.6 |
|
|
Conservative |
Colin Robert Baxter |
211 |
8.0 |
|
|
Green |
Lilly Lawton |
72 |
2.7 |
|
| Majority |
32 |
1.2 |
|
| Turnout |
2,662 |
39.1 |
|
|
Independent hold |
Swing |
|
|
Bransholme West
Two candidates elected.
| Bransholme West[6] |
| Party |
Candidate |
Votes |
% |
±% |
|
Labour |
Phil Webster |
1,251 |
26.6 |
|
|
Labour |
Helene O'Mullane |
1,171 |
24.9 |
|
|
Liberal Democrat |
Aimi Sugarman |
676 |
14.4 |
|
|
Liberal Democrat |
Charles Quinn |
600 |
12.7 |
|
|
Conservative |
David Triffitt Whellan |
614 |
13.0 |
|
|
Green |
Mark Gretton |
243 |
5.2 |
|
|
Independent |
Anita Harrison |
154 |
3.3 |
|
| Majority |
80 |
1.7 |
|
| Turnout |
2,662 |
44.9 |
|
|
Labour hold |
Swing |
|
|
|
Labour hold |
Swing |
|
|
Bricknell
Two candidates elected.
| Bricknell[7] |
| Party |
Candidate |
Votes |
% |
±% |
|
Conservative and Unionist Party |
John Logan Fareham |
1,937 |
24.8 |
|
|
Conservative and Unionist Party |
John Francis Abbott |
1,671 |
21.4 |
|
|
Liberal Democrat |
Carla Ramsay |
1,109 |
14.2 |
|
|
Labour |
Lynn Petrini |
1,032 |
13.2 |
|
|
Labour |
Gwendoline Lunn |
999 |
12.8 |
|
|
Liberal Democrat |
Brian Tompsett |
800 |
10.2 |
|
|
Green |
James Edward Russell |
261 |
3.3 |
|
| Majority |
266 |
3.4 |
|
| Turnout |
4,186 |
64.2 |
|
|
Conservative and Unionist Party hold |
Swing |
|
|
|
Conservative and Unionist Party hold |
Swing |
|
|
Derringham
| Derringham[8] |
| Party |
Candidate |
Votes |
% |
±% |
|
Liberal Democrat |
Stephen Hull |
2,079 |
42.2 |
|
|
Labour |
Gary Douglas Wareing |
1,487 |
30.2 |
|
|
Conservative |
Craig William Ulliott |
692 |
14.1 |
|
|
UKIP |
John Henry Cornforth |
667 |
13.5 |
|
| Majority |
592 |
12.0 |
|
| Turnout |
4,939 |
55.3 |
|
|
Liberal Democrat hold |
Swing |
|
|
Drypool
| Drypool[9] |
| Party |
Candidate |
Votes |
% |
±% |
|
Liberal Democrat |
Linda Chambers |
2,323 |
48.9 |
|
|
Labour |
Alan David Gardiner |
1,695 |
35.7 |
|
|
Conservative |
David Thompson |
503 |
10.6 |
|
|
Green |
Zoe Belinda Lloyd |
228 |
4.8 |
|
| Majority |
628 |
13.2 |
|
| Turnout |
4,767 |
50.6 |
|
|
Liberal Democrat hold |
Swing |
|
|
Holderness
| Holderness[10] |
| Party |
Candidate |
Votes |
% |
±% |
|
Liberal Democrat |
Jan Hornby |
2,560 |
43.4 |
|
|
Labour |
Pete Allen |
2,389 |
40.5 |
|
|
Conservative |
Andrew John Barrett |
949 |
16.1 |
|
| Majority |
171 |
2.9 |
|
| Turnout |
5,938 |
58.9 |
|
|
Liberal Democrat hold |
Swing |
|
|
Ings
| Ings[11] |
| Party |
Candidate |
Votes |
% |
±% |
|
Labour |
Steven Walker |
2,211 |
41.5 |
|
|
Liberal Democrat |
Patrick Spicer |
1,853 |
34.7 |
|
|
Conservative |
Philip David MacKay |
689 |
12.9 |
|
|
Independent |
Mel Taylor |
581 |
10.9 |
|
| Majority |
358 |
6.7 |
|
| Turnout |
5,362 |
56.5 |
|
|
Labour gain from N.E.W. Hull Independent |
Swing |
|
|
Longhill
| Longhill[12] |
| Party |
Candidate |
Votes |
% |
±% |
|
Labour |
Carol Ann Clarkson |
2,235 |
55.2 |
|
|
Liberal Democrat |
Esther Moulson |
639 |
15.8 |
|
|
Conservative |
Leslie Harry Fisher |
480 |
11.8 |
|
|
Independent |
Chris Lefevre |
272 |
6.7 |
|
|
BNP |
Jason Paul Carr |
268 |
6.6 |
|
|
English Democrats |
Billy Hughes |
158 |
3.9 |
|
| Majority |
1,596 |
39.3 |
|
| Turnout |
4,065 |
47.4 |
|
|
Labour hold |
Swing |
|
|
Marfleet
Myton
| Myton[14] |
| Party |
Candidate |
Votes |
% |
±% |
|
Labour |
Matrin Mancey |
1,852 |
47.4 |
|
|
Liberal Democrat |
Peter Welton |
812 |
20.8 |
|
|
Conservative |
Dan Bond |
465 |
11.9 |
|
|
UKIP |
Kenneth William Hordon |
283 |
7.2 |
|
|
National Front |
Nick Walsh |
197 |
5.0 |
|
|
Green |
Susan Ivy Harr |
165 |
4.2 |
|
|
English Democrats |
Rachel Louise Carter |
137 |
3.5 |
|
| Majority |
1,040 |
26.4 |
|
| Turnout |
3,942 |
40.1 |
|
|
Labour hold |
Swing |
|
|
Newington
| Newington[15] |
| Party |
Candidate |
Votes |
% |
±% |
|
Labour |
Alan Clark |
1,410 |
42.2 |
|
|
Liberal Democrat |
Damian Walker |
1,319 |
39.4 |
|
|
English Democrats |
Tineke Shayne Robinson |
317 |
9.5 |
|
|
Conservative |
Peter Lawrence Abraham |
298 |
8.9 |
|
| Majority |
91 |
2.7 |
|
| Turnout |
3,358 |
41.5 |
|
|
Labour gain from Liberal Democrat |
Swing |
|
|
Orchard Park & Greenwood
| Orchard Park & Greenwood[16] |
| Party |
Candidate |
Votes |
% |
±% |
|
Labour |
Terry Geraghty |
2,385 |
65.1 |
|
|
Liberal Democrat |
Chris Randall |
973 |
26.6 |
|
|
Conservative |
Matthew Jones |
306 |
8.4 |
|
| Majority |
1,412 |
38.1 |
|
| Turnout |
3,704 |
40.7 |
|
|
Labour hold |
Swing |
|
|
Pickering
| Pickering[17] |
| Party |
Candidate |
Votes |
% |
±% |
|
Liberal Democrat |
Abigail Bell |
2,022 |
42.7 |
|
|
Labour |
Leanne Fudge |
1,697 |
35.8 |
|
|
Conservative |
Matthew James Leonard |
508 |
10.7 |
|
|
BNP |
Jonathan Patrick Mainprize |
311 |
6.6 |
|
|
English Democrats |
Sharon Joan Mawer |
199 |
4.2 |
|
| Majority |
325 |
6.8 |
|
| Turnout |
4,750 |
52.5 |
|
|
Liberal Democrat hold |
Swing |
|
|
Southcoates East
| Southcoates East[18] |
| Party |
Candidate |
Votes |
% |
±% |
|
Labour |
David William Gemmell |
1,440 |
61.9 |
|
|
Liberal Democrat |
Mike Chambers |
551 |
23.7 |
|
|
Conservative |
Andrew Neil Forster |
336 |
14.4 |
|
| Majority |
889 |
37.8 |
|
| Turnout |
2,351 |
41.1 |
|
|
Labour hold |
Swing |
|
|
Southcoates West
| Southcoates West[19] |
| Party |
Candidate |
Votes |
% |
±% |
|
Labour |
Steve Brady |
1,803 |
62.6 |
|
|
Liberal Democrat |
Dale Webster |
462 |
16.0 |
|
|
Conservative |
John Crompton |
315 |
10.9 |
|
|
UKIP |
Michael Hookem |
302 |
10.5 |
|
| Majority |
1,341 |
46.4 |
|
| Turnout |
2,888 |
48.1 |
|
|
Labour hold |
Swing |
|
|
St Andrews
| St Andrews[20] |
| Party |
Candidate |
Votes |
% |
±% |
|
Labour |
Nadine Fudge |
1,038 |
56.9 |
|
|
Liberal Democrat |
Tracey Irene Henry |
316 |
17.3 |
|
|
English Democrats |
Peter Mawer |
274 |
15.0 |
|
|
Conservative |
Bob Cook |
197 |
10.8 |
|
| Majority |
722 |
39.4 |
|
| Turnout |
1,834 |
36.0 |
|
|
Labour hold |
Swing |
|
|
Sutton
| Sutton[21] |
| Party |
Candidate |
Votes |
% |
±% |
|
Liberal Democrat |
Terry Keal |
2,347 |
44.9 |
|
|
Labour |
Dave Craker |
2,212 |
42.3 |
|
|
Conservative |
Douglas Colin Percy |
670 |
12.8 |
|
| Majority |
135 |
2.6 |
|
| Turnout |
5,274 |
54.7 |
|
|
Liberal Democrat hold |
Swing |
|
|
University
| University[22] |
| Party |
Candidate |
Votes |
% |
±% |
|
Liberal Democrat |
Tom McEvoy |
1,603 |
47.4 |
|
|
Labour Co-op |
Joyce Irene Korczak Fields |
1,315 |
38.9 |
|
|
Conservative |
Sheila Gladys Airey |
463 |
13.7 |
|
| Majority |
288 |
8.4 |
|
| Turnout |
3,426 |
48.3 |
|
|
Liberal Democrat hold |
Swing |
|
|
References
|
|---|
| | East Riding of Yorkshire Council | |
|---|
| | Hull City Council | |
|---|
| | Humberside County Council |
- 1973
- 1977
- 1981
- 1985
- 1989
- 1993
- Abolished
|
|---|
| | Boothferry Borough Council |
- 1973
- 1976
- 1979
- 1983
- 1987
- 1991
- 1995
- Abolished
|
|---|
| | East Yorkshire Borough of Beverley Council |
- 1973
- 1976
- 1979
- 1983
- 1987
- 1991
- 1995
- Abolished
|
|---|
| | East Yorkshire District Council |
- 1973
- 1976
- 1979
- 1983
- 1987
- 1991
- 1995
- Abolished
|
|---|
| | Holderness Borough Council |
- 1973
- 1976
- 1979
- 1983
- 1987
- 1991
- 1995
- Abolished
|
|---|
| | East Riding County Council |
- 1889
- 1892
- 1895
- 1898
- 1901
- 1904
- 1907
- 1910
- 1913
- 1919
- 1922
- 1925
- 1928
- 1931
- 1934
- 1937
- 1946
- 1949
- 1952
- 1955
- 1958
- 1961
- 1964
- 1967
- 1970
- Abolished
|
|---|
|