Hull City Council election, 2006
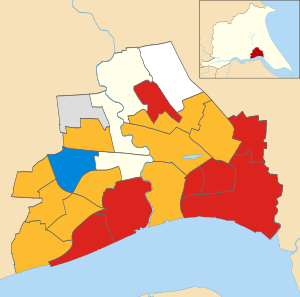
Map of the results of the 2006 Hull council election.
Labour in red, Liberal Democrats in yellow,
Conservatives in blue, Independent in grey, Hull Independents in white, Uncontested in cream.
The 2006 Hull City Council election took place on 4 May 2006 to elect members of Hull City Council in England. One third of the council was up for election and the council stayed under no overall control.[1] Overall turnout was 27.3%.[2]
Before the election in April 2006 the national Labour government removed their "statutory direction" of the council which had been put in place in 2003 after inspectors criticised the performance of the council.[3] The council was now described as having made adequate progress, but the opposition Liberal Democrats criticised the timing of the announcement during the campaign for the local elections.[3]
The results saw the Liberal Democrats become the largest party on the council after gaining 4 seats including defeating the Labour Lord Mayor, Bryan Bradley.[4] However immediately after the election they were not confident they would be able to get enough support from other parties to take control from Labour.[5] Following the election the 2 Liberal and 3 of the various independent councillors met with the Labour leader of the council to discuss supporting them as they preferred Labour to the Liberal Democrats.[6] However it was reported that regional Labour party officials told the party to go into opposition raising the possibility that neither party would form the administration.[7]
At the council meeting on 18 May the Liberal Democrats managed to get elected into power by one vote after receiving the support of 4 councillors from other groups, including the former Labour leader of the council Colin Inglis.[8] He had promised to oppose Labour forming the administration if 2 of the councillors who had been involved in removing him as leader were part of any Labour cabinet.[8]
After the election, the composition of the council was
Election result
| Hull Local Election Result 2006 |
| Party |
Seats |
Gains |
Losses |
Net gain/loss |
Seats % |
Votes % |
Votes |
+/− |
| |
Liberal Democrat |
10 |
4 |
0 |
+4 |
50.0 |
43.6 |
19,076 |
+6.2% |
| |
Labour |
7 |
0 |
2 |
-2 |
35.0 |
33.3 |
14,585 |
-1.0% |
| |
Conservative |
1 |
0 |
0 |
0 |
5.0 |
11.4 |
5,011 |
+0.2% |
| |
Hull Independents |
1 |
0 |
1 |
-1 |
5.0 |
4.4 |
1,908 |
+4.4% |
| |
Independent |
1 |
0 |
0 |
0 |
5.0 |
3.0 |
1,327 |
-3.9% |
| |
BNP |
0 |
0 |
0 |
0 |
0 |
2.5 |
1,108 |
+0.5% |
| |
Liberal |
0 |
0 |
1 |
-1 |
0 |
0.8 |
353 |
+0.8% |
| |
UKIP |
0 |
0 |
0 |
0 |
0 |
0.3 |
143 |
-6.8% |
| |
Legalise Cannabis |
0 |
0 |
0 |
0 |
0 |
0.2 |
103 |
+0.0% |
| |
Veritas |
0 |
0 |
0 |
0 |
0 |
0.2 |
102 |
+0.2% |
| |
Mums' Army |
0 |
0 |
0 |
0 |
0 |
0.2 |
69 |
+0.2% |
Ward results
| Avenue[2] |
| Party |
Candidate |
Votes |
% |
±% |
|
Liberal Democrat |
Simone Butterworth |
1,441 |
50.5 |
+3.9 |
|
Labour |
Graham Petrini |
690 |
24.2 |
+0.8 |
|
Conservative |
Basil Bulmer |
229 |
8.0 |
-2.5 |
|
Hull Independents |
Ginette Andrew |
210 |
7.4 |
+2.2 |
|
Independent |
Haris Livas-Dawes |
179 |
6.3 |
+6.3 |
|
Legalise Cannabis |
Carl Wagner |
103 |
3.6 |
+3.6 |
| Majority |
751 |
26.3 |
+3.1 |
| Turnout |
2,852 |
31.8 |
|
|
Liberal Democrat hold |
Swing |
|
|
| Boothferry[2] |
| Party |
Candidate |
Votes |
% |
±% |
|
Liberal Democrat |
Patricia Ellis |
1,626 |
57.6 |
+16.2 |
|
Labour |
Freda Longbottom |
716 |
25.4 |
-1.4 |
|
Conservative |
Karen Woods |
482 |
17.1 |
+2.7 |
| Majority |
910 |
32.2 |
+17.6 |
| Turnout |
2,824 |
29.7 |
|
|
Liberal Democrat hold |
Swing |
|
|
| Bransholme East[2] |
| Party |
Candidate |
Votes |
% |
±% |
|
Hull Independents |
Anita Harrison |
867 |
64.2 |
+23.9 |
|
Labour |
Daniel McIntyre |
291 |
21.5 |
-11.8 |
|
Liberal Democrat |
Maureen Bristow |
115 |
8.5 |
-12.0 |
|
Veritas |
Harold Nielson |
78 |
5.8 |
+5.8 |
| Majority |
576 |
42.7 |
+35.7 |
| Turnout |
1,351 |
22.4 |
|
|
Independent hold |
Swing |
|
|
| Bransholme West[2] |
| Party |
Candidate |
Votes |
% |
±% |
|
Labour |
Leonard Bird |
625 |
61.3 |
-7.9 |
|
Liberal Democrat |
Richard Welton |
394 |
38.7 |
+25.1 |
| Majority |
231 |
22.6 |
-33.0 |
| Turnout |
1,019 |
17.7 |
|
|
Labour hold |
Swing |
|
|
| Bricknell[2] |
| Party |
Candidate |
Votes |
% |
±% |
|
Conservative |
John Fareham |
1,607 |
65.7 |
+5.0 |
|
Labour |
Kay Vandebriele |
434 |
17.7 |
-3.6 |
|
Liberal Democrat |
Stuart Bell |
406 |
16.6 |
-1.4 |
| Majority |
1,173 |
48.0 |
+8.6 |
| Turnout |
2,447 |
38.7 |
|
|
Conservative hold |
Swing |
|
|
| Derringham[2] |
| Party |
Candidate |
Votes |
% |
±% |
|
Liberal Democrat |
Stephen Hull |
1,110 |
42.3 |
+33.3 |
|
Hull Independents |
Chris Jarvis |
831 |
31.7 |
+3.5 |
|
Labour |
Simon Kelsey |
436 |
16.6 |
-9.2 |
|
Conservative |
Peter Abraham |
153 |
5.8 |
-2.7 |
|
Liberal |
David Harris |
93 |
3.5 |
+3.5 |
| Majority |
279 |
10.6 |
|
| Turnout |
2,623 |
29.8 |
|
|
Liberal Democrat gain from Independent |
Swing |
|
|
| Drypool[2] |
| Party |
Candidate |
Votes |
% |
±% |
|
Liberal Democrat |
Andrew Sloan |
1,595 |
55.6 |
+15.6 |
|
Labour |
Jill Wareing |
1,050 |
36.6 |
+5.0 |
|
Conservative |
James Parker |
223 |
7.8 |
+2.0 |
| Majority |
545 |
19.0 |
+10.6 |
| Turnout |
2,868 |
30.4 |
|
|
Liberal Democrat gain from Liberal |
Swing |
|
|
| Holderness[2] |
| Party |
Candidate |
Votes |
% |
±% |
|
Liberal Democrat |
Stephen Baker |
1,967 |
64.9 |
+9.8 |
|
Labour |
Martin Mancey |
768 |
25.3 |
-7.1 |
|
Conservative |
Albert Greendale |
295 |
9.7 |
-2.7 |
| Majority |
1,199 |
39.6 |
+16.9 |
| Turnout |
3,030 |
30.3 |
|
|
Liberal Democrat hold |
Swing |
|
|
| Ings[2] |
| Party |
Candidate |
Votes |
% |
±% |
|
Liberal Democrat |
Mervyn Taylor |
2,017 |
61.0 |
+9.9 |
|
Labour |
Peter Clark |
997 |
30.1 |
-5.4 |
|
Conservative |
Andrew Clark |
224 |
6.8 |
-0.9 |
|
Independent |
John Reeve |
71 |
2.1 |
-3.7 |
| Majority |
1,020 |
30.9 |
+15.3 |
| Turnout |
3,309 |
34.0 |
|
|
Liberal Democrat gain from Labour |
Swing |
|
|
| Longhill[2] |
| Party |
Candidate |
Votes |
% |
±% |
|
Labour |
Alice Hewitt |
1,033 |
52.2 |
+1.7 |
|
Liberal Democrat |
Ann Godden |
614 |
31.0 |
+14.3 |
|
Conservative |
Robert Brown |
332 |
16.8 |
+6.5 |
| Majority |
419 |
21.2 |
-6.8 |
| Turnout |
1,979 |
23.1 |
|
|
Labour hold |
Swing |
|
|
| Marfleet[2] |
| Party |
Candidate |
Votes |
% |
±% |
|
Labour |
Sean Chaytor |
1,023 |
60.5 |
+0.8 |
|
Liberal Democrat |
Joseph Matthews |
452 |
26.7 |
+1.1 |
|
Conservative |
John Abbott |
217 |
12.8 |
+12.8 |
| Majority |
571 |
33.8 |
-0.3 |
| Turnout |
1,692 |
19.4 |
|
|
Labour hold |
Swing |
|
|
| Myton[2] |
| Party |
Candidate |
Votes |
% |
±% |
|
Labour |
Kenneth Branson |
1,103 |
52.3 |
+0.7 |
|
Liberal Democrat |
Brian Woodward |
413 |
19.6 |
+2.2 |
|
BNP |
Terry Symons |
342 |
16.2 |
+16.2 |
|
Conservative |
Colin Baxter |
252 |
11.9 |
+2.1 |
| Majority |
690 |
32.7 |
-1.5 |
| Turnout |
2,110 |
22.3 |
|
|
Labour hold |
Swing |
|
|
| Newington[2] |
| Party |
Candidate |
Votes |
% |
±% |
|
Liberal Democrat |
Damian Walker |
974 |
52.3 |
+35.3 |
|
Labour |
Bryan Bradley |
582 |
31.2 |
-5.3 |
|
BNP |
Jonathan Mainprize |
211 |
11.3 |
+11.3 |
|
Conservative |
David Thompson |
73 |
3.9 |
-6.2 |
|
Veritas |
Peter Mawer |
24 |
1.3 |
+1.3 |
| Majority |
392 |
21.1 |
|
| Turnout |
1,864 |
21.4 |
|
|
Liberal Democrat gain from Labour |
Swing |
|
|
| Orchard Park and Greenwood[2] |
| Party |
Candidate |
Votes |
% |
±% |
|
Independent |
Terence Geraghty |
1,077 |
52.6 |
+22.4 |
|
Labour |
Kathryn Nicholson |
716 |
35.0 |
-18.5 |
|
Liberal Democrat |
Angela Simpson |
157 |
7.7 |
-8.6 |
|
Conservative |
Ian Brown |
98 |
4.8 |
+4.8 |
| Majority |
361 |
17.6 |
|
| Turnout |
2,048 |
22.5 |
|
|
Independent hold |
Swing |
|
|
| Pickering[2] |
| Party |
Candidate |
Votes |
% |
±% |
|
Liberal Democrat |
Abigail Walker |
1,436 |
47.3 |
+16.5 |
|
Labour |
Alan Gardiner |
859 |
28.3 |
-5.5 |
|
BNP |
Edward Scott |
451 |
14.9 |
+2.2 |
|
Conservative |
Reginald Britton |
181 |
6.0 |
-3.6 |
|
Liberal |
Alan Monkman |
108 |
3.6 |
+3.6 |
| Majority |
577 |
19.0 |
|
| Turnout |
3,035 |
33.8 |
|
|
Liberal Democrat hold |
Swing |
|
|
| St Andrews[2] |
| Party |
Candidate |
Votes |
% |
±% |
|
Labour |
Nadine Fudge |
467 |
37.0 |
+12.4 |
|
Liberal Democrat |
Amanda Blexill |
419 |
33.2 |
-18.5 |
|
Liberal |
Patricia Penna |
152 |
12.0 |
+12.0 |
|
BNP |
Alan Siddle |
104 |
8.2 |
+8.2 |
|
Mums' Army |
Karen Rouse-Deane |
69 |
5.5 |
+5.5 |
|
Conservative |
Robert Cook |
51 |
4.0 |
-2.2 |
| Majority |
48 |
3.8 |
|
| Turnout |
1,262 |
23.8 |
|
|
Labour hold |
Swing |
|
|
| Southcoates East[2] |
| Party |
Candidate |
Votes |
% |
±% |
|
Labour |
David Gemmel |
573 |
55.4 |
-4.8 |
|
Liberal Democrat |
James Morrell |
213 |
20.6 |
+0.7 |
|
UKIP |
Christopher Goss |
143 |
13.8 |
+13.8 |
|
Conservative |
Douglas Percy |
106 |
10.2 |
+10.2 |
| Majority |
360 |
34.8 |
-5.5 |
| Turnout |
1,035 |
18.3 |
|
|
Labour hold |
Swing |
|
|
| Southcoates West[2] |
| Party |
Candidate |
Votes |
% |
±% |
|
Labour |
Stephen Brady |
824 |
49.8 |
+4.5 |
|
Liberal Democrat |
Martin Uzzell |
751 |
45.4 |
+2.3 |
|
Conservative |
Leslie Fisher |
79 |
4.8 |
-6.8 |
| Majority |
73 |
4.4 |
+2.2 |
| Turnout |
1,654 |
27.5 |
|
|
Labour hold |
Swing |
|
|
| Sutton[2] |
| Party |
Candidate |
Votes |
% |
±% |
|
Liberal Democrat |
Paul Hepton |
1,827 |
63.3 |
+5.8 |
|
Labour |
Elizabeth Noble |
807 |
27.9 |
+1.4 |
|
Conservative |
Sheila Airey |
254 |
8.8 |
+3.5 |
| Majority |
1,020 |
35.4 |
+4.4 |
| Turnout |
2,888 |
30.5 |
|
|
Liberal Democrat hold |
Swing |
|
|
| University[2] |
| Party |
Candidate |
Votes |
% |
±% |
|
Liberal Democrat |
Chris Randall |
1,149 |
60.6 |
+12.9 |
|
Labour |
Robert Silby |
591 |
31.2 |
-11.2 |
|
Conservative |
Gordon Dear |
155 |
8.2 |
+1.0 |
| Majority |
558 |
29.4 |
+24.1 |
| Turnout |
1,895 |
32.1 |
|
|
Liberal Democrat hold |
Swing |
|
|
No elections were held in Beverley, Kings Park and Newland wards.
References
|
|---|
| | East Riding of Yorkshire Council | |
|---|
| | Hull City Council | |
|---|
| | Humberside County Council |
- 1973
- 1977
- 1981
- 1985
- 1989
- 1993
- Abolished
|
|---|
| | Boothferry Borough Council |
- 1973
- 1976
- 1979
- 1983
- 1987
- 1991
- 1995
- Abolished
|
|---|
| | East Yorkshire Borough of Beverley Council |
- 1973
- 1976
- 1979
- 1983
- 1987
- 1991
- 1995
- Abolished
|
|---|
| | East Yorkshire District Council |
- 1973
- 1976
- 1979
- 1983
- 1987
- 1991
- 1995
- Abolished
|
|---|
| | Holderness Borough Council |
- 1973
- 1976
- 1979
- 1983
- 1987
- 1991
- 1995
- Abolished
|
|---|
| | East Riding County Council |
- 1889
- 1892
- 1895
- 1898
- 1901
- 1904
- 1907
- 1910
- 1913
- 1919
- 1922
- 1925
- 1928
- 1931
- 1934
- 1937
- 1946
- 1949
- 1952
- 1955
- 1958
- 1961
- 1964
- 1967
- 1970
- Abolished
|
|---|
|