Household income in the United States

Household income is an economic measure that can be applied to one household, or aggregated across a large group such as a county, city, or the whole country. It is commonly used by the United States government and private institutions to describe a household's economic status or to track economic trends in the US.
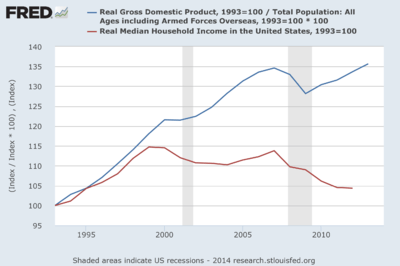
U.S. real (inflation adjusted) median household income was $51,939 in 2013 versus $51,759 in 2012, essentially unchanged. However, it has trended down since 2007, falling 8% from the pre-recession peak of $56,436. It remains below the 1999 record of $56,895. Household income is affected by a variety of factors, such as population aging and household composition.[1]
The distribution of household incomes has become more unequal during the post-2008 economic recovery, a first for the US but in line with the trend over the last ten economic recoveries since 1949.[2][3] Income inequality in the United States has grown from 2005 to 2012 in more than 2 out of 3 metropolitan areas.[4]
Definition
A household's income can be calculated various ways but the US Census as of 2009 measured it in the following manner: the income of every resident over the age of 15, including wages and salaries, unemployment insurance, disability payments, child support payments received, regular rental receipts, as well as any personal business, investment, or other kinds of income received routinely.[5]
The residents of the household do not have to be related to the head of the household for their earnings to be considered part of the household's income.[6] As households tend to share a similar economic context, the use of household income remains among the most widely accepted measures of income. That the size of a household is not commonly taken into account in such measures may distort any analysis of fluctuations within or among the household income categories, and may render direct comparisons between quintiles difficult or even impossible.[7]
Recent trends

The U.S. Census Bureau reported in September 2014 that:
- U.S. real (inflation adjusted) median household income was $51,939 in 2013 versus $51,759 in 2012, statistically unchanged.
- In 2013, real median household income was 8.0 percent lower than in 2007, the year before the latest recession.
- Real median household income averaged $50,781 from 1964-2013, ranging from a low of $43,558 in 1967 to a high of $56,895 in 1999.[1]
Commenting on the Census Bureau report, economist Ben Casselman wrote that U.S. median household income was "...9 percent lower than at its peak in 1999, and essentially unchanged since the end of the Reagan administration." The recovery from the 2007-2009 recession had not translated into higher incomes for the typical American family.[10]
Changes in median income reflect several trends: the aging of the population, changing patterns in work and schooling, and the evolving makeup of the American family, as well as long- and short-term trends in the economy itself. For instance, the retirement of the Baby Boom generation should push down overall median income, as more persons enter lower-income retirement. However, analysis of different working age groups indicate a similar pattern of stagnating median income as well.[10]
Journalist Annie Lowrey wrote in September 2014: "The root causes [of wage stagnation] include technological change, the decline of labor unions, and globalization, economists think, though they disagree sharply on how much to weight each factor. But foreign-produced goods became sharply cheaper, meaning imports climbed and production moved overseas. And computers took over for humans in many manufacturing, clerical, and administrative tasks, eroding middle-class jobs growth and suppressing wages."[11]
Another line of analysis, known as "total compensation," presents a more complete picture of real wages. The Kaiser Family Foundation conducted a study in 2013 which shows that employer contributions to employee healthcare costs went up 78% from 2003 to 2013.[12] The marketplace has made a trade-off: expanding benefits packages vs. increasing wages.
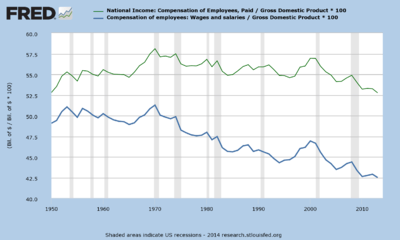
Measured relative to GDP, total compensation and its component wages and salaries have been declining since 1970. This indicates a shift in income from labor (persons who derive income from hourly wages and salaries) to capital (persons who derive income via ownership of businesses, land and assets). This trend is common across the developed world, due in part to globalization.[13] Wages and salaries have fallen from approximately 51% GDP in 1970 to 43% GDP in 2013. Total compensation has fallen from approximately 58% GDP in 1970 to 53% GDP in 2013.[14]
Uses
Use of individual household income: The government and organizations may look at one particular household's income to decide if a person is eligible for certain programs, such as nutrition assistance [15] or need-based financial aid,[16] among many others.
Use at the aggregate level: Summaries of household incomes across groups of people - often the entire country- are also studied as part of economic trends like standard of living and distribution of income and wealth. Household income as an economic measure can be represented as a median, a mean, a distribution, and other ways. Household income can be studied across time, region, education level, race/ethnicity, and many other dimensions. As an indicator of economic trends, it may be studied along with related economic measures such as disposable income, debt, household net worth (which includes debt and investments, durable goods like cars and houses), wealth, and employment statistics.
Median inflation-adjusted ("real") household income
Median inflation-adjusted ("real") household income generally increases and decreases with the business cycle, declining in each year during the periods 1979 through 1983, 1990 through 1993, 2000 through 2004 and 2008 through 2012, while rising in each of the intervening years.[17] Extreme poverty in the United States, meaning households living on less than $2 per day before government benefits, more than doubled from 636,000 to 1.46 million households (including 2.8 million children) between 1996 and 2011.[18]

Median household income over time
After 2010
The U.S. Census Bureau reported in September 2014 that:
- U.S. real (inflation adjusted) median household income was $51,939 in 2013 versus $51,759 in 2012, statistically unchanged. The 2011 level was $51,842 and the 2010 level was $52,646.
- In 2013, real median household income was 8.0% lower than the 2007 pre-recession level of $56,436.[1]

Before 2010
In 2006, the "real" (adjusted for inflation) median annual household income rose 1.3% to $50,233.00 according to the Census Bureau.[19] The real median earnings of men who worked full-time, year-round climbed between 2006 and 2007, from $43,460 to $45,113 (about 3.6 times minimum wage in 2006 to 3.7 times minimum wage in 2007). For women, the corresponding increase was from $33,437 to $35,102 (2.8 and 2.9 times minimum wage respectively). The median income per household member (including all working and non-working members above the age of 14) was $26,036 in 2006.[20]
In 2006, there were approximately 116,011,000 households in the United States. The percent of all households with annual incomes exceeding $250,000 was 1.93% .[21] About 12.3% fell below the federal poverty threshold[22] and the bottom 20% earned less than $19,178.[23] The aggregate income distribution is highly concentrated towards the top, with the top 6.37% earning roughly one third of all income, and those with upper-middle incomes controlling a large, though declining, share of the total earned income.[7][24]
Income inequality in the United States, which had decreased slowly after World War II until 1970, began to increase in the 1970s until reaching a peak in 2006. It declined a little in 2007.[25] Households in the top quintile (i.e., top 20%), 77% of which had two or more income earners, had incomes exceeding $91,705. Households in the mid quintile, most of which had one income earner per household, had incomes between $36,000 and $57,607. Households in the lowest quintile had incomes less than $19,178 and the majority had no income earner.[26]
The 2006 economic survey also found that households in the top two income quintiles, those with an annual household income exceeding $60,000, had a median of two income earners while those in the lower quintiles (2nd and middle quintile) had median of only one income earner per household. Overall, the United States followed the trend of other developed nations with a relatively large population of relatively affluent households outnumbering the poor. Among those in between the extremes of the income strata are a large number of households with moderately high middle class incomes[24] and an even larger number of households with moderately low incomes.[21]
While the median household income had increased 30% from 1990 to 2006, it has increased only slightly when considering inflation.[21] In 1990, the median annual household income was $30,056 or $44,603 in 2003 dollars. While personal income has remained relatively stagnant over the past few decades, household income has risen due to the rising percentage of households with two or more income earners. Between 1999 and 2004 household income stagnated showing a slight increase since 2004.[27][28]


Since 1966, the median household income in the United States has risen by 31%, fluctuating several times. The rise in household income is largely the result of an increase in personal income among college graduates, a group that has doubled in size since the 1960s, and women entering the labor force. Today, 42% of all households have two income earners. Household income increased dramatically faster for affluent households with income inequality having increased steadily since the 1970s.[31][32]
While household income has increased, its growth has been slowed by a decrease in married-couple households who tend to have two earners and, therefore, higher incomes. While the proportion of wives working year-round in married couple households with children has increased from 17% in 1967 to 39% in 1996, the proportion of such households among the general population has decreased. This means that the most economically prosperous type of household (married couples with two full-time earners) has been declining as a percentage of United States households.[33]
In 1969, more than 40% of all households consisted of a married couple with children. By 1996 only a rough quarter of US households consisted of married couples with children. As a result of these changing household demographics, median household income rose relatively slowly despite an ever-increasing female labor force and a considerable increase in the percentage of college graduates.[33]
| “ | "From 1969 to 1996, median household income rose a very modest 6.3 percent in constant dollars... The 1969 to 1996 stagnation in median household income may, in fact, be largely a reflection of changes in the size and composition of households rather than a reflection of a stagnating economy."- John McNeil, US Census Bureau | ” |
Overall, the median household income rose from $33,338 in 1967 to an all-time high of $44,922 in 1999, and has since decreased slightly to $43,318. Decreases in household income are visible during each recession, while increases are visible during economic upturns. These fluctuations were felt across the income strata as the incomes of both the 95th and 20th percentile were affected by fluctuations in the economy. Income in the period between 1967 and 1999 grew considerably faster among wealthier households than it did among poorer households.[29][33]
For example the household income for the 80th percentile, the lower threshold for the top quintile, rose from $55,265 in 1967 to $86,867 in 2003, a 57.2% increase. The median household income rose by 30% while the income for the 20th percentile (the lower threshold for the second lowest quintile) rose by only 28% from $14,002 to $17,984. As the majority of households in the top quintile had two income earners, versus zero for the lowest quintile and that the widening gap between the top and lowest quintile may largely be the reflection of changing household demographics including the addition of women to the workforce.[29][33]
Household demographics are not, however, the cause of the growing gap between the top 5% and the rest of the upper quintile. The top 5% had fewer dual earner households and full-time workers than the top quintile overall. In 2003 a household in the 95th percentile earned 77.2% more than a household in the 80th percentile, compared to 60.5% in 1967, a 27.6% increase in the earnings increase discrepancy between the two groups. Overall the income of the 95th percentile grew 15.2% faster than that of the 80th, 146.8% faster than that of the median and 159.9% faster than that of the 20th percentile.[34]
Households in the top 1% experienced the by far greatest increases in household income. According to economist Janet Yellen "the growth [in real income] was heavily concentrated at the very tip of the top, that is, the top 1 percent."[35] A 2006 analysis of IRS income data by economists Emmanuel Saez at the University of California, Berkeley and Thomas Piketty at the Paris School of Economics showed that the share of income held by the top 1% was as large in 2005 as in 1928. The data revealed that reported income increased by 9% in 2005, with the mean for the top 1% increasing by 14% and that for the bottom 90% dropping slightly by 0.6%.[36]
While per-capita disposable income has increased 469% since 1972, it has only increased moderately when inflation is considered. In 1972, disposable personal income was determined to be $4,129; $19,385 in 2005 dollars. In 2005, disposable personal income was, however, $27,640, a 43% increase.[37][38] Since the late 1990s, household income has fallen slightly.[39]
The following table shows the evolution of US household income at the 20th, 50th, 80th and 95th percentile from 1967 to 2011, in 2011 constant (CPI-U-RS adjusted) dollars.[40] The final column shows the average change per year from 1976 to 2011.
| Percentile | 2011 | 2009 | 2006 | 2003 | 2000 | 1997 | 1994 | 1991 | 1988 |
|---|---|---|---|---|---|---|---|---|---|
| 20th | $20,262 | $21,446 | $22,349 | $21,992 | $23,404 | $21,517 | $20,148 | $20,227 | $20,794 |
| 50th | $50,054 | $52,195 | $52,973 | $54,841 | $51,704 | $48,418 | $48,516 | $49,737 | |
| 80th | $101,582 | $104,857 | $108,239 | $106,228 | $106,790 | $99,900 | $94,304 | $91,407 | $92,427 |
| 95th | $186,000 | $188,744 | $194,111 | $188,470 | $189,665 | $176,817 | $164,806 | $155,246 | $156,454 |
| Percentile | 1985 | 1982 | 1979 | 1976 | 1973 | 1970 | 1967 | Per Year |
|---|---|---|---|---|---|---|---|---|
| 20th | $19,816 | $18,798 | $20,211 | $19,426 | $19,895 | $19,063 | $17,663 | .12% |
| 50th | $47,079 | $45,139 | $47,527 | $45,595 | NA | NA | NA | .27% |
| 80th | $86,867 | $81,456 | $83,730 | $79,322 | $81,498 | $75,783 | $69,710 | .71% |
| 95th | $143,530 | $134,461 | $135,296 | $125,794 | $130,989 | $119,792 | $111,866 | 1.12% |
The median household income in the United States was $51,939 as of 2013.[21] The median income divides households in the US evenly in the middle with half of all household earning more than the median income and half of all households earning less than the median household income. According to the US Census Bureau, the median is "considerably lower than the average, and provides a more accurate representation."[41]
Mean household income
Another common measurement of personal income is the mean household income. Unlike the median household income, which divides all households in two halves, the mean income is the average income earned by American households. In the case of mean income, the income of all households is divided by the number of all households.[42] The mean income is usually more affected by the relatively unequal distribution of income which tilts towards the top.[41] As a result, the mean tends to be higher than the median income, with the top earning households boosting it. Overall, the mean household income in the United States, according to the US Census Bureau 2014 Annual Social and Economic Supplement, was $72,641, or $20,702 (39.86%) higher than the median household income ($51,939).[43]
The US Census Bureau also provides a breakdown by self-identified ethnic groups as follows (as of March 2014):
| Ethnic Category | Mean Household Income |
|---|---|
| Asian alone | $90,752 |
| White alone | $79,340 |
| Hispanic or Latino | $54,644 |
| Black | $49,629 |
Mean vs. median household income
Median income is the amount which divides the income distribution into two equal groups, half having income above that amount, and half having income below that amount. Mean income (average) is the amount obtained by dividing the total aggregate income of a group by the number of units in that group. The means and medians for households and families are based on all households and families. Means and medians for people are based on people 15 years old and over with income.— US Census Bureau, Frequently Asked Question, published by First Gov.[42]
Aggregate income distribution
The aggregate income measures the combined income earned by all persons in a particular income group. In 2007, all households in the United States earned roughly $7.723 trillion.[44] One half, 49.98%, of all income in the US was earned by households with an income over $100,000, the top twenty percent. Over one quarter, 28.5%, of all income was earned by the top 8%, those households earning more than $150,000 a year. The top 3.65%, with incomes over $200,000, earned 17.5%. Households with annual incomes from $50,000 to $75,000, 18.2% of households, earned 16.5% of all income. Households with annual incomes from $50,000 to $95,000, 28.1% of households, earned 28.8% of all income. The bottom 10.3% earned 1.06% of all income.
Household income and demographics
Racial and ethnic groups

Despite advances minorities have made to exit poverty, there is still an uneven racial distribution among the income quintiles. While White Americans made up roughly 75.1% of all persons in 2000,[45] 87.93% of all households in the top 5% were headed by a person who identified as being White alone. Only 4.75% of all household in the top 5% were headed by someone who identified him or herself as being Hispanic or Latino of any race,[46] versus 12.5% of persons identifying themselves as Hispanic or Latino in the general population.[45]
Overall, 86.01% of all households in the top two quintiles with upper-middle range incomes of over $55,331 were headed by a head of household who identified him or herself as White alone, while only 7.21% were being headed by someone who identified as being Hispanic and 7.37% by someone who identified as being African American or Black.[46] Overall, households headed by Hispanics and African Americans were underrepresented in the top two quintiles and overrepresented in the bottom two quintiles. Households headed by persons who identified as being Asian alone, on the other hand, were overrepresented among the top two quintiles. In the top five percent the percentage of Asians was nearly twice as high as the percentage of Asians among the general population. Whites were relatively even distributed throughout the quintiles only being underrepresented in the lowest quintile and slightly overrepresented in the top quintile and the top five percent.[46]
In terms of race in 2010 data, Asian American households had the highest median household income of $57,518, European-American households ranked second with $48,977, Hispanic or Latino households ranked third with $34,241. African-American or Black households had the lowest median household income of all races with $30,134.[47]
| Ethnic group | All households | Lowest fifth | Second fifth | Middle fifth | Fourth fifth | Highest fifth | Top 5% | |
|---|---|---|---|---|---|---|---|---|
| White alone | Number in 1000s | 92,702 | 16,940 | 18,424 | 18,978 | 19,215 | 19,721 | 5,029 |
| Percentage | 81.93% | 74.87% | 81.42% | 83.87% | 84.92% | 87.16% | 87.93% | |
| Asian alone | Number in 1000s | 4,140 | 624 | 593 | 786 | 871 | 1,265 | 366 |
| Percentage | 3.65% | 2.76% | 2.26% | 3.47% | 3.84% | 5.59% | 6.46% | |
| Black | Number in 1000s | 13,792 | 4,474 | 3,339 | 2,637 | 2,053 | 1,287 | 236 |
| Percentage | 12.19% | 19.77% | 14.75% | 11.65% | 9.07% | 5.69% | 4.17% | |
| Hispanic or Latino (of any race) | Number in 1000s | 12,838 | 3,023 | 3,130 | 2,863 | 1,931 | 1,204 | 269 |
| Percentage | 11.33% | 13.56% | 13.83% | 12.20% | 8.53% | 5.89% | 4.75% | |
SOURCE: US Census Bureau, 2004[46]
Education and gender

Household income as well as per capita income in the United States rise significantly as the educational attainment increases.[49] In 2005 graduates with a Master's in Business Administration (MBA) who accepted job offers were expected to earn a base salary of $88,626. They were also expected to receive an "average signing bonus of $17,428."[50]
According to the US Census Bureau persons with doctorates in the United States had an average income of roughly $81,400. The average for an advanced degree was $72,824 with men averaging $90,761 and women averaging $50,756 annually. Year-round full-time workers with a professional degree had an average income of $109,600 while those with a Master's degree had an average income of $62,300. Overall, "…[a]verage earnings ranged from $18,900 for high school dropouts to $25,900 for high school graduates, $45,400 for college graduates and $99,300 for workers with professional degrees (M.D., D.P.T., D.P.M., D.O., J.D., Pharm.D., D.D.S., or D.V.M.).[51]
Considering how education significantly enhances the earnings potential of individuals, it should come as no surprise that individuals with graduate degrees have an average per capita income exceeding the median household income of married couple families among the general population ($63,813 annually).[51][52] Higher educational attainment did not, however, help close the income gap between the genders as the life-time earnings for a male with a professional degree were roughly forty percent (39.59%) higher than those of a female with a professional degree. The lifetime earnings gap between males and females was the smallest for those individuals holding an Associate degrees with male life-time earnings being 27.77% higher than those of females. While educational attainment did not help reduce the income inequality between men and women, it did increase the earnings potential of individuals of both sexes, enabling many households with one or more graduate degree householders to enter the top household income quintile.[51]
Household income also increased significantly with the educational attainment of the householder. The US Census Bureau publishes educational attainment and income data for all households with a householder who was aged twenty-five or older. The biggest income difference was between those with some college education and those who had a Bachelor's degree, with the latter making $23,874 more annually. Income also increased substantially with increased post-secondary education. While the median annual household income for a household with a householder having an Associate degree was $51,970, the median annual household income for householders with a Bachelor's degree or higher was $73,446. Those with doctorates had the second highest median household with a median of $96,830; $18,289 more than that for those at the Master's degree level, but $3,170 lower than the median for households with a professional degree holding householder.[48]
| Criteria | Overall | Less than 9th grade | Some high school | High school graduate | Some college | Associate degree | Bachelor's degree | Bachelor's degree or more | Master's degree | Professional degree | Doctoral degree | |
|---|---|---|---|---|---|---|---|---|---|---|---|---|
| Median annual individual income | Male, age 25+ | $33,517 | $15,461 | $18,990 | $28,763 | $35,073 | $39,015 | $50,916 | $55,751 | $61,698 | $88,530 | $73,853 |
| Female, age 25+ | $19,679 | $9,296 | $10,786 | $15,962 | $21,007 | $24,808 | $31,309 | $35,125 | $41,334 | $48,536 | $53,003 | |
| Both sexes, age 25+ | $32,140 | $17,422 | $20,321 | $26,505 | $31,054 | $35,009 | $43,143 | $49,303 | $52,390 | $82,473 | $70,853 | |
| Median annual household income | $45,016 | $18,787 | $22,718 | $36,835 | $45,854 | $51,970 | $68,728 | $73,446 | $78,541 | $100,000 | $96,830 | |
SOURCE: US Census Bureau, 2003[48][53]

The change in median personal and household since 1991 also varied greatly with educational attainment. The following table shows the median household income according to the educational attainment of the householder. All data is in 2003 dollars and only applies to householders whose householder is aged twenty-five or older. The highest and lowest points of the median household income are presented in bold face.[48][53] Since 2003, median income has continued to rise for the nation as a whole, with the biggest gains going to those with Associate degrees, Bachelor's Degree or More, and Master's Degrees. High-school dropouts fared worse with negative growth.
| Year | Overall Median | Less than 9th grade | Some high school | High school graduate | Some college | Associate degree | Bachelor's degree | Bachelor's degree or more | Master's degree | Professional degree | Doctoral degree |
|---|---|---|---|---|---|---|---|---|---|---|---|
| 1991 | $40,873 | $17,414 | $23,096 | $37,520 | $46,296 | $52,289 | $64,150 | $68,845 | $72,669 | $102,667 | $92,614 |
| 1993 | $40,324 | $17,450 | $22,523 | $35,979 | $44,153 | $49,622 | $64,537 | $70,349 | $75,645 | $109,900 | $93,712 |
| 1995 | $42,235 | $18,031 | $21,933 | $37,609 | $44,537 | $50,485 | $63,357 | $69,584 | $77,865 | $98,302 | $95,899 |
| 1997 | $43,648 | $17,762 | $22,688 | $38,607 | $45,734 | $51,726 | $67,487 | $72,338 | $77,850 | $105,409 | $99,699 |
| 1999 | $46,236 | $19,008 | $23,977 | $39,322 | $48,588 | $54,282 | $70,925 | $76,958 | $82,097 | $110,383 | $107,217 |
| 2001 | $42,900 | $18,830 | $24,162 | $37,468 | $47,605 | $53,166 | $69,796 | $75,116 | $81,993 | $103,918 | $96,442 |
| 2003 | $45,016 | $18,787 | $22,718 | $36,835 | $45,854 | $56,970 | $68,728 | $73,446 | $78,541 | $100,000 | $96,830 |
| Average | $43,376 | $18,183 | $23,013 | $37,620 | $46,109 | $51,934 | $66,997 | $72,376 | $78,094 | $104,368 | $94,487 |
SOURCE: US Census Bureau, 2003[48]
Age of householder
Household income in the United States varies substantially with the age of the person who heads the household. Overall, the median household income increased with the age of householder until retirement age when household income started to decline.[54] The highest median household income was found among households headed by working baby-boomers.[54]
Households headed by persons between the ages of 45 and 54 had a median household income of $61,111 and a mean household income of $77,634. The median income per member of household for this particular group was $27,924. The highest median income per member of household was among those between the ages of 54 and 64 with $30,544 [The reason this figure is lower than the next group is because Pensions and Social Security add to income while a portion of older individuals also have work-related income.].[54]
The group with the second highest median household income, were households headed by persons between the ages 35 and 44 with a median income of $56,785, followed by those in the age group between 55 and 64 with $50,400. Not surprisingly the lowest income group was composed of those households headed by individuals younger than 24, followed by those headed by persons over the age of 75. Overall, households headed by persons above the age of seventy-five had a median household income of $20,467 with the median household income per member of household being $18,645. These figures support the general assumption that median household income as well as the median income per member of household peaked among those households headed by middle aged persons, increasing with the age of the householder and the size of the household until the householder reaches the age of 64. With retirement income replacing salaries and the size of the household declining, the median household income decreases as well.[54]
Household size
While median household income has a tendency to increase up to four persons per household, it declines for households beyond four persons. According to the US Census Bureau 2004 Community Survey, two-person households had a median income of $39,755, with $48,957 for three-person households, $54,338 for four-person households, $50,905 for five-person households, $45,435 for six-person households, with seven-or-more-person households having the second lowest median income of only $42,471.[55]
Geography
Considering other racial and geographical differences in regards to household income, it should come as no surprise that the median household income varies with race, size of household and geography. The state with the highest median household income in the United States as of the US Census Bureau 2009 is Maryland with $69,272, followed by New Jersey, Connecticut and Alaska, making the Northeastern United States the wealthiest area by income in the entire country.[56]
Regionally, in 2010, the Northeast reached a median income of $53,283, the West, $53,142, the South, $45,492, and the Midwest, $48,445.[57] Each figure represents a decline from the previous year.
Income by state
In 2010, the median household income by state ranged from $35,693 in Mississippi to $66,334 in Maryland. California, with the highest median home price in the nation[58] and home prices that far outpaced incomes,[59] only ranked ninth with a median household income of $61,021.[60] While California's median income was not near enough to afford the average California home or even a starter home, West Virginia, which had one of the nation's lowest median household incomes, also had the nation's lowest median home price.[58][60]
By Census Bureau Region, of the 15 states with the highest median household income, only Minnesota is located in the Mid-West, while five are in the Northeast (New Jersey, Connecticut, Massachusetts, New Hampshire and New York) three are in the South (Delaware, Maryland and Virginia), and the other six (Alaska, Hawaii, California, Washington, Colorado and Utah) are in the West.
The southern states had, on average, the lowest median household income, with nine of the country's fifteen poorest states located in the South. However, most of the poverty in the South is located in rural areas. Metropolitan areas such as Atlanta, Nashville, Charlotte, Raleigh, Richmond, Birmingham, Dallas, Houston, and Miami are areas within the southern states that have above average income levels. Overall, median household income tended to be the highest in the nation's most urbanized northeastern, upper midwestern and west coast states, while rural areas, mostly in the southern and mountain states (like New Mexico, Montana and Idaho), had the lowest median household income.[60]
Median Household Income by State[61]
| Rank | State | 2009 | 2008 | 2007 | 2004–2006 | Cost of Living Index[62] | 2009 Data adjusted for COL base period |
|---|---|---|---|---|---|---|---|
| 1 | Maryland | $69,272 | $70,545 | $68,080 | $62,372 | 124.81 | $55,502 |
| 2 | New Jersey | $68,342 | $70,378 | $67,035 | $64,169 | 128.47 | $53,197 |
| 3 | Connecticut | $67,034 | $68,595 | $65,967 | $59,972 | 130.22 | $51,477 |
| 4 | Alaska | $66,953 | $68,460 | $64,333 | $57,639 | 132.64 | $50,477 |
| 5 | Hawaii | $64,098 | $67,214 | $63,746 | $60,681 | 165.56 | $38,716 |
| 6 | Massachusetts | $64,081 | $65,401 | $62,365 | $56,236 | 117.8 | $54,398 |
| 7 | New Hampshire | $60,567 | $63,731 | $62,369 | $60,489 | 116.68 | $51,909 |
| 8 | Virginia | $59,330 | $61,233 | $59,562 | $55,108 | 97.66 | $60,752 |
| District of Columbia | $59,290 | $57,936 | $54,317 | $47,221 (2005)[63] | 139.92 | $42,374 | |
| 9 | California | $58,931 | $61,021 | $59,948 | $53,770 | 132.56 | $44,456 |
| 10 | Delaware | $56,860 | $57,989 | $54,610 | $52,214 | 102.4 | $55,527 |
| 11 | Washington | $56,548 | $58,078 | $55,591 | $53,439 | 103.98 | $54,384 |
| 12 | Minnesota | $55,616 | $57,288 | $55,082 | $57,363 | 102.23 | $54,403 |
| 13 | Colorado | $55,430 | $56,993 | $55,212 | $54,039 | 102.23 | $54,221 |
| 14 | Utah | $55,117 | $56,633 | $55,109 | $55,179 | 95.15 | $57,926 |
| 15 | New York | $54,659 | $56,033 | $53,514 | $48,201 | 128.29 | $42,606 |
| 16 | Rhode Island | $54,119 | $55,701 | $53,568 | $52,003 | 123.25 | $43,910 |
| 17 | Illinois | $53,966 | $56,235 | $54,124 | $49,280 | 96.08 | $56,168 |
| 18 | Nevada | $53,341 | $56,361 | $55,062 | $50,819 | 101.39 | $52,610 |
| 19 | Wyoming | $52,664 | $53,207 | $51,731 | $47,227 | 98.66 | $53,379 |
| 20 | Vermont | $51,618 | $52,104 | $49,907 | $51,622 | 120.38 | $42,879 |
| United States | $50,221 | $52,029 | $50,740 | $46,242 (2005)[63] | |||
| 21 | Wisconsin | $49,993 | $52,094 | $50,578 | $48,874 | 96.45 | $51,833 |
| 22 | Pennsylvania | $49,520 | $50,713 | $48,576 | $47,791 | 100.67 | $49,190 |
| 23 | Arizona | $48,745 | $50,958 | $49,889 | $46,729 | 103.73 | $46,992 |
| 24 | Oregon | $48,457 | $50,169 | $48,730 | $45,485 | 110.47 | $43,864 |
| 25 | Texas | $48,259 | $50,043 | $47,548 | $43,425 | 91.04 | $53,009 |
| 26 | Iowa | $48,044 | $48,980 | $47,292 | $47,489 | 93.98 | $51,122 |
| 27 | North Dakota | $47,827 | $45,685 | $43,753 | $43,753 | 95.91 | $49,867 |
| 28 | Kansas | $47,817 | $50,177 | $47,451 | $44,264 | 91.31 | $52,368 |
| 29 | Georgia | $47,590 | $50,861 | $49,136 | $46,841 | 92.21 | $51,610 |
| 30 | Nebraska | $47,357 | $49,693 | $47,085 | $48,126 | 91.09 | $51,989 |
| 31 | Maine | $45,734 | $46,581 | $45,888 | $45,040 | 116.42 | $39,284 |
| 32 | Indiana | $45,424 | $47,966 | $47,448 | $44,806 | 94.19 | $48,226 |
| 33 | Ohio | $45,395 | $47,988 | $46,597 | $45,837 | 93.85 | $48,370 |
| 34 | Michigan | $45,255 | $48,591 | $47,950 | $47,064 | 95.25 | $47,512 |
| 35 | Missouri | $45,229 | $46,867 | $45,114 | $44,651 | 91.66 | $49,344 |
| 36 | South Dakota | $45,043 | $46,032 | $43,424 | $44,624 | 98.53 | $45,715 |
| 37 | Idaho | $44,926 | $47,576 | $46,253 | $46,395 | 93.04 | $48,287 |
| 38 | Florida | $44,736 | $47,778 | $47,804 | $44,448 | 98.39 | $45,468 |
| 39 | South Carolina | $44,625 | $43,329 | $40,822 | 98.71 | $42,997 | |
| 40 | North Carolina | $43,674 | $46,549 | $44,670 | $42,061 | 96.21 | $45,394 |
| 41 | New Mexico | $43,028 | $43,508 | $41,452 | $40,827 | 98.88 | $43,515 |
| 42 | Louisiana | $42,492 | $43,733 | $40,926 | $37,943 | 96.15 | $44,193 |
| 43 | Montana | $42,322 | $43,654 | $43,531 | $38,629 | 100 | $42,322 |
| 44 | Tennessee | $41,725 | $43,614 | $42,367 | $40,676 | 89.49 | $46,625 |
| 45 | Oklahoma | $41,664 | $42,822 | $41,567 | $40,001 | 90.09 | $46,247 |
| 46 | Alabama | $40,489 | $42,666 | $40,554 | $38,473 | 92.74 | $43,659 |
| 47 | Kentucky | $40,072 | $41,538 | $40,267 | $38,466 | 89.21 | $44,919 |
| 48 | Arkansas | $40,489 | $41,393 | $42,229 | $41,679 | 90.61 | $41,743 |
| 49 | West Virginia | $37,435 | $37,989 | $37,060 | $37,227 | 94.4 | $39,656 |
| 50 | Mississippi | $36,646 | $37,790 | $36,338 | $35,261 | 92.26 | $39,720 |
Social class
Household income is one of the most commonly used measures of income and, therefore, also one of the most prominent indicators of social class. Household income and education do not, however, always reflect perceived class status correctly. Sociologist Dennis Gilbert acknowledges that "... the class structure... does not exactly match the distribution of household income" with "the mismatch [being] greatest in the middle..." (Gilbert, 1998: 92) As social classes commonly overlap, it is not possible to define exact class boundaries.
According to Leonard Beeghley a household income of roughly $95,000 would be typical of a dual-earner middle class household while $60,000 would be typical of a dual-earner working class household and $18,000 typical for an impoverished household. William Thompson and Joseph Hickey see common incomes for the upper class as those exceeding $500,000 with upper middle class incomes ranging from the high 5-figures to most commonly in excess of $100,000. They claim the lower middle class ranges from $35,000 to $75,000; $16,000 to $30,000 for the working class and less than $2,000 for the lower class.
| Dennis Gilbert, 2002 | William Thompson & Joseph Hickey, 2005 | Leonard Beeghley, 2004 | |||
|---|---|---|---|---|---|
| Class | Typical characteristics | Class | Typical characteristics | Class | Typical characteristics |
| Capitalist class (1%) | Top-level executives, high-rung politicians, heirs. Ivy League education common. | Upper class (1%) | Top-level executives, celebrities, heirs; income of $500,000+ common. Ivy league education common. | The super-rich (0.9%) | Multi-millionaires whose incomes commonly exceed $350,000; includes celebrities and powerful executives/politicians. Ivy League education common. |
| Upper middle class[1] (15%) | Highly-educated (often with graduate degrees), most commonly salaried, professionals and middle management with large work autonomy. | Upper middle class[1] (15%) | Highly-educated (often with graduate degrees) professionals & managers with household incomes varying from the high 5-figure range to commonly above $100,000. | The Rich (5%) | Households with net worth of $1 million or more; largely in the form of home equity. Generally have college degrees. |
| Middle class (plurality/ majority?; ca. 46%) |
College-educated workers with considerably higher-than-average incomes and compensation; a man making $57,000 and a woman making $40,000 may be typical. | ||||
| Lower middle class (30%) | Semi-professionals and craftsmen with a roughly average standard of living. Most have some college education and are white-collar. | Lower middle class (32%) | Semi-professionals and craftsmen with some work autonomy; household incomes commonly range from $35,000 to $75,000. Typically, some college education. | ||
| Working class (30%) | Clerical and most blue-collar workers whose work is highly routinized. Standard of living varies depending on number of income earners, but is commonly just adequate. High school education. | ||||
| Working class (32%) | Clerical, pink- and blue-collar workers with often low job security; common household incomes range from $16,000 to $30,000. High school education. | Working class (ca. 40–45%) |
Blue-collar workers and those whose jobs are highly routinized with low economic security; a man making $40,000 and a woman making $26,000 may be typical. High school education. | ||
| Working poor (13%) | Service, low-rung clerical and some blue-collar workers. High economic insecurity and risk of poverty. Some high school education. | ||||
| Lower class (ca. 14–20%) | Those who occupy poorly-paid positions or rely on government transfers. Some high school education. | ||||
| Underclass (12%) | Those with limited or no participation in the labor force. Reliant on government transfers. Some high school education. | The poor (ca. 12%) | Those living below the poverty line with limited to no participation in the labor force; a household income of $18,000 may be typical. Some high school education. | ||
| |||||
Distribution of household income
Distribution of household income in 2010 according to US Census data


| Income range | Households (thousands) |
Percent | Percentile | Mean number of earners |
Mean house- hold size |
|---|---|---|---|---|---|
| Under $5,000 | 4,261 | 3.52% | 0.23 | 2.02 | |
| $5,000 to $9,999 | 4,972 | 4.11% | 3.52% | 0.36 | 1.81 |
| $10,000 to $14,999 | 7,127 | 5.89% | 7.63% | 0.42 | 1.74 |
| $15,000 to $19,999 | 6,882 | 5.68% | 13.51% | 0.57 | 1.96 |
| $20,000 to $24,999 | 7,095 | 5.86% | 19.19% | 0.75 | 2.14 |
| $25,000 to $29,999 | 6,591 | 5.44% | 25.05% | 0.85 | 2.22 |
| $30,000 to $34,999 | 6,667 | 5.51% | 30.50% | 0.97 | 2.34 |
| $35,000 to $39,999 | 6,136 | 5.07% | 36.00% | 1.06 | 2.41 |
| $40,000 to $44,999 | 5,795 | 4.79% | 41.07% | 1.20 | 2.46 |
| $45,000 to $49,999 | 4,945 | 4.08% | 45.86% | 1.32 | 2.55 |
| $50,000 to $54,999 | 5,170 | 4.27% | 49.94% | 1.32 | 2.52 |
| $55,000 to $59,999 | 4,250 | 3.51% | 54.21% | 1.49 | 2.72 |
| $60,000 to $64,999 | 4,432 | 3.66% | 57.72% | 1.49 | 2.66 |
| $65,000 to $69,999 | 3,836 | 3.17% | 61.38% | 1.58 | 2.75 |
| $70,000 to $74,999 | 3,606 | 2.98% | 64.55% | 1.63 | 2.82 |
| $75,000 to $79,999 | 3,452 | 2.85% | 67.53% | 1.70 | 2.89 |
| $80,000 to $84,999 | 3,036 | 2.51% | 70.38% | 1.73 | 2.86 |
| $85,000 to $89,999 | 2,566 | 2.12% | 72.89% | 1.80 | 3.00 |
| $90,000 to $94,999 | 2,594 | 2.14% | 75.00% | 1.79 | 2.96 |
| $95,000 to $99,999 | 2,251 | 1.86% | 77.15% | 1.87 | 3.09 |
| $100,000 to $104,999 | 2,527 | 2.09% | 79.01% | 1.78 | 2.94 |
| $105,000 to $109,999 | 1,771 | 1.46% | 81.09% | 2.01 | 3.18 |
| $110,000 to $114,999 | 1,723 | 1.42% | 82.56% | 1.96 | 3.11 |
| $115,000 to $119,999 | 1,569 | 1.30% | 83.98% | 1.98 | 3.06 |
| $120,000 to $124,999 | 1,540 | 1.27% | 85.27% | 2.01 | 3.16 |
| $125,000 to $129,999 | 1,258 | 1.04% | 86.55% | 1.97 | 3.08 |
| $130,000 to $134,999 | 1,211 | 1.00% | 87.59% | 2.00 | 3.17 |
| $135,000 to $139,999 | 918 | 0.76% | 88.59% | 2.10 | 3.18 |
| $140,000 to $144,999 | 1,031 | 0.85% | 89.34% | 2.12 | 3.26 |
| $145,000 to $149,999 | 893 | 0.74% | 90.20% | 2.11 | 3.21 |
| $150,000 to $154,999 | 1,166 | 0.96% | 90.93% | 1.86 | 3.09 |
| $155,000 to $159,999 | 740 | 0.61% | 91.90% | 2.04 | 3.11 |
| $160,000 to $164,999 | 697 | 0.58% | 92.51% | 2.05 | 3.29 |
| $165,000 to $169,999 | 610 | 0.50% | 93.08% | 2.15 | 3.17 |
| $170,000 to $174,999 | 617 | 0.51% | 93.59% | 1.99 | 3.05 |
| $175,000 to $179,999 | 530 | 0.44% | 94.10% | 2.09 | 3.08 |
| $180,000 to $184,999 | 460 | 0.38% | 94.53% | 2.12 | 3.28 |
| $185,000 to $189,999 | 363 | 0.30% | 94.91% | 2.30 | 3.32 |
| $190,000 to $194,999 | 380 | 0.31% | 95.21% | 2.22 | 3.17 |
| $195,000 to $199,999 | 312 | 0.26% | 95.53% | 2.30 | 3.28 |
| $200,000 to $249,999 | 2,297 | 1.90% | 95.78% | 2.06 | 3.24 |
| $250,000 and over | 2,808 | 2.32% | 97.68% | ca. 2 | ca. 3 |
| Total | 121,084 |
SOURCE: US Census Bureau; Income, Poverty, and Health Insurance Coverage in the United States: 2011[64]
Pre-2010 data on household income distribution
- Family Income
-
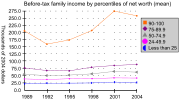
Before-tax U.S. family income distribution 1989–2004 (mean)
-

Before-tax U.S. family income distribution 1989–2004 (median)
-

U.S. income distribution 1947–2007
-
U.S. income distribution 1967–2003
- Percent change in family gross income
-

Change in mean before-tax U.S. family income (1989–2004)
-

Change in median before-tax U.S. family income (1989–2004)
| 1989 | 1992 | 1995 | 1998 | 2001 | 2004 | |
|---|---|---|---|---|---|---|
| 90–100 | 205.1 | 158.5 | 172.8 | 206.3 | 272.7 | 256.2 |
| 75–89.9 | 74.6 | 67.0 | 65.0 | 78.3 | 83.7 | 87.9 |
| 50–74.9 | 52.9 | 48.1 | 50.1 | 54.3 | 62.7 | 60.6 |
| 25–49.9 | 36.9 | 36.4 | 38.6 | 39.3 | 42.1 | 42.2 |
| 0–24.9 | 21.5 | 22.9 | 22.9 | 23.6 | 25.6 | 25.1 |
| 1989 | 1992 | 1995 | 1998 | 2001 | 2004 | |
|---|---|---|---|---|---|---|
| 90–100 | 114.7 | 106.6 | 99.1 | 102.4 | 134.7 | 143.8 |
| 75–89.9 | 61.2 | 56.7 | 52.6 | 65.8 | 74.1 | 77.0 |
| 50–74.9 | 46.3 | 43.2 | 43.6 | 47.0 | 54.4 | 52.4 |
| 25–49.9 | 32.3 | 32.2 | 35.3 | 35.3 | 37.2 | 37.0 |
| 0–24.9 | 15.3 | 17.2 | 17.8 | 18.5 | 21.0 | 20.5 |
Quintiles
Households are often divided into quintiles according to their gross income. Each quintile represents 20%, or one fifth, of all households.
Household type is strongly correlated with household income. Married couples are disproportionately represented in the upper two quintiles, compared to the general population of households. Cross-referencing shows that this is likely due to the presence of multiple income earners in these families. Non-family households (individuals) are disproportionately represented in the lower two quintiles. Households headed by single males are disproportionately found in the middle three quintiles; single females head households concentrated in the bottom three quintiles.
The highest income households are almost ten times as likely to own their homes rather than rent, but in the lowest quintile, the ratio of owners to renters is nearly one to one.
The New York Times has used the quintiles to define class. It has assigned the quintiles from lowest to highest as bottom fifth, lower middle, middle, upper middle, and top fifth.[65]
| Data | All households | Lowest fifth | Second fifth | Middle fifth | Fourth fifth | Highest fifth | Top 5% |
|---|---|---|---|---|---|---|---|
| Households (in 1000s) | 121,084 | 24,217 | 24,217 | 24,217 | 24,217 | 24,217 | 6,057 |
| Lower limit | $0 | $0 | $20,260 | $38,515 | $62,434 | $101,577 | $186,000 |
| Mean number of income earners | 1.3 | 0.4 | 0.9 | 1.3 | 1.7 | 2.0 | 2.1 |
| Tenure | |||||||
| Owner occupied | 65.4% | 42.5% | 55.6% | 65.2% | 76.7% | 87.0% | 90.1% |
| Renter occupied | 33.2% | 54.7% | 42.7% | 33.7% | 22.5% | 12.6% | 9.5% |
| Occupier paid no cash rent | 1.4% | 2.8% | 1.7% | 1.1% | 0.8% | 0.5% | 0.4% |
| Type of household | |||||||
| Family households | 66.5% | 40.1% | 58.4% | 68.3% | 78.8% | 86.8% | 88.2% |
| Non-family households | 33.5% | 59.8% | 41.6% | 31.7% | 21.2% | 13.2% | 11.8% |
| Breakdown of family households | |||||||
| Married couple families | 48.7% | 16.7% | 35.8% | 48.3% | 64.5% | 78.2% | 82.2% |
| Single-male family | 4.9% | 3.9% | 5.6% | 5.9% | 5.4% | 3.5% | 2.4% |
| Single-female family | 12.9% | 19.5% | 17.0% | 14.1% | 9.0% | 5.2% | 3.6% |
SOURCE: US Census Bureau; Income, Poverty, and Health Insurance Coverage in the United States: 2011, table HINC-05[66]
See also
| Wikimedia Commons has media related to Income distribution in the United States. |
General:
- Income inequality metrics
- International Ranking of Household Income
- Marriage gap
- Median income per household member
References
- ↑ 1.0 1.1 1.2 U.S. Census Bureau-Income and Poverty in the United States-September 2014
- ↑ Tcherneva, Pavlina R. (August 2014). "This Chart Shows Just How (Un)Equal Things Are During A 'Champion' Of The 99%'s Administration". Independent Journal Review. Retrieved 13 September 2014.
- ↑ Binyamin, Appelbaum (September 4, 2014). "Fed Says Growth Lifts the Affluent, Leaving Behind Everyone Else". New York Times. Retrieved 13 September 2014.
- ↑ Chokshi, Niraj (August 11, 2014). "Income inequality seems to be rising in more than 2 in 3 metro areas". Washington Post. Retrieved 13 September 2014.
- ↑ "Census Long Form Definition". United States Department of Housing and Urban Development. July 30, 2009.
- ↑ "Glossary: household income". South Carolina Community Profiles. Archived from the original on 2006-04-21. Retrieved 2006-08-10.
- ↑ 7.0 7.1 Gilbert, Dennis (1998). The American Class Structure. New York: Wadsworth Publishing. ISBN 0-534-50520-1.
- ↑ NYT-Neil Irwin-You Can't Feed a Family with GDP-September 2014
- ↑ http://krugman.blogs.nytimes.com/2014/11/12/on-income-stagnation/?comments#permid=13314433 NYT-Paul Krugman-On Income Stagnation-November 12, 2014
- ↑ 10.0 10.1 "The American Middle Class Hasn't Gotten a Raise in 15 Years". Five Thirty Eight. 2014-09-22. Retrieved 2014-09-29.
- ↑ New York Magazine-Annie Lowrey-Will the economy ever be as good as it was in the '90's-September 2014
- ↑ http://kff.org/report-section/2013-summary-of-findings/
- ↑ Vox-Goodheart and Erfurth-Monetary policy and long-term trends-November 2014
- ↑ FRED Database-Income Measures vs GDP-Retrieved November 6, 2014
- ↑ "WIC Income Eligibility Guidelines". United States Department of Agriculture. September 12, 2013.
- ↑ "Federal Student Aid". U.S. Department of Education. September 12, 2013.
- ↑ U.S. Census Bureau, Historical Income Tables: Households, Table H-6, Regions-by Median and Mean Income, All Races
- ↑ Shaefer, H. Luke; Edin, Kathryn (February 2012). "Extreme Poverty in the United States, 1996 to 2011" (PDF). Policy Brief (National Poverty Center) (28).
- ↑ "US Census Bureau news release in regards to median income". Retrieved 2007-08-28.
- ↑ "US Census Bureau median income per household member". Retrieved 2008-08-28.
- ↑ 21.0 21.1 21.2 21.3 "CPS 2014 Annual Social and Economic Supplement, Selected Characteristics of Households, by Total Money Income in 2013". Retrieved 2015-03-02.
- ↑ "US Census Bureau press release regarding poverty" (PDF). Retrieved 2008-07-04.
- ↑ "US Census Bureau, income quintiles, 2007". Retrieved 2007-08-28.
- ↑ 24.0 24.1 Dugas, Christine (2003-09-15). "Middle class barely treads water". USA Today. Retrieved 2006-07-14.
- ↑ "Distribution of Income, Frank Levy".
- ↑ "US Census Bureau, income quintiles, 2006". Retrieved 2007-02-11.
- ↑ "US Census Bureau, Median household income 1990". Retrieved 2006-08-10.
- ↑ "CPI inflation calculator, 1990 USD to 2003 USD". Retrieved 2006-08-10.
- ↑ 29.0 29.1 29.2 "Income and poverty since 1967, US Census Bureau" (PDF). Retrieved 2006-09-26.
- ↑ DeNavas-Walt, Carmen; Proctor, Bernadette D.; Smith, Jessica C. (September 2012). "Real Median Household Income by Race and Hispanic Origin: 1967 to 2010". Income, Poverty, and Health Insurance Coverage in the United States: 2011 (PDF). U.S. Census Bureau. p. 8.
- ↑ "US Census Bureau. (2001). Historical Income Tables – Income Equality.". Archived from the original on 2007-02-08. Retrieved 2007-06-20.
- ↑ "Weinberg, D. H. (June 1996). A Brief Look At Postwar U.S. Income Inequality. US Census Bureau." (PDF). Retrieved 2007-06-20.
- ↑ 33.0 33.1 33.2 33.3 "Income from 1969 to 1996, US Census Bureau" (PDF). Retrieved 2006-09-26.
- ↑ "Yellen, J. L. (November 6, 2006). Speech to the Center for the Study of Democracy at the University of California, Irvine. Federal Reserve Bank of San Francisco.". Retrieved 2007-06-20.
- ↑ Johnston, D. (2007-03-29). "Income Gap Is Widening, Data Shows". The New York Times. Retrieved 2007-06-20.
- ↑ "US Personal Income News Release". Bureau of Economic Analysis. Retrieved 2006-12-18.
- ↑ "Overview of BLS statistics on Inflation and Spending". Retrieved 2006-12-18.
- ↑ "US Households and Families 2000" (PDF). Retrieved 2006-12-18.
- ↑ US Census Bureau. "Historical Income Tables – Households." Tables H-1 and H-6. Retrieved 2013-08-10.
- ↑ 41.0 41.1 "US Census Bureau on the nature the median in determining wealth" (PDF). Retrieved 2006-06-29.
- ↑ 42.0 42.1 "U.S. Census Bureau FAQs: What is the difference between a median and a mean?". United States Census Bureau. Archived from the original on 2006-09-22. Retrieved 2006-06-29.
- ↑ 43.0 43.1 "US Census Bureau, Income Distribution to $250,000 or More for Households: 2013". Retrieved 2015-03-02.
- ↑ "US Census 2007 Economic Survey, income data". US Census Bureau. May 2008.
- ↑ 45.0 45.1 "US Census Bureau, 2000 Census racial data". Retrieved 2006-06-29.
- ↑ 46.0 46.1 46.2 46.3 "US Census Bureau 2005 Economic survey, racial income distribution". Retrieved 2006-06-29.
- ↑ "US Census Bureau, median household income according to certain demographic characteristics". Archived from the original on 2006-06-18. Retrieved 2006-06-29.
- ↑ 48.0 48.1 48.2 48.3 48.4 48.5 "Educational attainment and median household income". Retrieved 2006-09-24.
- ↑ "US Census Bureau, Income by education and sex". Archived from the original on 2006-04-11. Retrieved 2006-06-30.
- ↑ "Wall Street Journal on MBA salary base". Retrieved 2006-06-30.
- ↑ 51.0 51.1 51.2 "US Census Bureau on Education and Income" (PDF). Retrieved 2006-06-30.
- ↑ "Infoplease, median household income". Retrieved 2006-06-29.
- ↑ 53.0 53.1 "Personal income and educational attainment, US Census Bureau". Archived from the original on 2006-09-07. Retrieved 2006-09-24.
- ↑ 54.0 54.1 54.2 54.3 "US Census Bureau median household income by age of householder". Retrieved 2006-07-07.
- ↑ "US Census Bureau, median family income by family size". Archived from the original on 2006-06-26. Retrieved 2006-06-29.
- ↑ "US Census Bureau, median household income by state". Archived from the original on 2006-06-28. Retrieved 2006-06-29.
- ↑ DeNavas-Walt, Carmen; Proctor, Bernadette D.; Smith, Jessica C. (September 2011). Income, Poverty, and Health Insurance Coverage in the United States: 2010 (PDF). U.S. Census Bureau.
- ↑ 58.0 58.1 "Median home price by state". Retrieved 2006-07-01.
- ↑ "The State of the Nation's Housing 2002" (PDF). Joint Center for Housing Studies of Harvard University. Archived from the original (PDF) on 2011-11-10.
- ↑ 60.0 60.1 60.2 "US Census Bureau, median household income by state 2004". Archived from the original on 2006-06-28. Retrieved 2006-07-01.
- ↑ 2008 Median Household Income. U.S. Census Bureau. Retrieved 2009-12-23. 2007 Median Household Income. U.S. Census Bureau. Retrieved 2009-12-23.
- ↑ "Cost of Living 4th Quarter 2011". Missouri Economic Research & Information Center. 2011-12-21. Retrieved 2012-02-21.
- ↑ 63.0 63.1 Webster, Jr., Bruce H.; Bishaw, Alemayehu (August 2006). "Income, Earnings, and Poverty Data From the 2005 American Community Survey" (PDF). United States Census Bureau.
- ↑ "US Census Bureau; Income, Poverty, and Health Insurance Coverage in the United States: 2011". Retrieved 2013-03-25.
- ↑ "New York Times definition of class according to the quintiles". The New York Times. 2005-05-15. Retrieved 2008-05-02.
- ↑ "US Census Bureau; Income, Poverty, and Health Insurance Coverage in the United States: 2011". Retrieved 2013-03-27.
External links
- Income, Poverty, and Health Insurance Coverage in the United States: 2003
- Reynolds, Alan (January 8, 2007). "Has U.S. Income Inequality Really Increased?". Policy Analysis (Cato Institute) (586).
- U.S. Census Bureau's web-site for income statistics
- NPR.org statistics and background on income inequality in the United States
- Datasets by U.S. State of low income, very low income, extremely low income limits
| ||||||||||||||||||||||||||||||||||||||||||||||||||||||||||||||||||||||||||||||||||||||||||||||||||||||||
| ||||||
| ||||||||||||||||||||||||||||||||||||||||||||||||||||||||||||||||||||||||||||||