Holborn (UK Parliament constituency)
| Holborn | |
|---|---|
|
Former Borough constituency for the House of Commons | |
| 1885–1950 | |
| Number of members | one |
| Replaced by | Holborn and St Pancras South |
| Created from | Finsbury |
Holborn was a parliamentary constituency centred on the Holborn district of Central London. It returned one Member of Parliament to the House of Commons of the Parliament of the United Kingdom.
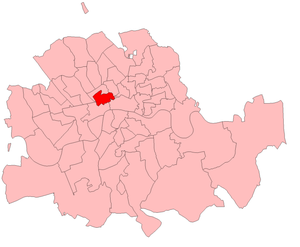
Holborn in the Metropolitan area, showing boundaries used from 1885 to 1918.
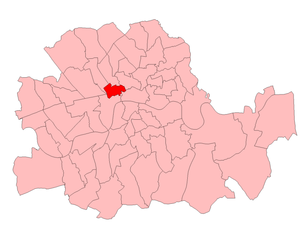
Holborn in the Parliamentary County of London, showing boundaries used from 1918 to 1950.
The constituency was created for the 1885 general election, and abolished for the 1950 general election, when it was largely replaced by the new constituency of Holborn & St Pancras South.
Boundaries
The Redistribution of Seats Act 1885 provided that the constituency was to consist of-
- so much of the Holborn District as comprises the Parishes of—
- The St Giles District:
1918-1950: The Metropolitan Borough of Holborn.
Members of Parliament
| Election | Member | Party | |
|---|---|---|---|
| 1885 | Francis Duncan | Conservative | |
| 1888 | Gainsford Bruce | Conservative | |
| 1892 | Sir Charles Hall | Conservative | |
| 1900 | Sir James Remnant | Conservative | |
| 1918 | Coalition Conservative | ||
| 1922 | Conservative | ||
| 1928 | Stuart James Bevan | Conservative | |
| 1935 | Sir Robert Tasker | Conservative | |
| 1945 | Max Aitken | Conservative | |
| 1950 | constituency abolished: see Holborn and St Pancras South | ||
Election results
Elections in the 1940s
| General Election 1945: Holborn | |||||
|---|---|---|---|---|---|
| Party | Candidate | Votes | % | ±% | |
| Conservative | John William Maxwell Aitken | 6,061 | 54.1 | ||
| Labour | Irene Marcouse | 5,136 | 45.9 | ||
| Majority | 925 | 8.2 | |||
| Turnout | 16,394 | 68.3 | |||
| Conservative hold | Swing | -18.8 | |||
Elections in the 1930s
| General Election 1935: Holborn | |||||
|---|---|---|---|---|---|
| Party | Candidate | Votes | % | ±% | |
| Conservative | Sir Robert Inigo Tasker | 11,654 | 72.9 | ||
| Labour | Richard S. Jeffries | 4,325 | 27.1 | ||
| Majority | 7,329 | 45.8 | |||
| Turnout | 32,641 | 49.0 | |||
| Conservative hold | Swing | -11.8 | |||
| General Election 1931: Holborn | |||||
|---|---|---|---|---|---|
| Party | Candidate | Votes | % | ±% | |
| Conservative | Stuart James Bevan | 16,094 | 84.7 | ||
| Labour | Fitzroy W. Hickinbottom | 2,916 | 15.3 | ||
| Majority | 13,178 | 69.4 | |||
| Turnout | 33,543 | 56.7 | |||
| Conservative hold | Swing | +19.1 | |||
Elections in the 1920s
| General Election 1929: Holborn | |||||
|---|---|---|---|---|---|
| Party | Candidate | Votes | % | ±% | |
| Conservative | Stuart James Bevan KC | 10,093 | 56.8 | ||
| Labour | Fitzroy W. Hickinbottom | 4,530 | 25.5 | ||
| Liberal | Thomas Edward Morton | 3,150 | 17.7 | ||
| Majority | 5,563 | 31.3 | |||
| Turnout | 32,862 | 54.1 | |||
| Conservative hold | Swing | -3.7 | |||
| Holborn by-election, 1928: 28 June 1928 | |||||
|---|---|---|---|---|---|
| Party | Candidate | Votes | % | ±% | |
| Conservative | Stuart James Bevan | 6,365 | 59.7 | ||
| Labour | Percy Allott | 2,238 | 21.0 | ||
| Liberal | Thomas Edward Morton | 2,062 | 19.3 | ||
| Majority | 4,127 | 38.7 | |||
| Turnout | 27,357 | 39.0 | |||
| Conservative hold | Swing | -6.2 | |||
| General Election 1924: Holborn | |||||
|---|---|---|---|---|---|
| Party | Candidate | Votes | % | ±% | |
| Conservative | Sir James Farquharson Remnant, Bt. | 11,428 | 75.5 | ||
| Labour | W.W. Messer | 3,718 | 24.5 | ||
| Majority | 7,710 | 51.0 | |||
| Turnout | 27,490 | 55.1 | |||
| Conservative hold | Swing | +3.5 | |||
| General Election 1923: Holborn | |||||
|---|---|---|---|---|---|
| Party | Candidate | Votes | % | ±% | |
| Conservative | Sir James Farquharson Remnant, Bt. | 7,892 | 59.4 | ||
| Liberal | John Salter Stooke-Vaughan | 3,349 | 25.2 | ||
| Labour | Augustus West | 2,044 | 15.4 | ||
| Majority | 4,543 | 34.2 | |||
| Turnout | 27,218 | 48.8 | |||
| Conservative hold | Swing | -3.4 | |||
| General Election 1922: Holborn | |||||
|---|---|---|---|---|---|
| Party | Candidate | Votes | % | ±% | |
| Conservative | Sir James Farquharson Remnant, Bt. | 8,996 | 70.5 | ||
| Liberal | John Salter Stooke-Vaughan | 3,757 | 29.5 | ||
| Majority | 5,239 | 41.0 | |||
| Turnout | 26,991 | 47.2 | |||
| Conservative hold | Swing | N/A | |||
Elections in the 1910s
| General Election 1918: Holborn | |||||
|---|---|---|---|---|---|
| Party | Candidate | Votes | % | ±% | |
| Unionist | Sir James Farquharson Remnant | 6,874 | 86.3 | ||
| Independent Labour | John Hazelwood Worrall | 1,091 | 13.7 | ||
| Majority | 5,783 | 72.6 | |||
| Turnout | 20,371 | 39.1 | |||
| Unionist hold | Swing | N/A | |||
| General Election December 1910: Finsbury, Holborn | |||||
|---|---|---|---|---|---|
| Party | Candidate | Votes | % | ±% | |
| Conservative | James Farquharson Remnant | 4,313 | 72.8 | ||
| Liberal | Charles Ralph Cooke-Taylor | 1,615 | 27.2 | ||
| Majority | 2,698 | 45.6 | |||
| Turnout | |||||
| Conservative hold | Swing | +4.6 | |||
| General Election January 1910: Finsbury, Holborn | |||||
|---|---|---|---|---|---|
| Party | Candidate | Votes | % | ±% | |
| Conservative | James Farquharson Remnant | 4,847 | 68.2 | ||
| Liberal | Sir Richard Stapley | 2,262 | 31.8 | ||
| Majority | 2,585 | 36.4 | |||
| Turnout | |||||
| Conservative hold | Swing | +9.3 | |||
Elections in the 1900s (decade)
| General Election 1906: Finsbury, Holborn | |||||
|---|---|---|---|---|---|
| Party | Candidate | Votes | % | ±% | |
| Conservative | James Farquharson Remnant | 3,881 | 58.9 | ||
| Liberal | S. Miall | 2,706 | 41.1 | ||
| Majority | 1,175 | 17.8 | |||
| Turnout | 9,242 | 71.3 | |||
| Conservative hold | Swing | N/A | |||
| General Election 1900: Finsbury, Holborn | |||||
|---|---|---|---|---|---|
| Party | Candidate | Votes | % | ±% | |
| Conservative | James Farquharson Remnant | unopposed | |||
| Turnout | 10,903 | N/A | |||
| Conservative hold | Swing | N/A | |||
| Holborn by-election, 1900: 23 March 1900 | |||||
|---|---|---|---|---|---|
| Party | Candidate | Votes | % | ±% | |
| Conservative | James Farquharson Remnant | unopposed | |||
| Turnout | 10,903 | N/A | |||
| Conservative hold | Swing | N/A | |||
Elections in the 1890s
| General Election 1895: Finsbury, Holborn | |||||
|---|---|---|---|---|---|
| Party | Candidate | Votes | % | ±% | |
| Conservative | Sir Charles Hall | unopposed | |||
| Turnout | 11,717 | N/A | |||
| Conservative hold | Swing | N/A | |||
| Holborn by-election, 1892: 12 August 1892 | |||||
|---|---|---|---|---|---|
| Party | Candidate | Votes | % | ±% | |
| Conservative | Sir Charles Hall | unopposed | |||
| Turnout | 12,214 | N/A | |||
| Conservative hold | Swing | N/A | |||
| General Election 1892: Finsbury, Holborn | |||||
|---|---|---|---|---|---|
| Party | Candidate | Votes | % | ±% | |
| Conservative | Gainsford Bruce | 4,949 | 66.6 | ||
| Lib-Lab | G. Bateman | 2,477 | 33.4 | ||
| Majority | 2,472 | 33.2 | |||
| Turnout | 12,214 | 60.8 | |||
| Conservative hold | Swing | +10.4 | |||
Elections in the 1880s
| Holborn by-election, 1888: 29 November 1888 | |||||
|---|---|---|---|---|---|
| Party | Candidate | Votes | % | ±% | |
| Conservative | Gainsford Bruce | 4,398 | 56.2 | ||
| Liberal | Earl Compton | 3,433 | 43.8 | ||
| Majority | 965 | 12.4 | |||
| Turnout | 11,383 | 68.8 | |||
| Conservative hold | Swing | -9.0 | |||
| General Election 1886: Finsbury, Holborn | |||||
|---|---|---|---|---|---|
| Party | Candidate | Votes | % | ±% | |
| Conservative | Francis Duncan | 3,651 | 65.2 | ||
| Liberal | Dadabhai Naoroji | 1,950 | 34.8 | ||
| Majority | 1,701 | 30.4 | |||
| Turnout | 9,802 | 57.1 | |||
| Conservative hold | Swing | +3.1 | |||
| General Election 1885: Finsbury, Holborn | |||||
|---|---|---|---|---|---|
| Party | Candidate | Votes | % | ±% | |
| Conservative | Francis Duncan | 4,047 | 62.1 | ||
| Liberal | Charles Harrison | 2,473 | 37.9 | ||
| Majority | 1,574 | 24.2 | |||
| Turnout | 9,802 | 66.5 | |||
References
- ↑ Redistribution of Seats Act 1885, Sixth Schedule