Hertsmere Borough Council election, 2011
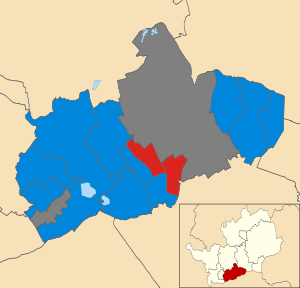
Map of the results of the 2011 Hertsmere council election.
Conservatives in blue and
Labour in red. Wards in grey were not contested in 2011.
The 2011 Hertsmere Borough Council election took place on 5 May 2011 to elect members of Hertsmere Borough Council in Hertfordshire, England. One third of the council was up for election and the Conservative party stayed in overall control of the council.[1]
After the election, the composition of the council was
Background
13 of the 39 seats on the council were being contested, with 2 sitting councillors standing down at the election, Conservative Darren Solomons and Liberal Democrat Anita Gamble.[3] Meanwhile the Liberal Democrat leader on the council Roger Kutchinsky contested Bushey Heath, instead of the ward he had previously held Bushey North.[3]
Election result
The Conservatives gained 2 seats from the Liberal Democrats, but lost a seat to Labour, thus winning 11 of the 13 seats contested.[4][5] This meant the Conservatives stayed in control of the council with 35 seats compared to 4 for Labour.[5] Meanwhile the defeats for the Liberal Democrats meant they no longer had any seats on Hertsmere council for the first time ever.[6] Overall turnout at the election was 40.49%.[7]
The Conservatives gained Bushey North and Bushey St James from the Liberal Democrats, while the Liberal Democrat leader came third in Bushey Heath.[8] Labour candidate Richard Butler gained Borehamwood Kenilworth from the Conservatives, at the same election that his father Ernie Butler held Borehamwood Cowley Hill for Labour.[4] The gain by 25 year old Richard Butler meant Labour finished the election with more councillors than before the election for the first time since 1996.[9]
| Hertsmere local election result 2011[7] |
| Party |
Seats |
Gains |
Losses |
Net gain/loss |
Seats % |
Votes % |
Votes |
+/− |
| |
Conservative |
11 |
2 |
1 |
+1 |
84.6 |
59.7 |
15,493 |
-1.2% |
| |
Labour |
2 |
1 |
0 |
+1 |
15.4 |
29.1 |
7,549 |
+2.9% |
| |
Liberal Democrat |
0 |
0 |
2 |
-2 |
0 |
10.4 |
2,691 |
+0.1% |
| |
UKIP |
0 |
0 |
0 |
0 |
0 |
0.9 |
236 |
+0.9% |
Ward results
| Aldenham East[7] |
| Party |
Candidate |
Votes |
% |
±% |
|
Conservative |
Charles Goldstein |
1,410 |
75.2 |
-5.4 |
|
Liberal Democrat |
Ruth Irwin |
250 |
13.3 |
+13.3 |
|
Labour |
Richard Kirk |
214 |
11.4 |
+3.1 |
| Majority |
1,160 |
61.9 |
-7.5 |
| Turnout |
1,874 |
51.4 |
+11.3 |
|
Conservative hold |
Swing |
|
|
| Aldenham West[7] |
| Party |
Candidate |
Votes |
% |
±% |
|
Conservative |
Dan Griffin |
1,122 |
72.4 |
-2.1 |
|
Labour |
Sandra Huff |
270 |
17.4 |
+4.3 |
|
Liberal Democrat |
Robert Gamble |
158 |
10.2 |
+10.2 |
| Majority |
852 |
55.0 |
-6.3 |
| Turnout |
1,550 |
44.2 |
+9.5 |
|
Conservative hold |
Swing |
|
|
| Borehamwood Brookmeadow[7] |
| Party |
Candidate |
Votes |
% |
±% |
|
Conservative |
Sam Dobin |
995 |
50.1 |
+4.1 |
|
Labour |
Susan Maughan |
860 |
43.3 |
+16.9 |
|
Liberal Democrat |
Judith Sear |
133 |
6.7 |
-8.9 |
| Majority |
135 |
6.8 |
-12.8 |
| Turnout |
1,988 |
36.9 |
-22.7 |
|
Conservative hold |
Swing |
|
|
| Borehamwood Cowley Hill[7] |
| Party |
Candidate |
Votes |
% |
±% |
|
Labour |
Ernie Butler |
1,125 |
60.9 |
+18.7 |
|
Conservative |
Alan Plancey |
723 |
39.1 |
+2.6 |
| Majority |
402 |
21.8 |
+16.1 |
| Turnout |
1,848 |
30.7 |
-23.4 |
|
Labour hold |
Swing |
|
|
| Bushey Heath[7] |
| Party |
Candidate |
Votes |
% |
±% |
|
Conservative |
Paul Morris |
1,845 |
75.3 |
-1.8 |
|
Labour |
David Bearfield |
322 |
13.1 |
+2.2 |
|
Liberal Democrat |
Roger Kutchinsky |
282 |
11.5 |
-0.5 |
| Majority |
1,523 |
62.2 |
-2.9 |
| Turnout |
2,449 |
48.1 |
-26.0 |
|
Conservative hold |
Swing |
|
|
| Bushey North[7] |
| Party |
Candidate |
Votes |
% |
±% |
|
Conservative |
Leslie Winters |
841 |
45.4 |
+1.0 |
|
Liberal Democrat |
Eddie Sheridan |
583 |
31.5 |
-9.7 |
|
Labour |
Sam Russell |
427 |
23.1 |
+8.7 |
| Majority |
258 |
13.9 |
+10.8 |
| Turnout |
1,851 |
39.3 |
-26.2 |
|
Conservative gain from Liberal Democrat |
Swing |
|
|
| Bushey St James[7] |
| Party |
Candidate |
Votes |
% |
±% |
|
Conservative |
Carey Keates |
1,238 |
51.8 |
+2.3 |
|
Labour |
Tony Breslin |
662 |
27.7 |
+14.1 |
|
Liberal Democrat |
Kim Elliot |
491 |
20.5 |
-16.4 |
| Majority |
576 |
24.1 |
+11.4 |
| Turnout |
2,391 |
44.6 |
-23.6 |
|
Conservative gain from Liberal Democrat |
Swing |
|
|
| Potters Bar Furzefield[7] |
| Party |
Candidate |
Votes |
% |
±% |
|
Conservative |
Ronald Morris |
1,281 |
61.4 |
-6.6 |
|
Labour |
Jim Fisher |
532 |
25.5 |
-6.5 |
|
Liberal Democrat |
Susan Oatway |
275 |
13.2 |
+13.2 |
| Majority |
749 |
35.9 |
+0.0 |
| Turnout |
2,088 |
43.4 |
-25.7 |
|
Conservative hold |
Swing |
|
|
| Potters Bar Oakmere[7] |
| Party |
Candidate |
Votes |
% |
±% |
|
Conservative |
Robert Calcutt |
1,092 |
54.1 |
-11.5 |
|
Labour |
John Doolan |
566 |
28.0 |
-6.4 |
|
UKIP |
David Rutter |
236 |
11.7 |
+11.7 |
|
Liberal Democrat |
Michael Willett |
125 |
6.2 |
+6.2 |
| Majority |
526 |
26.1 |
-5.1 |
| Turnout |
2,019 |
37.0 |
-24.4 |
|
Conservative hold |
Swing |
|
|
| Potters Bar Parkfield[7] |
| Party |
Candidate |
Votes |
% |
±% |
|
Conservative |
Paul Hodgson-Jones |
1,876 |
68.9 |
-7.9 |
|
Labour |
Derek Marcus |
454 |
16.7 |
-6.5 |
|
Liberal Democrat |
Peter Bonner |
394 |
14.5 |
+14.5 |
| Majority |
1,422 |
52.2 |
-1.4 |
| Turnout |
2,724 |
46.0 |
-21.8 |
|
Conservative hold |
Swing |
|
|
References
|
|---|
| | Metropolitan boroughs |
- Barnsley
- Birmingham
- Bolton
- Bradford
- Bury
- Calderdale
- Coventry
- Doncaster
- Dudley
- Gateshead
- Kirklees
- Knowsley
- Leeds
- Liverpool
- Manchester
- Newcastle upon Tyne
- North Tyneside
- Oldham
- Rochdale
- Rotherham
- Salford
- Sandwell
- Sefton
- Sheffield
- Solihull
- South Tyneside
- St Helens
- Stockport
- Sunderland
- Tameside
- Trafford
- Wakefield
- Walsall
- Wigan
- Wirral
- Wolverhampton
|
|---|
| | Unitary authorities | |
|---|
| | District councils (England) | |
|---|
| | District councils (Northern Ireland) |
- Antrim
- Ards
- Armagh
- Ballymena
- Ballymoney
- Banbridge
- Belfast
- Carrickfergus
- Castlereagh
- Coleraine
- Cookstown
- Craigavon
- Derry
- Down
- Dungannon and South Tyrone
- Fermanagh
- Larne
- Limavady
- Lisburn
- Magherafelt
- Moyle
- Newry and Mourne
- Newtownabbey
- North Down
- Omagh
- Strabane
|
|---|
| | Mayoral elections | |
|---|
| | National Assembly elections | |
|---|
| | Referendums | |
|---|
|