Hertsmere Borough Council election, 2006
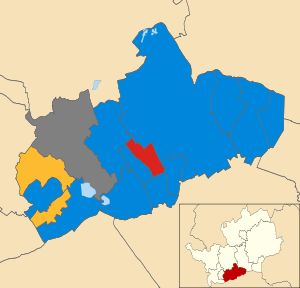
Map of the results of the 2006 Hertsmere council election.
Conservatives in blue, Liberal Democrats in yellow and
Labour in red. The ward in grey was not contested in 2006.
The 2006 Hertsmere Borough Council election took place on 4 May 2006 to elect members of Hertsmere Borough Council in Hertfordshire, England. One third of the council was up for election and the Conservative party stayed in overall control of the council.[1]
After the election, the composition of the council was
Background
Before the election the Conservatives controlled the council with 26 seats, compared to 7 for Labour and 6 Liberal Democrats.[3] As well as the normal 13 seats being contested, an extra seat was up for election in Aldenham East after the councillor Nigel Gilmore stepped down.[3] Other councillors standing down included 2 from Labour, Joe Goldberg and Len Silverstone, and Conservatives Ron Gealy and Zita Hobbs.[3][4] 9 of the 14 seats were being defended by the Conservatives, 3 by Labour and 2 by the Liberal Democrats.[3]
Election result
The Conservatives increased their majority to 17 after gaining 2 seats from Labour.[5][6] This reduced Labour to 5 councillors, behind the Liberal Democrats who stayed on 6 after retaining their 2 seats in Bushey.[6][7] The Conservatives gains came in Borehamwood Brookmeadow, which they took by 103 votes, and Borehamwood Kenilworth, where Labour lost by 12 votes after several recounts.[6] This meant Labour only won 1 seat in Borehamwood Cowley Hill, where they held on by an 86 vote majority.[6]
The Labour group leader Leon Reefe said the reason for the defeats for the party was that "Labour voters are still disenchanted with what's going on nationally", while the Conservative council leader said "obviously national events had a bearing but I still feel that locally we are providing good services".[6]
| Hertsmere Local Election Result 2006[2][8] |
| Party |
Seats |
Gains |
Losses |
Net gain/loss |
Seats % |
Votes % |
Votes |
+/− |
| |
Conservative |
11 |
2 |
0 |
+2 |
78.6 |
57.6 |
13,511 |
+1.1% |
| |
Liberal Democrat |
2 |
0 |
0 |
0 |
14.3 |
21.3 |
4,985 |
-1.5% |
| |
Labour |
1 |
0 |
2 |
-2 |
7.1 |
18.1 |
4,243 |
-1.8% |
| |
Green |
0 |
0 |
0 |
0 |
0 |
1.2 |
289 |
+1.2% |
| |
Victory United |
0 |
0 |
0 |
0 |
0 |
1.0 |
234 |
+1.0% |
| |
Socialist Labour |
0 |
0 |
0 |
0 |
0 |
0.8 |
187 |
+0.0% |
Ward results
| Aldenham East[8] |
| Party |
Candidate |
Votes |
% |
±% |
|
Conservative |
Charles Goldstein |
1,191 |
80.3 |
+2.8 |
|
Liberal Democrat |
David Bird |
172 |
11.6 |
-0.1 |
|
Labour |
Peter Halsley |
121 |
8.2 |
-2.7 |
| Majority |
1,019 |
68.7 |
+2.9 |
| Turnout |
1,484 |
48.7 |
+4.7 |
|
Conservative hold |
Swing |
|
|
| Borehamwood Cowley Hill[8] |
| Party |
Candidate |
Votes |
% |
±% |
|
Labour |
Dinah Hoeksma |
642 |
40.9 |
+2.1 |
|
Conservative |
Darren Solomons |
556 |
35.4 |
+1.8 |
|
Socialist Labour |
James Dry |
187 |
11.9 |
+1.2 |
|
Liberal Democrat |
Martin Ownsworth |
186 |
11.8 |
-5.0 |
| Majority |
86 |
5.5 |
+0.3 |
| Turnout |
1,571 |
31.1 |
+0.6 |
|
Labour hold |
Swing |
|
|
| Borehamwood Kenilworth[8] |
| Party |
Candidate |
Votes |
% |
±% |
|
Conservative |
Patricia Strack |
511 |
43.4 |
+5.4 |
|
Labour |
Ernest Butler |
499 |
42.4 |
+1.1 |
|
Liberal Democrat |
Zissis Kakoulakis |
167 |
14.2 |
-6.5 |
| Majority |
12 |
1.0 |
|
| Turnout |
1,177 |
31.6 |
+11.0 |
|
Conservative gain from Labour |
Swing |
|
|
| Bushey Heath[8] |
| Party |
Candidate |
Votes |
% |
±% |
|
Conservative |
Brenda Batten |
1,518 |
73.5 |
+4.7 |
|
Liberal Democrat |
Roger Kutchinsky |
375 |
18.2 |
-2.2 |
|
Labour |
David Bearfield |
171 |
8.3 |
-2.4 |
| Majority |
1,143 |
55.4 |
+6.0 |
| Turnout |
2,064 |
41.7 |
+1.7 |
|
Conservative hold |
Swing |
|
|
| Bushey North[8] |
| Party |
Candidate |
Votes |
% |
±% |
|
Liberal Democrat |
Marilyn Colne |
941 |
58.7 |
+1.9 |
|
Conservative |
John Slade |
437 |
27.3 |
-5.4 |
|
Labour |
George Bath |
118 |
7.4 |
-3.1 |
|
Green |
Arjuna Krishna-Das |
106 |
6.6 |
+6.6 |
| Majority |
504 |
31.5 |
+7.3 |
| Turnout |
1,602 |
42.0 |
+6.6 |
|
Liberal Democrat hold |
Swing |
|
|
| Bushey Park[8] |
| Party |
Candidate |
Votes |
% |
±% |
|
Liberal Democrat |
Lynne Hodgson |
741 |
51.5 |
+14.9 |
|
Conservative |
Abul Choudhury |
698 |
48.5 |
-7.5 |
| Majority |
43 |
3.0 |
|
| Turnout |
1,439 |
48.0 |
+2.0 |
|
Liberal Democrat hold |
Swing |
|
|
| Bushey St James[8] |
| Party |
Candidate |
Votes |
% |
±% |
|
Conservative |
Jean Conway |
914 |
43.8 |
+0.0 |
|
Liberal Democrat |
Vincent Turner |
846 |
40.5 |
-5.9 |
|
Green |
Edward Canfor-Dumas |
183 |
8.8 |
+8.8 |
|
Labour |
Yue Cheng |
146 |
7.0 |
-2.8 |
| Majority |
68 |
3.3 |
|
| Turnout |
2,089 |
41.1 |
-1.0 |
|
Conservative hold |
Swing |
|
|
| Elstree[8] |
| Party |
Candidate |
Votes |
% |
±% |
|
Conservative |
Derrick Gunasekera |
932 |
75.3 |
+3.7 |
|
Liberal Democrat |
Mark Silverman |
159 |
12.8 |
+12.8 |
|
Labour |
Anthony Scott-Norman |
147 |
11.9 |
-16.5 |
| Majority |
773 |
62.4 |
+19.1 |
| Turnout |
1,238 |
34.6 |
+8.5 |
|
Conservative hold |
Swing |
|
|
| Potters Bar Furzefield[8] |
| Party |
Candidate |
Votes |
% |
±% |
|
Conservative |
Christine Calcutt |
1,066 |
59.3 |
+1.4 |
|
Liberal Democrat |
Colin Dean |
443 |
24.6 |
+0.9 |
|
Labour |
James Fisher |
289 |
16.1 |
-2.3 |
| Majority |
623 |
34.6 |
+0.5 |
| Turnout |
1,798 |
42.4 |
+4.0 |
|
Conservative hold |
Swing |
|
|
| Potters Barr Oakmere[8] |
| Party |
Candidate |
Votes |
% |
±% |
|
Conservative |
Shirley Legate |
1,242 |
66.2 |
-2.3 |
|
Liberal Democrat |
James Hurd |
320 |
17.0 |
+17.0 |
|
Labour |
Russell Ramshaw |
315 |
16.8 |
-14.7 |
| Majority |
922 |
49.1 |
+12.0 |
| Turnout |
1,877 |
36.2 |
+0.5 |
|
Conservative hold |
Swing |
|
|
| Potters Bar Parkfield[8] |
| Party |
Candidate |
Votes |
% |
±% |
|
Conservative |
Edwin Roach |
1,649 |
70.3 |
+2.2 |
|
Liberal Democrat |
Peter Bonner |
478 |
20.4 |
+2.1 |
|
Labour |
Perry Ellis |
220 |
9.4 |
-4.2 |
| Majority |
1,171 |
49.9 |
+0.0 |
| Turnout |
2,347 |
41.0 |
+0.8 |
|
Conservative hold |
Swing |
|
|
| Shenley[8] |
| Party |
Candidate |
Votes |
% |
±% |
|
Conservative |
Rosemary Gilligan |
822 |
69.3 |
+4.5 |
|
Labour |
Richard Kirk |
207 |
17.5 |
-1.1 |
|
Liberal Democrat |
Anita Ownsworth |
157 |
13.2 |
-4.5 |
| Majority |
615 |
51.9 |
+5.7 |
| Turnout |
1,186 |
31.9 |
-4.7 |
|
Conservative hold |
Swing |
|
|
References