Hereford (UK Parliament constituency)
| Hereford | |
|---|---|
|
Former County constituency for the House of Commons | |
|
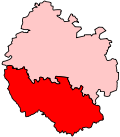
Boundary of Hereford in Herefordshire. | |
|
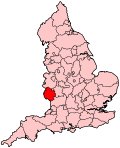
Location of Herefordshire within England. | |
| County | Herefordshire |
| Major settlements | Hereford |
| 1918–2010 | |
| Number of members | One |
| Replaced by | Hereford and South Herefordshire, North Herefordshire |
| 1295–1918 | |
| Number of members |
1295–1885: Two 1885–1918: One |
| Type of constituency | Borough constituency |
Hereford was, until 2010, a constituency of the House of Commons of the Parliament of the United Kingdom. Since 1918, it had elected one Member of Parliament (MP) by the first-past-the-post voting system.
Previously, Hereford had been a parliamentary borough which from 1295 to 1885 had elected two MPs, using the bloc vote system in contested elections. Under the Redistribution of Seats Act 1885 the borough's representation had been reduced to one seat at the 1885 general election, and for the 1918 general election the borough was abolished and replaced with a county division which carried the same name but covered a wider geographical area.
History
Hereford sent two representatives to Parliament from the beginning of the reign of Edward I. Although a county town, the early elections were always held at a different location from those of the shire, the former taking place at the Guildhall, the latter in the castle.
In 1885 representation was reduced to one Member.
Journalist Robin Day stood as the Liberal candidate in the 1959 General Election.
From 1931 until 1997, Hereford was held by the Conservative Party, before being taken by Paul Keetch of the Liberal Democrats at the 1997 general election. Keetch served as the Liberal Democrats' spokesman for defence from October 1999 until May 2005, and announced on 17 November 2006 that he would not be standing at the next election.
Following the review by the Boundary Commission for England of parliamentary representation in Herefordshire, taking effect at the 2010 general election, two parliamentary constituencies have been allocated to the county. The Hereford seat has been abolished and replaced by the Hereford and South Herefordshire seat, while the remainder of the county is covered by the North Herefordshire seat. [1]
Boundaries
In its final form, the Hereford constituency contained the city of Hereford and most of South Herefordshire, including Ross-on-Wye but excluding Ledbury and Much Marcle both of which were in the Leominster constituency.
Members of Parliament
MPs 1295–1640
- This list is incomplete; you can help by expanding it.
| Parliament | First member | Second member |
|---|---|---|
| Jan. 1377 | Richard Nash[2] | |
| 1378 | Thomas Whitefield[2] | |
| 1379 | Richard Nash[2] | |
| Jan.1380 | Richard Nash[2] | |
| 1381 | Richard Nash[2] | |
| Oct. 1383 | Richard Nash[2] | |
| 1386 | John Wych | Henry Catchpole I[3] |
| 1388 (Feb) | William Jonet | Thomas Chippenham I[3] |
| 1388 (Sep) | William Jonet | William Breinton[3] |
| 1390 (Jan) | John Wych | James Nash[3] |
| 1390 (Nov) | Henry Catchpole II | James Nash[3] |
| 1391 | Thomas Buryton | John Prophet[3] |
| 1393 | Thomas Buryton | John Wych[3] |
| 1394 | ||
| 1395 | Hugh Wigan | William Speed[3] |
| 1397 (Jan) | Hugh Wigan | James Nash[3] |
| 1397 (Sep) | Hugh Wigan | Thomas Buryton[3] |
| 1399 | James Nash | Thomas Buryton[3] |
| 1401 | Hugh Wigan | Thomas Whitefield[3] |
| 1402 | Thomas Chippenham I | John Troney[3] |
| 1404 (Jan) | ||
| 1404 (Oct) | ||
| 1406 | Henry Chippenham | Hugh Wigan[3] |
| 1407 | Hugh Wigan | Roger ...feld[3] |
| 1410 | ||
| 1411 | ||
| 1413 (Feb) | ||
| 1413 (May) | Henry Chippenham | George Breinton[3] |
| 1414 (Apr) | John Wilton | Richard Strange[3] |
| 1414 (Nov) | Henry Chippenham | George Breinton[3] |
| 1415 | ||
| 1416 (Mar) | Henry Chippenham | George Breinton[3] |
| 1416 (Oct) | ||
| 1417 | John Wilton | John Orchard[3] |
| 1419 | Richard Strange | John Abrahall[3] |
| 1420 | Thomas Chippenham II | John Falk[3] |
| 1421 (May) | William Buryton | Richard Strange[3] |
| 1421 (Dec) | Henry Chippenham | Nicholas Chippenham[3] |
| 1426 | Thomas Chippenham | |
| 1429 | Thomas Chippenham | William Buryton [4] |
| 1431 | Thomas Chippenham[5] | William Buryton[4] |
| 1432 | William Buryton[4] | |
| 1437 | William Buryton[4] | |
| 1510 | ||
| 1512 | Roland Brydges | Reginald Mynors[6] |
| 1515 | Roland Brydges | Reginald Mynors[6] |
| 1523 | ? | |
| 1529 | Richard Warnecombe | Thomas Havard[6] |
| 1536 | ? | |
| 1539 | ? | |
| 1542 | Richard Warnecombe | Thomas Havard[6] |
| 1545 | ? | |
| 1547 | Thomas Havard | William Berkeley, died and replaced Jan 1552 by John Warnecombe[6] |
| 1553 (Mar) | Hugh Welshe | ?[6] |
| 1553 (Oct) | Sir John Price | Thomas Havard[6] |
| 1554 (Apr) | Thomas Havard | Thomas Bromwich[6] |
| 1554 (Nov) | William Smothye | Leonard Boldyng[6] |
| 1555 | Hugh Gebons | Morgan Owgan[6] |
| 1558 | Henry Dudeston | John Gibbs[6] |
| 1558/1559 | John Kerry | Thomas Church[7] |
| 1562/1563 | Thomas Webbe, died and replaced 1566 by John Hyde | Henry Green[7] |
| 1571 | James Warnecombe | Thomas Church[7] |
| 1572 (Apr) | James Warnecombe | Gregory Price[7] |
| 1584 | Gregory Price | James Boyle[7] |
| 1586 (Sep) | Gregory Price | Thomas Jones[7] |
| 1588 | Gregory Price | Nicholas Garnons[7] |
| 1593 | Gregory Price | Thomas Mallard[7] |
| 1597 | Gregory Price | Anthony Pembridge[7] |
| 1601 | Walter Hurdman | Thomas Jones[7] |
| 1604 | Walter Hurdman | John Hoskins |
| 1614 | John Hoskins | John Warden |
| 1621–1622 | James Rodd | Richard Weaver |
| 1624 | Sir James Clerke | Richard Weaver |
| 1625 | Sir James Clerke | Richard Weaver |
| 1626 | Sir James Clerke | Richard Weaver |
| 1628 | The Viscount Scudamore | John Hoskins |
| 1629–1640 | No Parliaments summoned | |
MPs 1640–1885
| Event | First member[8] | First party | Second member[8] | Second party | ||
|---|---|---|---|---|---|---|
| April 1640 | Richard Weaver | Richard Seaborne | ||||
| November 1640 | Richard Weaver | Parliamentarian | Richard Seaborne | Royalist | ||
| 1642 | James Scudamore | Royalist | ||||
| May 1643 | Scudamore disabled from sitting – seat vacant | |||||
| January 1644 | Seaborne disabled from sitting – seat vacant | |||||
| 1646 | Bennet Hoskyns | Edmund Weaver[9] | ||||
| December 1648 | Hoskyns excluded in Pride's Purge – seat vacant | |||||
| 1653 | Hereford was unrepresented in Barebone's Parliament | |||||
| 1654 | Bennet Hoskyns | Hereford had only one seat in the First and Second Parliaments of the Protectorate | ||||
| 1656 | Colonel Wroth Rogers | |||||
| January 1659 | Nathan Rogers | Roger Bosworth | ||||
| May 1659 | Not represented in the restored Rump | |||||
| April 1660 | Herbert Westfaling | Roger Bosworth | ||||
| November 1660 | Sir Henry Lingen | |||||
| April 1661 | Sir Edward Hopton | |||||
| September 1661 | Herbert Westfaling | |||||
| 1662 | Roger Vaughan | |||||
| 1673 | The Viscount Scudamore | |||||
| 1679 | Bridstock Harford | Paul Foley | Country Whig | |||
| 1681 | Herbert Aubrey | |||||
| 1685 | Thomas Geers | |||||
| January 1689 | Sir William Gregory | Paul Foley | Country Whig | |||
| June 1689 | Henry Cornewall | |||||
| 1695 | James Morgan | |||||
| 1698 | Hon. James Brydges | |||||
| 1699 | Samuel Pytts | |||||
| 1701 | Thomas Foley | |||||
| 1715 | The Viscount Scudamore | |||||
| 1717 | Herbert Rudhale Westfaling | |||||
| 1722 | William Mayo | |||||
| 1723 | James Wallwyn | |||||
| 1727 | Marquess of Carnarvon | Thomas Geers[10] | ||||
| 1734 | Thomas Foley | Sir John Morgan | ||||
| 1741 | Edward Cope Hopton | Thomas Geers Winford | ||||
| 1747 | Lieutenant General Henry Cornewall | Daniel Leighton | ||||
| 1754 | Charles Fitzroy Scudamore | John Symons | Tory | |||
| 1764 | John Scudamore | |||||
| 1768 | (Sir) Richard Symons[11] | |||||
| April 1784 | Earl of Surrey[12] | Whig | ||||
| July 1784 | Robert Philipps | |||||
| 1785 | James Walwyn | |||||
| 1796 | John Scudamore, junior | |||||
| 1800 | Thomas Powell Symonds | |||||
| 1805 | Richard Philip Scudamore | |||||
| 1818 | Viscount Eastnor | |||||
| 1819 | Richard Philip Scudamore | |||||
| 1826 | Edward Bolton Clive | Whig | ||||
| 1832 | Robert Biddulph | Whig | ||||
| 1837 | Daniel Higford Davall Burr | Conservative | ||||
| July 1841 | Henry William Hobhouse | Whig | ||||
| October 1841 | Robert Pulsford | Whig | ||||
| 1845 | Sir Robert Price, Bt | Whig | ||||
| 1847 | Henry Morgan-Clifford | Whig | ||||
| 1857 | George Clive | Whig | ||||
| 1859 | Liberal | Liberal | ||||
| 1865 | Richard Baggallay | Conservative | ||||
| 1868[13] | John William Shaw Wylie | Liberal | ||||
| 1869 | Edward Clive | Liberal | Chandos Wren-Hoskyns | Liberal | ||
| 1871 | George Arbuthnot | Conservative | ||||
| 1874 | Evan Pateshall | Conservative | George Clive | Liberal | ||
| 1878 | George Arbuthnot | Conservative | ||||
| 1880 | Joseph Pulley | Liberal | Robert Reid | Liberal | ||
| 1885 | Representation reduced to one member | |||||
MPs 1885–2010
| Event | Member[8] | Party | |
|---|---|---|---|
| 1885 | Joseph Pulley | Liberal | |
| 1886 | Sir Joseph Russell Bailey | Conservative | |
| 1892 | William Grenfell | Liberal | |
| 1893 by-election | Charles Wallwyn Radcliffe Cooke | Conservative | |
| 1900 | John Stanhope Arkwright | Conservative | |
| 1912 by-election | Professor William Hewins | Liberal Unionist | |
| 1918 | Charles Thornton Pulley | Coalition Conservative | |
| 1921 by-election | Samuel Roberts | Coalition Conservative | |
| 1922 | Conservative | ||
| 1929 | Frank Owen | Liberal | |
| 1931 | James Thomas | Conservative | |
| 1956 by-election | David Gibson-Watt | Conservative | |
| 1974 | Sir Colin Shepherd | Conservative | |
| 1997 | Paul Keetch | Liberal Democrat | |
| 2010 | Constituency abolished: see Hereford and South Herefordshire | ||
Notes
- ↑ "Final recommendations for Parliamentary constituencies in the county of Herefordshire". Boundary Commission for England. 7 January 2004. Retrieved 5 May 2010.
- ↑ 2.0 2.1 2.2 2.3 2.4 2.5 http://www.historyofparliamentonline.org/volume/1386-1421/member/nash-%28ash%29-richard-13945
- ↑ 3.0 3.1 3.2 3.3 3.4 3.5 3.6 3.7 3.8 3.9 3.10 3.11 3.12 3.13 3.14 3.15 3.16 3.17 3.18 3.19 3.20 3.21 3.22 3.23 "History of Parliament". Retrieved 19 September 2011.
- ↑ 4.0 4.1 4.2 4.3 http://www.historyofparliamentonline.org/volume/1386-1421/member/buryton-william
- ↑ http://www.historyofparliamentonline.org/volume/1386-1421/member/chippenham-thomas-ii
- ↑ 6.0 6.1 6.2 6.3 6.4 6.5 6.6 6.7 6.8 6.9 6.10 "History of Parliament". Retrieved 19 September 2011.
- ↑ 7.0 7.1 7.2 7.3 7.4 7.5 7.6 7.7 7.8 7.9 "History of Parliament". Retrieved 19 September 2011.
- ↑ 8.0 8.1 8.2 Leigh Rayment's Historical List of MPs – Constituencies beginning with "H" (part 2)
- ↑ It is not known for certain whether Weaver sat after Pride's Purge: a "Mr Weaver" was re-admitted and Edmund Weaver appears in one list of members of the Rump, but he is not listed in the House of Commons Journals, and Brunton & Pennington suggest he has probably been confused with John Weaver, MP for Stamford (who was certainly a member)
- ↑ Later adopted the surname Winford
- ↑ Created a baronet, May 1774
- ↑ Surrey was also elected for Carlisle, which he chose to represent, and never sat for Hereford
- ↑ On petition, the election of 1868 was declared void and a by-election was held
Elections
Elections in the 2000s
| General Election 2005: Hereford | |||||
|---|---|---|---|---|---|
| Party | Candidate | Votes | % | ±% | |
| Liberal Democrat | Paul Keetch | 20,285 | 43.3 | +2.4 | |
| Conservative | Virginia Taylor | 19,323 | 41.2 | +2.5 | |
| Labour | Tom Calver | 4,800 | 10.2 | -4.9 | |
| Green | Brian Lunt | 1,052 | 2.2 | -0.5 | |
| UKIP | Christpher Kingsley | 1,030 | 2.2 | -0.5 | |
| Independent | Peter Morton | 404 | 0.9 | N/A | |
| Majority | 962 | 2.1 | -0.1 | ||
| Turnout | 46,894 | 65.3 | +0.1 | ||
| Liberal Democrat hold | Swing | −0.1 | |||
| General Election 2001: Hereford | |||||
|---|---|---|---|---|---|
| Party | Candidate | Votes | % | ±% | |
| Liberal Democrat | Paul Keetch | 18,244 | 40.9 | -7.1 | |
| Conservative | Virginia Taylor | 17,276 | 38.7 | +3.4 | |
| Labour | David Hallam | 6,739 | 15.1 | +2.6 | |
| UKIP | Clive Easton | 1,184 | 2.7 | N/A | |
| Green | David Gillett | 1,181 | 2.6 | N/A | |
| Majority | 968 | 2.2 | -10.4 | ||
| Turnout | 44,624 | 65.2 | -10.0 | ||
| Liberal Democrat hold | Swing | ||||
Elections in the 1990s
| General Election 1997: Hereford | |||||
|---|---|---|---|---|---|
| Party | Candidate | Votes | % | ±% | |
| Liberal Democrat | Paul Keetch | 25,198 | 47.9 | ||
| Conservative | Colin Shepherd | 18,550 | 35.3 | ||
| Labour | Chris Chappell | 6,596 | 12.6 | ||
| Referendum Party | Clive Easton | 2,209 | 4.2 | ||
| Majority | 6,648 | 12.6 | |||
| Turnout | 52,553 | 75.2 | |||
| Liberal Democrat gain from Conservative | Swing | ||||
| General Election 1992: Hereford[1] | |||||
|---|---|---|---|---|---|
| Party | Candidate | Votes | % | ±% | |
| Conservative | Colin Shepherd | 26,727 | 47.2 | −0.3 | |
| Liberal Democrat | Gwynoro Jones | 23,314 | 41.2 | −3.6 | |
| Labour | Ms. JE Kelly | 6,005 | 10.6 | +2.9 | |
| Green | CT Mattingly | 596 | 1.1 | +1.1 | |
| Majority | 3,413 | 6.0 | +3.3 | ||
| Turnout | 56,642 | 81.3 | +3.2 | ||
| Conservative hold | Swing | +1.7 | |||
Elections in the 1980s
| General Election 1987: Hereford | |||||
|---|---|---|---|---|---|
| Party | Candidate | Votes | % | ±% | |
| Conservative | Colin Shepherd | 24,865 | 47.50 | ||
| Liberal | CF Green | 23,452 | 44.80 | ||
| Labour | VS Woodell | 4,031 | 7.70 | ||
| Majority | 1,413 | 2.70 | |||
| Turnout | 78.04 | ||||
| Conservative hold | Swing | ||||
| General Election 1983: Hereford | |||||
|---|---|---|---|---|---|
| Party | Candidate | Votes | % | ±% | |
| Conservative | Colin Shepherd | 23,334 | 48.07 | ||
| Liberal | C Green | 21,057 | 43.38 | ||
| Labour | J Evans | 3,690 | 7.60 | ||
| Ecology | V Murray | 463 | 0.95 | ||
| Majority | 2,277 | 4.69 | |||
| Turnout | 75.79 | ||||
| Conservative hold | Swing | ||||
Elections in the 1970s
| General Election 1979: Hereford | |||||
|---|---|---|---|---|---|
| Party | Candidate | Votes | % | ±% | |
| Conservative | Colin Shepherd | 23,012 | 47.74 | ||
| Liberal | CF Green | 18,042 | 37.43 | ||
| Labour | IR Adshead | 7,150 | 14.83 | ||
| Majority | 4,970 | 10.31 | |||
| Turnout | 78.45 | ||||
| Conservative hold | Swing | ||||
| General Election October 1974: Hereford | |||||
|---|---|---|---|---|---|
| Party | Candidate | Votes | % | ±% | |
| Conservative | Colin Shepherd | 17,060 | 38.92 | ||
| Liberal | CB Tannant Nash | 15,948 | 36.39 | ||
| Labour | MK Prendergast | 10,820 | 24.69 | ||
| Majority | 1,112 | 2.54 | |||
| Turnout | 75.79 | ||||
| Conservative hold | Swing | ||||
| General Election February 1974: Hereford | |||||
|---|---|---|---|---|---|
| Party | Candidate | Votes | % | ±% | |
| Conservative | James David Gibson-Watt | 18,676 | 41.31 | ||
| Liberal | CB Tannant Nash | 15,238 | 33.70 | ||
| Labour | IE Geffen | 11,299 | 24.99 | ||
| Majority | 3,438 | 7.60 | |||
| Turnout | 78.89 | ||||
| Conservative hold | Swing | ||||
| General Election 1970: Hereford | |||||
|---|---|---|---|---|---|
| Party | Candidate | Votes | % | ±% | |
| Conservative | James David Gibson-Watt | 22,011 | 53.20 | ||
| Labour | GD Purnell | 14,410 | 34.83 | ||
| Liberal | TR Crowther | 4,953 | 11.97 | ||
| Majority | 7,601 | 18.37 | |||
| Turnout | 73.37 | ||||
| Conservative hold | Swing | ||||
Elections in the 1960s
| General Election 1966: Hereford
Electorate: 50,853 | |||||
|---|---|---|---|---|---|
| Party | Candidate | Votes | % | ±% | |
| Conservative | James David Gibson-Watt | 17,529 | 44.60 | ||
| Labour | Michael K Prendergast | 14,782 | 37.61 | ||
| Liberal | Kenneth Vaus | 6,996 | 17.80 | ||
| Majority | 2,747 | 6.99 | |||
| Turnout | 77.30 | ||||
| Conservative hold | Swing | ||||
| General Election 1964: Hereford
Electorate: 49,462 | |||||
|---|---|---|---|---|---|
| Party | Candidate | Votes | % | ±% | |
| Conservative | James David Gibson-Watt | 17,780 | 45.45 | ||
| Labour | Thomas J. H. Bishop | 12,020 | 30.72 | ||
| Liberal | Kenneth Vaus | 9,322 | 23.83 | ||
| Majority | 5,760 | 14.72 | |||
| Turnout | 79.10 | ||||
| Conservative hold | Swing | ||||
Elections in the 1950s
| General Election 1959: Hereford
Electorate: 45,340 | |||||
|---|---|---|---|---|---|
| Party | Candidate | Votes | % | ±% | |
| Conservative | James David Gibson-Watt | 17,763 | 49.3 | ||
| Liberal | Robin Day | 10,185 | 28.3 | ||
| Labour | John W Wardle | 8,097 | 22.4 | ||
| Majority | 7,578 | 21.0 | |||
| Turnout | 36,045 | 79.5 | |||
| Conservative hold | Swing | ||||
| Hereford by-election, 1956 | |||||
|---|---|---|---|---|---|
| Party | Candidate | Votes | % | ±% | |
| Conservative | James David Gibson-Watt | 12,129 | 44.3 | -7.5 | |
| Liberal | Humphrey Frank Owen | 9,979 | 36.4 | +11.6 | |
| Labour | Bryan Capewell Stanley | 5,277 | 19.3 | -4.1 | |
| Majority | 2,150 | 17.9 | |||
| Turnout | 27,385 | ||||
| Conservative hold | Swing | ||||
| General Election 1955: Hereford
Electorate: 44,242 | |||||
|---|---|---|---|---|---|
| Party | Candidate | Votes | % | ±% | |
| Conservative | James Purdon Lewes Thomas | 18,058 | 51.8 | ||
| Liberal | Humphrey Frank Owen | 8,658 | 24.8 | ||
| Labour | E.L.P. Seers | 8,154 | 23.4 | ||
| Majority | 9,400 | 27.0 | |||
| Turnout | 34,870 | 78.8 | |||
| Conservative hold | Swing | ||||
| General Election 1951: Hereford
Electorate: 44,579 | |||||
|---|---|---|---|---|---|
| Party | Candidate | Votes | % | ±% | |
| Conservative | James Purdon Lewes Thomas | 21,204 | 61.3 | ||
| Labour | William Pigott | 13,396 | 38.7 | ||
| Majority | 7,808 | 22.6 | |||
| Turnout | 77.6 | ||||
| Conservative hold | Swing | ||||
| General Election 1950: Hereford
Electorate: 44,059 | |||||
|---|---|---|---|---|---|
| Party | Candidate | Votes | % | ±% | |
| Conservative | James Purdon Lewes Thomas | 18,314 | 51.6 | ||
| Labour | William Pigott | 11,185 | 31.5 | ||
| Liberal | Cllr. Albert Edward Farr | 5,965 | 16.8 | ||
| Majority | 7,129 | 20.1 | |||
| Turnout | 80.5 | ||||
| Conservative hold | Swing | ||||
Elections in the 1940s
| General Election 1945: Hereford
Electorate: 48,574 | |||||
|---|---|---|---|---|---|
| Party | Candidate | Votes | % | ±% | |
| Conservative | James Purdon Lewes Thomas | 17,439 | 51.8 | ||
| Labour | William Pigott | 8,359 | 24.8 | ||
| Liberal | Archibald Pellow Marshall | 7,871 | 23.4 | ||
| Majority | 9,080 | 27.0 | |||
| Turnout | 69.3 | ||||
| Conservative hold | Swing | ||||
General Election 1939/40: Another General Election was required to take place before the end of 1940. The political parties had been making preparations for an election to take place from 1939 and by the end of this year, the following candidates had been selected; Conservative: James Purdon Lewes Thomas, Liberal: Archibald Pellow Marshall.
Election in the 1930s
| General Election 14 November 1935: Hereford
Electorate: 39,484 | |||||
|---|---|---|---|---|---|
| Party | Candidate | Votes | % | ±% | |
| Conservative | James Purdon Lewes Thomas | 18,234 | 61.84 | ||
| Liberal | Walter Leslie Dingley | 8,853 | 30.03 | ||
| Labour | George Clarke | 2,397 | 8.13 | ||
| Majority | 9,381 | 31.82 | |||
| Turnout | 74.67 | ||||
| Conservative hold | Swing | ||||
| General Election 27 October 1931: Hereford
Electorate: 38,033 Turnout %, | |||||
|---|---|---|---|---|---|
| Party | Candidate | Votes | % | ±% | |
| Conservative | James Purdon Lewes Thomas | 19,418 | 60.90 | ||
| Liberal | Humphrey Frank Owen | 12,465 | 39.10 | ||
| Majority | 6,953 | 21.81 | |||
| Turnout | 83.85 | ||||
| Conservative gain from Liberal | Swing | ||||
Election in the 1920s
| General Election 30 May 1929
Electorate 36,984 | |||||
|---|---|---|---|---|---|
| Party | Candidate | Votes | % | ±% | |
| Liberal | Humphrey Frank Owen | 14,208 | 48.7 | ||
| Conservative | Frederic Carnegie Romilly | 13,087 | 44.8 | ||
| Labour | Henry Cooper | 1,901 | 6.5 | ||
| Majority | 1,121 | 3.9 | |||
| Turnout | 78.9 | ||||
| General Election 29 October 1924
Electorate 29,083 | |||||
|---|---|---|---|---|---|
| Party | Candidate | Votes | % | ±% | |
| Conservative | Sir Samuel Roberts | 13,210 | 60.6 | +5.3 | |
| Liberal | John Howard Whitehouse | 8,604 | 39.4 | -0.6 | |
| Majority | 4,606 | ||||
| Turnout | |||||
| General Election 6 December 1923
Electorate 28,538 | |||||
|---|---|---|---|---|---|
| Party | Candidate | Votes | % | ±% | |
| Conservative | Sir Samuel Roberts | 11,448 | 55.3 | -20.9 | |
| Liberal | John Howard Whitehouse | 8,280 | 40.0 | +40.0 | |
| Labour | Sydney Box | 981 | 4.7 | -19.1 | |
| Majority | 3,168 | ||||
| Turnout | |||||
| General Election 15 November 1922
Electorate 27,774 | |||||
|---|---|---|---|---|---|
| Party | Candidate | Votes | % | ±% | |
| Conservative | Sir Samuel Roberts | 13,138 | 76.2 | ||
| Labour | James Jonas Dodd | 4,094 | 23.8 | ||
| Majority | 62.0 | ||||
| Turnout | |||||
| Hereford by-election, 1921
Electorate 27,316 | |||||
|---|---|---|---|---|---|
| Party | Candidate | Votes | % | ±% | |
| Conservative | Sir Samuel Roberts | 9,670 | 56.6 | ||
| Liberal | Ernest Wilfred Langford | 7,411 | 43.4 | ||
| Majority | |||||
| Turnout | 62.5 | ||||
Election in the 1910s
| General Election 14 December 1918:
Electorate 28,246 | |||||
|---|---|---|---|---|---|
| Party | Candidate | Votes | % | ±% | |
| Conservative | Charles Thornton Pulley | 11,680 | 75.8 | ||
| Labour | Sydney Box | 3,730 | 24.2 | ||
| Conservative hold | Swing | ||||
See also
External links
- UK Constituency Maps
- Hereford Liberal Democrats
- Hereford Conservatives
- Labour in Herefordshire
- UKIP West Midlands
- Herefordshire Green Party
Notes and references
- ↑ "UK General Election results April 1992". Richard Kimber's Political Science Resources. Politics Resources. 9 April 1992. Retrieved 6 December 2010.
Sources
- Robert Beatson, A Chronological Register of Both Houses of Parliament (London: Longman, Hurst, Res & Orme, 1807)
- D Brunton & D H Pennington, Members of the Long Parliament (London: George Allen & Unwin, 1954)
- Cobbett's Parliamentary history of England, from the Norman Conquest in 1066 to the year 1803 (London: Thomas Hansard, 1808)
- The Constitutional Year Book for 1913 (London: National Union of Conservative and Unionist Associations, 1913)
- F W S Craig, British Parliamentary Election Results 1832–1885 (2nd edition, Aldershot: Parliamentary Research Services, 1989)
- F W S Craig, British Parliamentary Election Results 1918–1949 (Glasgow: Political Reference Publications, 1969)
- Maija Jansson (ed.), Proceedings in Parliament, 1614 (House of Commons) (Philadelphia: American Philosophical Society, 1988)
- J E Neale, The Elizabethan House of Commons (London: Jonathan Cape, 1949)