Heat wave
| Part of the nature series |
| Weather |
|---|
| Calendar seasons |
| Tropical seasons |
| Storms |
| Precipitation |
| Topics |
| Weather portal |
A heat wave is a prolonged period of excessively hot weather, which may be accompanied by high humidity, especially in oceanic climate countries. While definitions vary,[1] a heat wave is measured relative to the usual weather in the area and relative to normal temperatures for the season. Temperatures that people from a hotter climate consider normal can be termed a heat wave in a cooler area if they are outside the normal climate pattern for that area.[2]
The term is applied both to routine weather variations and to extraordinary spells of heat which may occur only once a century. Severe heat waves have caused catastrophic crop failures, thousands of deaths from hyperthermia, and widespread power outages due to increased use of air conditioning. A heat wave is considered extreme weather, and a danger because heat and sunlight may overheat the human body.
Definitions
A definition based on Frich et al.'s Heat Wave Duration Index is that a heat wave occurs when the daily maximum temperature of more than five consecutive days exceeds the average maximum temperature by 5 °C (9 °F), the normal period being 1961–1990.[3]
A formal, peer-reviewed definition from the Glossary of Meteorology is:[4]
- A period of abnormally and uncomfortably hot and usually humid weather.
- To be a heat wave such a period should last at least one day, but conventionally it lasts from several days to several weeks. In 1900, A. T. Burrows more rigidly defined a “hot wave” as a spell of three or more days on each of which the maximum shade temperature reaches or exceeds 90 °F (32.2 °C). More realistically, the comfort criteria for any one region are dependent upon the normal conditions of that region.

In the Netherlands, a heat wave is defined as period of at least 5 consecutive days in which the maximum temperature in De Bilt exceeds 25 °C (77 °F), provided that on at least 3 days in this period the maximum temperature in De Bilt exceeds 30 °C (86 °F). This definition of a heat wave is also used in Belgium and Luxembourg.
In Denmark, a national heat wave (hedebølge) is defined as a period of at least 3 consecutive days of which period the average maximum temperature across more than fifty percent of the country exceeds 28 °C (82.4 °F) – the Danish Meteorological Institute further defines a "warmth wave" (varmebølge) when the same criteria are met for a 25 °C (77.0 °F) temperature,[5] while in Sweden, a heat wave is defined as at least 5 days in a row with a daily high exceeding 25 °C (77.0 °F).[6]
In the United States, definitions also vary by region; however, a heat wave is usually defined as a period of at least two or more days of excessively hot weather.[7] In the Northeast, a heat wave is typically defined as three consecutive days where the temperature reaches or exceeds 90 °F (32.2 °C), but not always as this ties in with humidity levels to determine a heat index threshold.[8] The same does not apply to drier climates. A heat storm is a Californian term for an extended heat wave. Heat storms occur when the temperature reaches 100 °F (37.8 °C) for three or more consecutive days over a wide area (tens of thousands of square miles). The National Weather Service issues heat advisories and excessive heat warnings when unusual periods of hot weather are expected.
In Adelaide, South Australia, a heat wave is defined as five consecutive days at or above 35 °C (95 °F), or three consecutive days at or over 40 °C (104 °F).[9]
In England and Wales, the Met Office operates a Heat Health Watch system which places each Local Authority region into one of four levels. Heatwave conditions are defined by the maximum daytime temperature and minimum nighttime temperature rising above the threshold for a particular region. The length of time spent above that threshold determines the particular level. Level 1 is normal summer conditions. Level 2 is reached when there is a 60% or higher risk that the temperature will be above the threshold levels for two days and the intervening night. Level 3 is triggered when the temperature has been above the threshold for the preceding day and night, and there is a 90% or higher chance that it will stay above the threshold in the following day. Level 4 is triggered if conditions are more severe than those of the preceding three levels. Each of the first three levels is associated with a particular state of readiness and response by the social and health services, and Level 4 is associated with more widespread response.[10]
How they occur

Heat waves form when high pressure aloft (from 10,000–25,000 feet (3,000–7,600 metres)) strengthens and remains over a region for several days up to several weeks. This is common in summer (in both Northern and Southern Hemispheres) as the jet stream 'follows the sun'. On the equator side of the jet stream, in the middle layers of the atmosphere, is the high pressure area.
Summertime weather patterns are generally slower to change than in winter. As a result, this mid-level high pressure also moves slowly. Under high pressure, the air subsides (sinks) toward the surface. This sinking air acts as a dome capping the atmosphere.
This cap helps to trap heat instead of allowing it to lift. Without the lift there is little or no convection and therefore little or no convective clouds (cumulus clouds) with minimal chances for rain. The end result is a continual build-up of heat at the surface that we experience as a heat wave.[11]
In the Eastern United States a heat wave can occur when a high pressure system originating in the Gulf of Mexico becomes stationary just off the Atlantic Seaboard (typically known as a Bermuda High). Hot humid air masses form over the Gulf of Mexico and the Caribbean Sea while hot dry air masses form over the desert Southwest and northern Mexico. The SW winds on the back side of the High continue to pump hot, humid Gulf air northeastward resulting in a spell of hot and humid weather for much of the Eastern States.[12]
In the Western Cape Province of South Africa, a heat wave can occur when a low pressure offshore and high pressure inland combine to form a Bergwind. The air warms as it descends from the Karoo interior, and the temperature will rise about 10 °C from the interior to the coast. Humidities are usually very low, and the temperatures can be over 40 °C in summer. The highest official temperatures recorded in South Africa (51.5 °C) was recorded one summer during a bergwind occurring along the Eastern Cape coastline.[13][14]
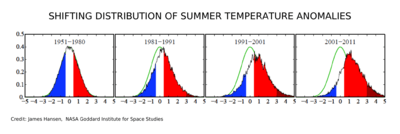
Global warming boosts the probability of extreme weather events, like heat waves, far more than it boosts more moderate events.[15][16][17]
Health effects
| temperature (°F) | |||||||||||||||||
| 80 | 82 | 84 | 86 | 88 | 90 | 92 | 94 | 96 | 98 | 100 | 102 | 104 | 106 | 108 | 110 | ||
|---|---|---|---|---|---|---|---|---|---|---|---|---|---|---|---|---|---|
| Relative Humidity (%) | |||||||||||||||||
| 40 | 80 | 81 | 83 | 85 | 88 | 91 | 94 | 97 | 101 | 105 | 109 | 114 | 119 | 124 | 130 | 136 | |
| 45 | 80 | 82 | 84 | 87 | 89 | 93 | 96 | 100 | 104 | 109 | 114 | 119 | 124 | 130 | 137 | ||
| 50 | 81 | 83 | 85 | 88 | 91 | 95 | 99 | 103 | 108 | 113 | 118 | 124 | 131 | 137 | |||
| 55 | 81 | 84 | 86 | 89 | 93 | 97 | 101 | 106 | 112 | 117 | 124 | 130 | 137 | ||||
| 60 | 82 | 84 | 88 | 91 | 95 | 100 | 105 | 110 | 116 | 123 | 129 | 137 | |||||
| 65 | 82 | 85 | 89 | 93 | 98 | 103 | 108 | 114 | 121 | 128 | 136 | ||||||
| 70 | 83 | 86 | 90 | 95 | 100 | 105 | 112 | 119 | 126 | 134 | |||||||
| 75 | 84 | 88 | 92 | 97 | 103 | 109 | 116 | 124 | 132 | ||||||||
| 80 | 84 | 89 | 94 | 100 | 106 | 113 | 121 | 129 | |||||||||
| 85 | 85 | 90 | 96 | 102 | 110 | 117 | 126 | 135 | |||||||||
| 90 | 86 | 91 | 98 | 105 | 113 | 122 | 131 | ||||||||||
| 95 | 86 | 93 | 100 | 108 | 117 | 127 | |||||||||||
| 100 | 87 | 95 | 103 | 112 | 121 | 132 | |||||||||||
The heat index (as shown in the table above) is a measure of how hot it feels when relative humidity is factored with the actual air temperature. Hyperthermia, also known as heat stroke, becomes commonplace during periods of sustained high temperature and humidity. Sweating is absent from 84–100% of those affected. Older adults, very young children, and those who are sick or overweight are at a higher risk for heat-related illness. The chronically ill and elderly are often taking prescription medications (e.g., diuretics, anticholinergics, antipsychotics, and antihypertensives) that interfere with the body's ability to dissipate heat.[18]
Heat edema presents as a transient swelling of the hands, feet, and ankles and is generally secondary to increased aldosterone secretion, which enhances water retention. When combined with peripheral vasodilation and venous stasis, the excess fluid accumulates in the dependent areas of the extremities. The heat edema usually resolves within several days after the patient becomes acclimated to the warmer environment. No treatment is required, although wearing support stocking and elevating the affected legs with help minimize the edema.
Heat rash, also known as prickly heat, is a maculopapular rash accompanied by acute inflammation and blocked sweat ducts. The sweat ducts may become dilated and may eventually rupture, producing small pruritic vesicles on an erythematous base. Heat rash affects areas of the body covered by tight clothing. If this continues for a duration of time it can lead to the development of chronic dermatitis or a secondary bacterial infection. Prevention is the best therapy. It is also advised to wear loose-fitting clothing in the heat. However, once heat rash has developed, the initial treatment involves the application of chlorhexidine lotion to remove any desquamated skin. The associated itching may be treated with topical or systemic antihistamines. If infection occurs a regimen of antibiotics is required.

Heat cramps are painful, often severe, involuntary spasms of the large muscle groups used in strenuous exercise. Heat cramps tend to occur after intense exertion. They usually develop in people performing heavy exercise while sweating profusely and replenishing fluid loss with non-electrolyte containing water. This is believed to lead to hyponatremia that induces cramping in stressed muscles. Rehydration with salt-containing fluids provides rapid relief. Patients with mild cramps can be given oral .2% salt solutions, while those with severe cramps require IV isotonic fluids. The many sport drinks on the market are a good source of electrolytes and are readily accessible.
Heat syncope is related to heat exposure that produces orthostatic hypotension. This hypotension can precipitate a near-syncopal episode. Heat syncope is believed to result from intense sweating, which leads to dehydration, followed by peripheral vasodilation and reduced venous blood return in the face of decreased vasomotor control. Management of heat syncope consists of cooling and rehydration of the patient using oral rehydration therapy (sport drinks) or isotonic IV fluids. People who experience heat syncope should avoid standing in the heat for long periods of time. They should move to a cooler environment and lie down if they recognize the initial symptoms. Wearing support stockings and engaging in deep knee-bending movements can help promote venous blood return.
Heat exhaustion is considered by experts to be the forerunner of heat stroke (hyperthermia). It may even resemble heat stroke, with the difference being that the neurologic function remains intact. Heat exhaustion is marked by excessive dehydration and electrolyte depletion. Symptoms may include diarrhea, headache, nausea and vomiting, dizziness, tachycardia, malaise, and myalgia. Definitive therapy includes removing patients from the heat and replenishing their fluids. Most patients will require fluid replacement with IV isotonic fluids at first. The salt content is adjusted as necessary once the electrolyte levels are known. After discharge from the hospital, patients are instructed to rest, drink plenty of fluids for 2–3 hours, and avoid the heat for several days. If this advice is not followed it may then lead to heat stroke.
One public health measure taken during heat waves is the setting-up of air-conditioned public cooling centers.
Mortality
Heat waves are the most lethal type of weather phenomenon, overall. Between 1992 and 2001, deaths from excessive heat in the United States numbered 2,190, compared with 880 deaths from floods and 150 from hurricanes.[19] The average annual number of fatalities directly attributed to heat in the United States is about 400.[20] The 1995 Chicago heat wave, one of the worst in US history, led to approximately 600 heat-related deaths over a period of five days.[21] Eric Klinenberg has noted that in the United States, the loss of human life in hot spells in summer exceeds that caused by all other weather events combined, including lightning, rain, floods, hurricanes, and tornadoes.[22][23] Despite the dangers, Scott Sheridan, professor of geography at Kent State University, found that less than half of people 65 and older abide by heat-emergency recommendations like drinking lots of water. In his study of heat-wave behavior, focusing particularly on seniors in Philadelphia, Phoenix, Toronto, and Dayton, Ohio, he found that people over 65 "don't consider themselves seniors." One of his older respondents said: "Heat doesn't bother me much, but I worry about my neighbors."[24]
According to the Agency for Health care Research and Quality, about 6,200 Americans are hospitalized each summer due to excessive heat, and those at highest risk are poor, uninsured or elderly.[25] More than 70,000 Europeans died as a result of the 2003 European heat wave.[26] Concern is now focusing on predicting the future likelihood of heat waves and their severity. In addition, because in most of the world most of those suffering the impacts of a heat wave will be inside a building, and this will modify the temperatures they are exposed to, there is the need to link climate models to building models. This means producing example time series of future weather.[27][28] Other work has shown that future mortality due to heat waves could be reduced if buildings were better designed to modify the internal climate, or the occupants better educated about the issues, so they took action in time.[29][30]
- Underreporting and "Harvesting" effect
The number of heat fatalities is likely highly underreported due to lack of reports and misreports.[20] Part of the mortality observed during a heat wave, however, can be attributed to a so-called "harvesting effect", a term for a short-term forward mortality displacement. It has been observed that for some heat waves, there is a compensatory decrease in overall mortality during the subsequent weeks after a heat wave. Such compensatory reduction in mortality suggests that heat affects especially those so ill that they "would have died in the short term anyway".[31]
Another explanation for underreporting is the social attenuation in most contexts of heat waves as a health risk. As shown by the deadly French episode of heat wave in 2003, heat wave dangers result from the intricate association of natural and social factors.[32]
Psychological and sociological effects
In addition to physical stress, excessive heat causes psychological stress, to a degree which affects performance, and is also associated with an increase in violent crime.[33]
Power outages
Abnormally hot temperatures cause electricity demand to increase during the peak summertime hours of 4 to 7 p.m. when air conditioners are straining to overcome the heat. If a hot spell extends to three days or more, however, nighttime temperatures do not cool down, and the thermal mass in homes and buildings retains the heat from previous days. This heat build-up causes air conditioners to turn on earlier and to stay on later in the day. As a result, available electricity supplies are challenged during a higher, wider, peak electricity consumption period.
Heat waves often lead to electricity spikes due to increased air conditioning use, which can create power outages, exacerbating the problem. During the 2006 North American heat wave, thousands of homes and businesses went without power, especially in California. In Los Angeles, electrical transformers failed, leaving thousands without power for as long as five days.[34] The 2009 South Eastern Australia Heat Wave caused the city of Melbourne, Australia to experience some major power disruptions which left over half a million people without power as the heat wave blew transformers and overloaded a power grid.
Wildfires
If a heat wave occurs during a drought, which dries out vegetation, it can contribute to bushfires and wildfires. During the disastrous heat wave that struck Europe in 2003, fires raged through Portugal, destroying over 3,010 square kilometres (1,160 sq mi) or 301,000 hectares (740,000 acres) of forest and 440 square kilometres (170 sq mi) or 44,000 hectares (110,000 acres) of agricultural land and causing an estimated €1 billion worth of damage.[35] High end farmlands have irrigation systems to back up crops with.
Physical damage
Heat waves can and do cause roads and highways to buckle and melt,[36] water lines to burst, and power transformers to detonate, causing fires. See the 2006 North American heat wave article about heat waves causing physical damage.
In the 2013 heatwave in England, gritters (normally only seen in snow) were sent out to grit melting tarmac roads.
History
19th century
1896 Eastern North America heat wave killed 1500 people in august 1896.
20th century
1923/1924 - During a period of 160 such days from 31 October 1923 to 7 April 1924, the Western Australian town of Marble Bar set a world record for the most consecutive days above 100 °F (38 °C).[37]
1936 - The 1936 North American heat wave during the Dust Bowl, followed one of the coldest winters on record—the 1936 North American cold wave. Massive heat waves across North America were persistent in the 1930s, many mid-Atlantic/Ohio valley states recorded their highest temperatures during July 1934. The longest continuous string of 100 °F (38 °C) or higher temperatures was reached for 101 days in Yuma, Arizona during 1937 and the highest temperatures ever reached in Canada were recorded in two locations in Saskatchewan in July 1937.
1950s - A prolonged severe drought and heat wave occurred in the early 1950s throughout the central and southern United States. In some areas it was drier than during the Dust Bowl and the heat wave in most areas was within the top five on record. The heat was particularly severe in 1954 with 22 days of temperatures exceeding 100 °F (38 °C) covering significant parts of eleven states. On 14 July, the thermometer reached 117 °F (47 °C) at East St. Louis, Illinois, which remains the record highest temperature for that state.[38][39][40]
1972 - The heat waves of 1972 in New York and Northeastern United States were significant. Almost 900 people perished; the heat conditions lasted almost 16 days, aggravated by very high humidity levels.
1976 - The 1976 United Kingdom heat wave was one of the hottest in living memory and was marked by constant blues skies from May until September when dramatic thunderstorms signalled the heat wave's end.
1980 - An estimated 1,000 people perished in the 1980 United States heat wave and drought, which impacted the central and eastern United States. Temperatures were highest in the southern plains. From June through September, temperatures remained above 90 °F (32 °C) all but two days in Kansas City, Missouri. The Dallas/Fort Worth area experienced 42 consecutive days with high temperatures above 100 °F (38 °C), with temperatures reaching 117 °F (47 °C) at Wichita Falls, Texas on 28 June. Economic losses were $20 billion (1980 dollars).[41]
1983 - During the Summer of 1983 temperatures over 100 °F (38 °C) were common across Iowa, Missouri, Illinois, Michigan, Wisconsin, Indiana, Ohio, Minnesota, Nebraska and certain parts of Kentucky; the summer of 1983 remains one of the hottest summers ever recorded in many of the states affected. The hundred-degree readings were accompanied by very dry conditions associated with drought affecting the Corn Belt States and Upper Midwest. The heat also affected the Southeastern U.S. and the Mid-Atlantic states as well that same summer. New York Times represented articles about the heat waves of 1983 affecting the central United States.[42]
1987 - prolonged heat wave from 20 to 31 July in Greece, with more than 1.000 deaths in the area of Athens. The maximum temperature measured was 41.6 °C at 23 July at the center of Athens and in the suburb of Nea Philadelphia, 8 km northest was 43.6 °C at 27 July, and were combined with high minima, with the highest being 30.2 °C in the center of Athens at 27 July and 29.9 °C at 24 July at Nea Philadelfia. The lowest minimum was 25.6 °C at the center of Athens. Moreover, humidity was high and wind speeds low, contributing to human discomfort, even during the night.[43]
1988 - intense heat spells in combination with the drought of 1988, reminiscent of the dust bowl years caused deadly results across the United States. Some 5,000 to 10,000 people perished because of constant heat across the United States although-according to many estimates-total death reports run as high as next to 17,000 deaths.[44]
1995 - The 1995 Chicago heat wave produced record high dew point levels and heat indices in the Chicago area and Wisconsin. The lack of emergency cooling facilities and inadequate response from civic authorities to the senior population, particularly in lower income neighborhoods in Chicago and other Midwest cities, lead to many deaths.
1999 - a heat wave and drought in the eastern United States during the summer of 1999. Rainfall shortages resulted in worst drought on record for Maryland, Delaware, New Jersey, and Rhode Island. The state of West Virginia was declared a disaster area. 3,810,000 acres (15,400 km2) were consumed by fire as of mid-August. Record heat throughout the country resulted in 502 deaths nationwide.[45][46]
2000 - in late Summer 2000, a heat wave occurred in the southern United States, breaking many cities' all-time maximum temperature records.
21st century
2001–2009
- In early August 2001 an intense heatwave hit the eastern seaboard of the United States and neighboring southeastern Canada. For over a week, temperatures climbed above 35 °C (95 °F) combined with stifling high humidity. Newark, New Jersey tied its all-time record high temperature of 41 °C (106 °F) with a heat index of over 50 °C (122 °F).[47]
- In April 2002 a summer-like heat wave in spring affected much of the Eastern United States.
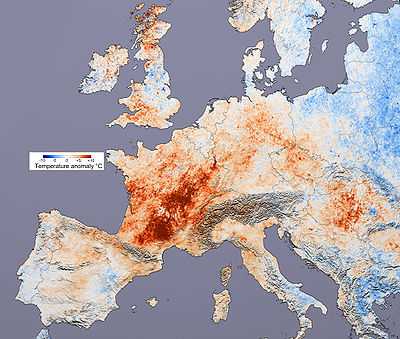
- More than 46,000 people[48] and perhaps in excess of 70,000[26] died in the European heat wave of 2003. Much of the heat was concentrated in France, where nearly 15,000 people died.[49] In Portugal, the temperatures reached as high as 47 °C (117 °F) in the south.
- The European heat wave of 2006 was the second massive heat wave to hit the continent in four years, with temperatures rising to 40 °C (104 °F) in Paris; in Ireland, which has a moderate maritime climate, temperatures of over 32 °C (90 °F) were reported. Temperatures of 35 °C (95 °F) were reached in the Benelux and Germany (in some areas 38 °C (100 °F)), while Great Britain recorded 37 °C (99 °F). Many heat records were broken (including the hottest ever July temperature in Great Britain) and many people who experienced the heat waves of 1976 and 2003 drew comparisons with them. Highest average July temperatures were recorded at many locations in Great Britain, Netherlands, Denmark, Sweden and Germany.
- The 2006 North American heat wave affected a wide area of the United States and parts of neighboring Canada during July and August 2006. Over 220 deaths were reported. Temperatures in some parts of South Dakota exceeded 115 °F (46 °C). Also, California experienced temperatures that were extraordinarily high, with records ranging from 100 to 130 °F (38 to 54 °C). On 22 July, the County of Los Angeles recorded its highest temperature ever at 119 °F (48 °C). Humidity levels in California were also unusually high, although low compared with normal gulf coast/eastern seaboard summer humidity they were significant enough to cause widespread discomfort.[50]
- The European heat wave of 2007 affected primarily south-eastern Europe during late June through August. Bulgaria experienced its hottest year on record, with previously unrecorded temperatures above 45 °C (113 °F). The 2007 Greek forest fires were associated with the heat wave.
- During the 2007 Asian heat wave, the Indian city of Datia experienced temperatures of 48 °C (118 °F).
- In January 2008, Alice Springs in Australia's Northern Territory recorded ten consecutive days of temperatures above 40 °C (104 °F) with the average temperature for that month being 39.8 °C (103.6 °F). In March 2008, Adelaide, South Australia experienced maximum temperatures of above 35 °C (95 °F) for fifteen consecutive days, seven days more than the previous longest stretch of 35 °C (95 °F) days. The March 2008 heat wave also included eleven consecutive days above 38 °C (100 °F).[51] The heat wave was especially notable because it occurred in March, an autumn month, in which Adelaide averages only 2.3 days above 35 °C (95 °F).[52]
- The eastern United States experienced an early Summer heat wave from 6–10 June 2008 with record temperatures.[53] There was a heat wave in Southern California beginning late June,[54] which contributed to widespread fires. On 6 July, a renewed heat wave was forecast, which was expected to affect the entire state.[55][56]
- In early 2009, Adelaide, South Australia was hit by a heat wave with temperatures reaching 40+ °C for six days in a row, while many rural areas experienced temperatures hovering around about mid 40s °C (mid 110s°F). Kyancutta on the Eyre Peninsula endured at least one day at 48 °C, with 46 and 47 being common in the hottest parts of the state. Melbourne, in neighbouring Victoria recorded 3 consecutive days over 43 °C (109 °F), and also recorded its highest ever temperature 8 days later in a secondary heatwave, with the mercury peaking at 46.4 °C (115.5 °F). During this heat wave Victoria suffered from large bushfires which claimed the lives of 173 people and destroyed more than 2,500 homes. There were also over half a million people without power as the heatwave blew transformers and the power grid was overloaded.
- In August 2009, Argentina experienced a period of unusual and exceptionally hot weather during 24–30 August, during the Southern Hemisphere winter, just a month before Spring,[57] when an unusual and unrecorded winter heat wave hit the country. A shot of tropical heat drawn unusually far southward hiked temperatures 22 degrees Celsius (40 degrees Fahreinheit) above normal in the city of Buenos Aires and across the northern-centre regions of the country. Several records were broken. Even though normal high temperatures for late August are in the lower 15 °C (59 °F), readings topped 30 °C (86 °F) degrees at midweek, then topped out above 32 °C (90 °F) degrees during the weekend.[58] Temperatures hit 33.8 °C (92.8 °F) on 29 August and finally 34.6 °C (94.3 °F) on 30 August in Buenos Aires, making it the hottest day ever recorded in winter breaking the 1996 winter record of 33.7 °C (92.7 °F). In the city of Santa Fe, 38.3 °C (100.9 °F) degrees on 30 August was registered, notwithstanding the normal high in the upper 15 °C/60°Fs. As per the Meteorological Office of Argentina, August 2009 has been the warmest month during winter since official measurements began.[59]
2010–Present
- The Northern Hemisphere summer heat wave of 2010 affected many areas across the Northern Hemisphere, especially parts of Northeastern China and European Russia.
- Starting in May 2010, records were being set. On 26 May, at Mohenjo-daro, Sindh province in Pakistan a national record high temperature of 53.5 °C (128.3 °F) occurred.
- In June 2010, Eastern Europe experienced very warm conditions. Ruse, Bulgaria hit 36.6 °C (97.9 °F) on the 13th making it the warmest spot in Europe. Other records broken on the 13th include Vidin, Bulgaria at 35.8 °C (96.4 °F), Sandanski, Bulgaria hitting 35.5 °C (95.9 °F), Lovech and Pazardzhik, Bulgaria at 35.1 °C (95.2 °F) as well as the capital, Sofia, hitting 33.3 °C (91.9 °F). The heat came from the Sahara desert and was not associated with rain. This helped the situation with high water levels in that part of the continent.[60] On the 14th, several cities were once again above the 35 °C (95 °F) mark even though they did not break records. The only cities in Bulgaria breaking records were Musala peak hitting 15.2 °C (59.4 °F) and Elhovo hitting 35.6 °C (96.1 °F).[61] On the 15th, Ruse, Bulgaria peaked at 37.2 °C (99.0 °F). Although it was not a record, this was the highest temperature recorded in the country. Five Bulgarian cities broke records that day: Ahtopol hit 28.6 °C (83.5 °F), Dobrich was 33.8 °C (92.8 °F), Karnobat hit 34 °C (93 °F), Sliven hit 35 °C (95 °F) and Elhovo recorded 36.1 °C (97.0 °F).[62]
- From 4 to 9 July 2010, the majority of the American East Coast, from the Carolinas to Maine, was gripped in a severe heat wave. Philadelphia, New York, Baltimore, Washington, Raleigh, and even Boston eclipsed 100 °F (38 °C). Many records were broken, some of which dated back to the 19th century, including Wilmington, Delaware's temperature of 103 °F (39 °C) on Wednesday, 7 July, which broke the record of 97 °F (36 °C) from 1897. Philadelphia and New York eclipsed 100 °F (38 °C) for the first time since 2001. Fredrick, Maryland, and Newark, New Jersey, among others topped the century mark (37.8 Celsius) for four days in a row.[63]
- The 2011 North American heat wave brought record heat to the Midwestern United States, Eastern Canada, and much of the Eastern Seaboard.
- A record-breaking heat wave hit Southwestern Asia in late July and early August 2011, with temperatures in Iraq exceeding 120 °F (49 °C),[64] and an "asphalt-melting, earth-parching, brain-scrambling heat of midsummer" in Tbilisi, Georgia.[65] The Iraqis were further challenged by pressure to fast during Ramadan, despite heat of 124 °F (51 °C) in Baghdad and 126 °F (52 °C) in Diwaniya on 4 August.[64] The extreme heat inspired conspiracy theories of the government corruption in Iraq and retaliation from the United States government;[64] and, in Georgia, the Apocalypse, mutant locusts caused by Chernobyl, snakes imported by unseen enemies, and sun spots.[65]
- Most parts of the United Kingdom experienced an Indian summer between September and October 2011. The heat wave resulted in a new record high temperature for October at 30 °C.[66]

- In March 2012, one of the greatest heat waves was observed in many regions of North America. First very warm air pushed northward west of the Great Lakes region, and subsequently spread eastward. This air mass movement was propelled by an unusually intense low level southerly jet that stretched from Louisiana to western Wisconsin. Once this warm surge inundated the area, a remarkably prolonged period of record setting temperatures ensued.[67] NOAA's National Climate Data Center reported that over 7000 daily record high temperatures were broken over the U.S. from 1 March thru 27 March.[67] In some places the temperature exceeded 30 °C (86 °F) with anomalies up to +22 °C. Temperature records across much of southern Canada were also demolished.[68]
- In March 2012, the United Kingdom experienced a heat wave with temperature anomalies of +10 °C in many places.[69]
- In late June 2012, much of North America began experiencing a heat wave, as heat spread east from the Rocky Mountains. During the heat wave, the June 2012 North American derecho caused violent storms that downed trees and power lines, leaving 3 million people in the eastern U. S. without power on 30 June.[70] The heat lasted until Mid-August in some parts of the country.
- The Australian summer of 2012-2013, known as the Angry Summer or Extreme Summer, resulted in 123 weather records being broken over a 90-day period, including the hottest day ever recorded for Australia as a whole, the hottest January on record, the hottest summer average on record, and a record seven days in row when the whole continent averaged above 39 °C.[71][72] Single-day temperature record were broken in dozens of towns and cities, as well as single-day rainfall records, and several rivers flooded to new record highs.[71] From 28 December 2012 through at least 9 January 2013 Australia has faced its most severe heatwave in over 80 years, with a large portion of the nation recording high temperature reading above 40 °C to 45 °C or greater in some areas, a couple spots have also neared 50 °C. This extreme heat has also resulted in a 'flash' drought across southern and central areas of the country and has sparked several massive wildfires due to periodic high winds.[73]
- In late June 2013, an intense heat wave struck Southwestern United States. Various places in Southern California reached up to 122 °F (50 °C).[74] On 30 June, Death Valley, California hit 129.2 °F (54.0 °C) which is the hottest temperature ever recorded on Earth during the month of June. It was five degrees shy of the world record highest temperature measured in Death Valley, which was 134 °F (57 °C), recorded in July 1913.[75]
- Around Canada Day 2013, the same heatwave that hit the Southwestern United States moved north and hit southern British Columbia, Washington and Oregon. Temperatures in BC hit 40 °C (104 °F) in Lytton on 1 July 2013, and on 2 July 2013, the city of Penticton hit 38 °C (100 °F), with both Summerland and Osoyoos hitting the same. The Tri-Cities in Washington were among the hottest, with temperatures around 110 °F (43 °C).[76][77][78]
- In China from July to August 2013, the South continued to experience an unusually severe heat wave with exceptionally high temperatures. In multiple regions of Zhejiang, Chongqing, Shanghai, Hunan and other areas the temperatures soared to over 40 degrees Celsius and lasted for a long time. Xinchang and Zhejiang endured extreme hot weather of 44.1 ℃, on 8 August Ningbo reached a new all-time record high temperature of 43.5 ℃, Changsha, Hunan in July 2013 achieved a high temperature "Grand Slam", all 31 days in July set a new daily record high temperature of over 40 ℃. Hangzhou experienced 56 consecutive days over 40 ℃ while Shanghai shattered 140 years of meteorological records to set a new all-time record high temperature of 40.8 ℃. Sustained high temperatures caused many people, especially the elderly to get heatstroke or sunstroke, seriously affecting millions of lives. Many areas throughout China endured record high temperatures resulting in multiple continuous meteorological department issued high temperature orange or red alerts. 2013 saw a wide range of abnormally hot temperatures not seen for the past 60 years of national meteorological records dating back to 1951.
- In July 2013, the United Kingdom experienced the warmest July since 2006.[79]
See also
Notes
- ↑ Meehl, George A.; Tebaldi, Claudia (13 August 2004). "More Intense, More Frequent, and Longer Lasting Heat Waves in the 21st Century". Science 305 (5686): 994–7. Bibcode:2004Sci...305..994M. doi:10.1126/science.1098704. PMID 15310900.
- ↑ Robinson, Peter J. (April 2001). "On the Definition of a Heat Wave". Journal of Applied Meteorology (American Meteorological Society) 40 (4): 762–775. Bibcode:2001JApMe..40..762R. doi:10.1175/1520-0450(2001)040<0762:OTDOAH>2.0.CO;2. ISSN 1520-0450.
- ↑ Frich, A.; L.V. Alexander, P. Della-Marta, B. Gleason, M. Haylock, A.M.G. Klein Tank, and T. Peterson (January 2002). "Observed coherent changes in climatic extremes during the second half of the twentieth century" (PDF). Climate Research 19: 193–212. doi:10.3354/cr019193.
- ↑ Glickman, Todd S. (June 2000). Glossary of Meteorology. Boston: American Meteorological Society. ISBN 1-878220-49-7.
- ↑ "Danmark får varme- og hedebølge". dmi.dk (in Danish). Danish Meteorological Institute. 22 July 2008. Retrieved 18 July 2013.
- ↑ "Värmebölja | Klimat | Kunskapsbanken | SMHI" (in Swedish). Smhi.se. Retrieved 17 July 2013.
- ↑ "Glossary - NOAA's National Weather Service". Weather.gov. 25 June 2009. Retrieved 17 July 2013.
- ↑ Singer, Stephen. "Half the country wilts under unrelenting heat". Yahoo!.
- ↑ "Extreme Heat Services for South Australia". Bom.gov.au. 15 January 2010. Retrieved 17 July 2013.
- ↑ "Heat-health watch". Met Office. 31 August 2011. Retrieved 17 July 2013.
- ↑ "Heat Index". US National Weather Service.
- ↑ "Heat Index". Pasquotank County, NC, U. S. Website.
- ↑ "Bergwind Info". 1stweather.com.
- ↑ "Natural Hazards - Heat Wave". City of Cape Town, South Africa Website.
- ↑ "Has global warming brought an early summer to the US?". New Scientist.
- ↑ Global Warming Makes Heat Waves More Likely, Study Finds 10 July 2012 NYT
- ↑ James Hansen; Makiko Sato; Reto Ruedy (August 2012). "Perception of climate change". Proceedings of the National Academy of Sciences of the United States of America (National Academy of Sciences) 109 (32). Bibcode:2012PNAS..109E2415H. doi:10.1073/pnas.1205276109. Retrieved 10 August 2012.
- ↑ "Extreme Heat". FEMA:Are You Ready?. Retrieved 27 July 2006.
- ↑ "Hot Weather Tips and the Chicago Heat Plan". About.com. Retrieved 27 July 2006.
- ↑ 20.0 20.1 Basu, Rupa; Jonathan M. Samet (2002). "Relation between Elevated Ambient Temperature and Mortality: A Review of the Epidemiologic Evidence". Epidemiologic Reviews (Johns Hopkins Bloomberg School of Public Health) 24 (2): 190–202. doi:10.1093/epirev/mxf007. PMID 12762092.
- ↑ Near-Fatal Heat Stroke during the 1995 Heat Wave in Chicago. Annals of Internal Medicine Vol. 129 Issue 3
- ↑ Klinenberg, Eric (2002). Heat Wave: A Social Autopsy of Disaster in Chicago. Chicago, IL: Chicago University Press. ISBN 0-226-44321-3.
- ↑ Dead Heat: Why don't Americans sweat over heat-wave deaths? By Eric Klinenberg. Slate.com. Posted Tuesday, 30 July 2002
- ↑ Floods, Tornadoes, Hurricanes, Wildfires, Earthquakes... Why We Don't Prepare By Amanda Ripley. Time. 28 August 2006.
- ↑ Most People Struck Down by Summer Heat Are Poor Newswise, Retrieved on 9 July 2008.
- ↑ 26.0 26.1 Robine, Jean-Marie; Siu Lan K. Cheung, Sophie Le Roy, Herman Van Oyen, Clare Griffiths, Jean-Pierre Michel, François Richard Herrmann (2008). "Death toll exceeded 70,000 in Europe during the summer of 2003". Comptes Rendus Biologies 331 (2): 171–178. doi:10.1016/j.crvi.2007.12.001. ISSN 1631-0691. PMID 18241810.
- ↑ Eames, M., Kershaw, T. J. and Coley, D., 2012. A comparison of future weather created from morphed observed weather and created by a weather generator. Building and Environment
- ↑ Eames, M., Kershaw, T. J. and Coley, D., 2011. On the creation of future probabilistic design weather years from UKCP09. Building Services Engineering Research and Technology
- ↑ Coley, D., Kershaw, T. J. and Eames, M., 2012. A comparison of structural and behavioural adaptations to future proofing buildings against higher temperatures. Building and Environment, 55, pp. 159-166.
- ↑ Coley, D. and Kershaw, T. J., 2010. Changes in internal temperatures within the built environment as a response to a changing climate. Building and Environment, 45 (1), pp. 89-93.
- ↑ Huygens, Maud M.T.E.; Pim Martens; Dieneke Scram; Matty P. Weinberg; Anton E. Kunst (May 2001). "The Impact of Heat Waves and Cold Spells on Mortality Rates in the Dutch Population". Environmental Health Perspectives (National Institute of Environmental Health Sciences) 109 (5): 463–470. doi:10.2307/3454704. JSTOR 3454704. PMC 1240305. PMID 11401757.
- ↑ Poumadère, M., Mays, C., Le Mer, S. and Blong, R. (2005), The 2003 Heat Wave in France: Dangerous Climate Change Here and Now. Risk Analysis, 25: 1483–1494. doi:10.1111/j.1539-6924.2005.00694.x
- ↑ Simister, John; Cary Cooper (October 2004). "Thermal stress in the U.S.A.: effects on violence and on employee behaviour". Stress and Health (International Society for the Investigation of Stress) 21 (1): 3–15. doi:10.1002/smi.1029.
- ↑ Doan, Lynn; Covarrubias, Amanda (27 July 2006). "Heat Eases, but Thousands of Southern Californians Still Lack Power". Los Angeles Times. Retrieved 16 June 2014.
- ↑ Bell, M.; A. Giannini; E. Grover; M. Hopp; B. Lyon; A. Seth (September 2003). "Climate Impacts". IRI Climate Digest (The Earth Institute). Retrieved 28 July 2006.
- ↑ BBC News - Who, what, why: When does tarmac melt?
- ↑ "Marble Bar heatwave, 1923–1924". Australian Climate Extremes. Bureau of Meteorology. Retrieved 21 September 2008.
- ↑ Westcott, Nancy E. (July 2011). "The Prolonged 1954 Midwestern U.S. Heat Wave: Impacts and Responses". Wea. Climate Soc. 3 (3): 165–76. doi:10.1175/WCAS-D-10-05002.1.
- ↑ "Lessons Learned from 1950s' Heat Wave Show Planning Needed for Future Severe Events" (Press release). Illinois State Water Survey. 18 May 2011. Retrieved 4 November 2011.
- ↑ Westcott, Nancy (19 January 2010). "Impacts of the 1954 Heat Wave". 18th Conference on Applied Climatology. Atlanta, GA: American Meteorological Society.
- ↑ "Billion Dollar U.S. Weather Disasters". National Climatic Data Center. Retrieved 15 July 2010.
- ↑ "St. Louis Bears Brunt of Heat Wave as U.S. Toll Rises". New York Times. 24 July 1983. Retrieved 15 April 2009.
- ↑ Andreas Matzarakis and Helmut Mayer (1991). "The extreme heat wave of Athens in July 1987 from the point of view of Human Biometrology". Atmospheric Environment 25B (2): 203–211.
- ↑ "Billion Dollar U.S. Weather Disasters". National Climatic Data Center. Retrieved 14 July 2008.
- ↑ http://www.ncdc.noaa.gov/img/climate/research/1999/sum/fsodtsum99_pg.gif
- ↑ http://www.ncdc.noaa.gov/img/climate/research/1999/sum/fsodpsum99_pg.gif
- ↑ http://www.ncdc.noaa.gov/img/climate/research/2001/heatwave/daily_max_anom_aug8_pg.gif
- ↑ Robine, Jean-Marie; Siu Lan K. Cheung, Sophie Le Roy, Herman Van Oyen, Clare Griffiths, Jean-Pierre Michel, François Richard Herrmann (2008). "Death toll exceeded 46,000 in Europe during the summer of 2003". Comptes Rendus Biologies 331 (2): 171–178. doi:10.1016/j.crvi.2007.12.001. ISSN 1631-0691. PMID 18241810.
- ↑ French heat toll almost 15,000 BBC News. 25 September 2003.
- ↑ Pool, Bob (26 July 2006). "In Woodland Hills, It's Just Too Darn Hot". Los Angeles Times. Retrieved 28 July 2006.
- ↑ "Adelaide, South Australia March 2008 Daily Weather Observations". Bureau of Meteorology. 21 April 2008. Archived from the original on 12 March 2008. Retrieved 24 April 2008.
- ↑ "Climate statistics for Australian locations". Bureau of Meteorology. 23 April 2008. Retrieved 24 April 2008.
- ↑ , .
- ↑ Heat wave continues to blister SoCal, USA Today, 19 June 2008.
- ↑ Heat wave coming to scorched California, UPI.com
- ↑ Bay Area Braces For 'Scorchers' As Temps Rise, cbs5.com, 7 July 2008.
- ↑ La temperatura llego a 34.7° y ya es un record/Clarin.com
- ↑ StarTribune
- ↑ Situacion extrema climatica en Argentina durante Agosto 2009 (In Spanish)
- ↑ Жега мори цяла Европа(In Bulgarian)
- ↑ Топло: над 35 градуса на много места в страната (In Bulgarian)
- ↑ "bTV - Времето - Централна емисия - 15.06.10". Btv.bg. 15 June 2010. Retrieved 17 July 2013.
- ↑ "Highlights of the Great Eastern Heat Wave". Accuweather.com. Retrieved 17 July 2013.
- ↑ 64.0 64.1 64.2 Schmidt, Michael (3 August 2011). "Heat [Wave] And Fasting Add to Woes Of Iraqis". New York Times. Retrieved 4 August 2011.
- ↑ 65.0 65.1 Barry, Ellen (3 August 2011). "Out of a Swelter Come Apolcalyptic Visions". New York Times. Retrieved 4 August 2011.
- ↑ "UK weather returns to normal after record-breaking heatwave". The Guardian. 3 October 2011.
- ↑ 67.0 67.1 Meteorological March Madness 2012, NOAA Research, 2 April 2012
- ↑ "Historic Heat in North America Turns Winter to Summer". NASA Earth Observatory. 21 March 2012. Retrieved 23 March 2012.
- ↑ "At 22.8°C Scotland breaks record for March weather". Herald Scotland. 26 March 2012. Retrieved 26 March 2012.
- ↑
- ↑ 71.0 71.1 Jessica Aldred (7 March 2013). Australia links 'angry summer' to climate change – at last. The Guardian. Guardian News and Media. Retrieved 24 April 2013.
- ↑ 9 March 2013. Australia's 'angry' summer continues. stuff.co.nz. Fairfax Media. Retrieved 24 April 2013.
- ↑ "Australia wildfires rage as temperatures reach 'catastrophic' level". The Guardian. 8 January 2013.
- ↑ Tata, Samantha. Palm Springs Hits 122 Degrees as SoCal Temperature Records Shatter. NBC Los Angeles. 30 June 2013. Retrieved on 4 July 2013.
- ↑ "Dr. Jeff Masters' WunderBlog : Historic Heat Wave Responsible for Death Valley's 129°F Gradually Weakening | Weather Underground". Wunderground.com. Retrieved 17 July 2013.
- ↑ "Record-toppling heat heads north, and it's 'just going to get hotter' - U.S. News". Usnews.nbcnews.com. 30 June 2013. Retrieved 17 July 2013.
- ↑ The Canadian Press (2 July 2013). "Heat wave shatters temperature records across B.C. - British Columbia - CBC News". Cbc.ca. Retrieved 17 July 2013.
- ↑ "AM 1150 - News Talk Sports :: Hot Weather on Tuesday Sets Records in South Okanagan :: Penticton News Story". Am1150.ca. Retrieved 17 July 2013.
- ↑ http://www.metoffice.gov.uk/news/releases/archive/2013/warm-july-stats
- 'Heat Dome' seals in sweltering temperatures
- Klinenberg, Eric (2002). Heat Wave: A Social Autopsy of Disaster in Chicago. Chicago: University of Chicago Press. ISBN 0-226-44321-3.
External links
- FEMA: Extreme Heat
- Hot Weather Tips
- Social & Economic Costs of Temperature Extremes from "NOAA Socioeconomics" website initiative
- Study: Global Warming to Bring Increased Heat Waves to U.S. – video report by Democracy Now!
- Wu, Zhiwei et al. (2012). "Heat wave frequency variability over North America: Two distinct leading modes". J. Geophys. Res. 117 (D02102). Bibcode:2012JGRD..11702102W. doi:10.1029/2011JD016908.
- Global Warming Makes Heat Waves More Likely, Study Finds 10 July 2012 NYT, regarding effects of global warming.
- The Maths Behind the Heat Wave
| ||||||||||||||||||||||||||