Hazel Grove (UK Parliament constituency)
| Hazel Grove | |
|---|---|
|
County constituency for the House of Commons | |
|
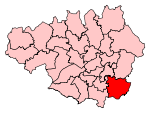
Boundary of Hazel Grove in Greater Manchester. | |
|
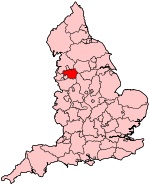
Location of Greater Manchester within England. | |
| County | Greater Manchester |
| Electorate | 62,422 (December 2010)[1] |
| Major settlements | Bredbury, Romiley, Hazel Grove, Marple and Offerton |
| Current constituency | |
| Created | 1974 |
| Member of parliament | Andrew Stunell (Liberal Democrat) |
| Number of members | One |
| Created from | Cheadle |
| Overlaps | |
| European Parliament constituency | North West England |
Hazel Grove is a constituency[n 1] in Greater Manchester, England represented in the House of Commons of the UK Parliament since 1997 by Andrew Stunell, a Liberal Democrat.[n 2]
Boundaries
The constituency was created in 1974 following a Boundary Commission report published in 1969. It took areas previously within the Cheadle constituency. When created, it was defined as consisting of the Urban Districts of Bredbury and Romiley, Hazel Grove and Bramhall, and Marple.
In 1983, the constituency lost the area of Bramhall back to the redrawn Cheadle constituency. In return it gained some areas formerly in Stockport South. It was defined as the following wards of the Metropolitan Borough of Stockport: Bredbury, Great Moor, Hazel Grove, North Marple, Romiley and South Marple. A minor boundary change in 1997 was made by the village of Lower Cliffe but this affected only a single registered voter. The current constituency consists of the following six wards of Stockport Metropolitan Borough Council: Bredbury and Woodley, Bredbury Green and Romiley, Hazel Grove, Marple North, Marple South and Offerton.
History
The constituency was established in time for the February 1974 general election, having previously formed part of the Cheadle constituency. At that election, the seat was won by Michael Winstanley of the Liberal Party. Winstanley only held it for a few months, because at the general election October 1974 he lost to the Conservatives' Tom Arnold.
Arnold held the seat until 1997, although (with the exception of the 1979 election) this was with small majorities over the local Liberals/SDP-Liberal Alliance/Liberal Democrats' candidate. At the 1997 general election, Arnold stood down, and the seat was taken by Andrew Stunell of the Liberal Democrats. Stunell has held the seat since then, although with reduced majorities.
The Conservative share of the vote fell in Hazel Grove in both the 2001 and 2005 general elections, from a (winning) peak under Tom Arnold of 44.8% in 1992 to a low of 29.7% in 2005. Following three failed attempts to increase the share of the vote (1997, 2001 and 2005), this decline was reversed in the 2010 election by Annesley Abercorn, who achieved a 33.6% share of the vote (+3.9%) and a 2.4% swing from the Liberal Democrats to the Conservatives.
Members of Parliament
| Election | Member[2] | Party | |
|---|---|---|---|
| Feb 1974 | Dr Michael Winstanley | Liberal | |
| Oct 1974 | Sir Tom Arnold | Conservative | |
| 1997 | Andrew Stunell | Liberal Democrat | |
Elections
Elections in the 2010s
| General Election 2015: Hazel Grove | |||||
|---|---|---|---|---|---|
| Party | Candidate | Votes | % | ±% | |
| UKIP | Darran Palmer | ||||
| Green | Graham Reid | ||||
| Liberal Democrat | Lisa Smart[3] | ||||
| Labour | Michael Taylor[4] | ||||
| Conservative | William Wragg[3] | ||||
| Majority | |||||
| Turnout | |||||
| [[|N/A]] hold | Swing | ||||
| General Election 2010: Hazel Grove | |||||
|---|---|---|---|---|---|
| Party | Candidate | Votes | % | ±% | |
| Liberal Democrat | Andrew Stunell | 20,485 | 48.8 | −0.7 | |
| Conservative | Annesley Abercorn | 14,114 | 33.6 | +3.9 | |
| Labour | Richard Scorer | 5,234 | 12.5 | −5.0 | |
| UKIP | John Whittaker | 2,148 | 5.1 | +1.8 | |
| Majority | 6,371 | 15.2 | |||
| Turnout | 41,981 | 66.6 | +5.2 | ||
| Liberal Democrat hold | Swing | −2.4 | |||
Elections in the 2000s
| General Election 2005: Hazel Grove | |||||
|---|---|---|---|---|---|
| Party | Candidate | Votes | % | ±% | |
| Liberal Democrat | Andrew Stunell | 19,355 | 49.5 | −2.5 | |
| Conservative | Alan White | 11,607 | 29.7 | −0.4 | |
| Labour | Andrew Graystone | 6,834 | 17.5 | +1.3 | |
| UKIP | Keith Ryan | 1,321 | 3.4 | +1.7 | |
| Majority | 7,748 | 19.8 | |||
| Turnout | 39,117 | 60.8 | +1.7 | ||
| Liberal Democrat hold | Swing | −1.0 | |||
| General Election 2001: Hazel Grove | |||||
|---|---|---|---|---|---|
| Party | Candidate | Votes | % | ±% | |
| Liberal Democrat | Andrew Stunell | 20,020 | 52.0 | −2.5 | |
| Conservative | Nadine Bargery | 11,585 | 30.1 | −0.4 | |
| Labour | Martin Miller | 6,230 | 16.2 | +4.3 | |
| UKIP | Gerald Price | 643 | 1.7 | +1.1 | |
| Majority | 8,435 | 21.9 | |||
| Turnout | 38,478 | 59.1 | −18.2 | ||
| Liberal Democrat hold | Swing | -3.4[n 3] | |||
Elections in the 1990s
| General Election 1997: Hazel Grove | |||||
|---|---|---|---|---|---|
| Party | Candidate | Votes | % | ±% | |
| Liberal Democrat | Andrew Stunell | 26,883 | 54.5 | +11.4 | |
| Conservative | Brendan Murphy | 15,069 | 30.5 | −14.3 | |
| Labour | Jeffrey Lewis | 5,882 | 11.9 | +0.2 | |
| Referendum Party | John Stanyer | 1,055 | 2.1 | N/A | |
| UKIP | Gordon Black | 268 | 0.5 | N/A | |
| Humanist | Douglas Firkin-Flood | 183 | 0.4 | N/A | |
| Majority | 11,814 | 23.9 | |||
| Turnout | 49,340 | 77.3 | |||
| Liberal Democrat gain from Conservative | Swing | 12.9 | |||
| General Election 1992: Hazel Grove[5] | |||||
|---|---|---|---|---|---|
| Party | Candidate | Votes | % | ±% | |
| Conservative | Tom Arnold | 24,479 | 44.8 | −0.7 | |
| Liberal Democrat | Andrew Stunell | 23,550 | 43.1 | +1.1 | |
| Labour | Colin MacAllister | 6,390 | 11.7 | −0.1 | |
| Natural Law | Michael Penn | 204 | 0.4 | N/A | |
| Majority | 929 | 1.7 | −1.7 | ||
| Turnout | 54,623 | 84.9 | +3.3 | ||
| Conservative hold | Swing | −0.9 | |||
Elections in the 1980s
| General Election 1987: Hazel Grove | |||||
|---|---|---|---|---|---|
| Party | Candidate | Votes | % | ±% | |
| Conservative | Tom Arnold | 24,396 | 45.5 | −0.5 | |
| Liberal | Andrew Vos | 22,556 | 42.0 | +0.1 | |
| Labour | Glyn Ford | 6,354 | 11.8 | −0.2 | |
| Green | Freda Chapman | 346 | 0.6 | N/A | |
| Majority | 1,840 | 3.4 | |||
| Turnout | 53,652 | 81.6 | |||
| Conservative hold | Swing | −0.2 | |||
Major boundary changes occurred at this election. The vote changes compare with estimates for the 1979 election on the same boundaries.
| General Election 1983: Hazel Grove | |||||
|---|---|---|---|---|---|
| Party | Candidate | Votes | % | ±% | |
| Conservative | Tom Arnold | 22,627 | 46.0 | −5.0 | |
| Liberal | Andrew Vos | 20,605 | 41.9 | +14.5 | |
| Labour | Jonathan Comyn-Platt | 5,895 | 12.0 | −9.4 | |
| Majority | 2,022 | 4.1 | |||
| Turnout | 49,127 | 77.2 | |||
| Conservative hold | Swing | −9.8 | |||
Elections in the 1970s
| General Election 1979: Hazel Grove | |||||
|---|---|---|---|---|---|
| Party | Candidate | Votes | % | ±% | |
| Conservative | Tom Arnold | 32,420 | 55.5 | +10.6 | |
| Liberal | Viv Bingham | 17,148 | 29.4 | −10.4 | |
| Labour | John Lowe | 8,846 | 15.1 | −0.2 | |
| Majority | 15,272 | 26.1 | |||
| Turnout | 58,414 | 83.4 | +10.5 | ||
| Conservative hold | Swing | ||||
| General Election October 1974: Hazel Grove | |||||
|---|---|---|---|---|---|
| Party | Candidate | Votes | % | ±% | |
| Conservative | Tom Arnold | 25,012 | 44.9 | +2.0 | |
| Liberal | Michael Winstanley | 22,181 | 39.8 | −6.5 | |
| Labour | Allan Roberts | 8,527 | 15.3 | +4.5 | |
| Majority | 2,831 | 5.1 | |||
| Turnout | 55,720 | 82.4 | |||
| Conservative gain from Liberal | Swing | +4.3 | |||
| General Election February 1974: Hazel Grove | |||||
|---|---|---|---|---|---|
| Party | Candidate | Votes | % | ±% | |
| Liberal | Michael Winstanley | 26,966 | 46.3 | +2.0 (est.) | |
| Conservative | Tom Arnold | 24,968 | 42.9 | N/A | |
| Labour | Allan Roberts | 6,315 | 10.8 | N/A | |
| Majority | 1,998 | 3.4 | N/A | ||
| Turnout | 58,249 | 86.9 | N/A | ||
| Liberal win (new seat) | |||||
See also
- List of Parliamentary constituencies in Greater Manchester
Notes and references
- Notes
- ↑ A county constituency (for the purposes of election expenses and type of returning officer)
- ↑ As with all constituencies, the constituency elects one Member of Parliament (MP) by the first past the post system of election at least every five years.
- ↑ As both top parties locally lost share to Labour, this swing is (Lib Dem-Lab)
- References
- ↑ "Electorate Figures - Boundary Commission for England". 2011 Electorate Figures. Boundary Commission for England. 4 March 2011. Retrieved 13 March 2011.
- ↑ Leigh Rayment's Historical List of MPs – Constituencies beginning with "H" (part 2)
- ↑ 3.0 3.1 "UK ELECTION RESULTS". electionresults.blogspot.co.uk.
- ↑ "Former business editor to stand as North West MP". Prolific North.
- ↑ "UK General Election results April 1992". Richard Kimber's Political Science Resources. Politics Resources. 9 April 1992. Retrieved 2010-12-06.