Hastings Borough Council election, 2008
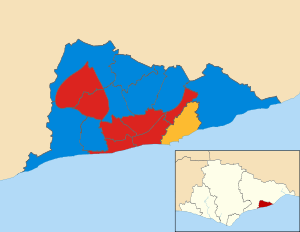
Map of the results of the 2008 Hastings council election.
Conservatives in blue,
Labour in red and Liberal Democrats in yellow.
The 2008 Hastings Borough Council election took place on 1 May 2008 to elect members of Hastings Borough Council in East Sussex, England. Half of the council was up for election and the council stayed under no overall control.[1]
After the election, the composition of the council was
Election result
Overall turnout in the election was 36.5%.[3]
| Hastings Local Election Result 2008[2][3] |
| Party |
Seats |
Gains |
Losses |
Net gain/loss |
Seats % |
Votes % |
Votes |
+/− |
| |
Conservative |
8 |
1 |
0 |
+1 |
50.0 |
42.5 |
9,530 |
+3.3% |
| |
Labour |
7 |
2 |
1 |
+1 |
43.8 |
34.7 |
7,786 |
+1.1% |
| |
Liberal Democrat |
1 |
0 |
2 |
-2 |
6.3 |
19.0 |
4,266 |
-3.4% |
| |
BNP |
0 |
0 |
0 |
0 |
0 |
2.1 |
472 |
+0.0% |
| |
Independent |
0 |
0 |
0 |
0 |
0 |
1.2 |
268 |
+1.2% |
| |
UKIP |
0 |
0 |
0 |
0 |
0 |
0.5 |
120 |
+0.5% |
Ward results
| Braybrooke[3][4] |
| Party |
Candidate |
Votes |
% |
±% |
|
Labour |
Dominic Sabetian |
794 |
53.2 |
+0.9 |
|
Conservative |
Michelle Green |
508 |
34.0 |
+3.2 |
|
Liberal Democrat |
Oliver Maloney |
191 |
12.8 |
-4.0 |
| Majority |
286 |
19.2 |
-2.3 |
| Turnout |
1,493 |
41.2 |
+0.7 |
|
Labour hold |
Swing |
|
|
| Castle[3][4] |
| Party |
Candidate |
Votes |
% |
±% |
|
Labour |
Paul Barlow |
718 |
46.5 |
+14.4 |
|
Liberal Democrat |
Paul Smith |
286 |
18.5 |
-20.3 |
|
Conservative |
Lee Allane |
246 |
15.9 |
-0.9 |
|
Independent |
Andy Dumas |
168 |
10.9 |
+10.9 |
|
BNP |
Mick Turner |
83 |
5.4 |
+5.4 |
|
Independent |
Bob Stewart |
43 |
2.8 |
+2.8 |
| Majority |
432 |
28.0 |
|
| Turnout |
1,544 |
36.7 |
+0.5 |
|
Labour gain from Liberal Democrat |
Swing |
|
|
| Central St. Leonards[3][4] |
| Party |
Candidate |
Votes |
% |
±% |
|
Labour |
Trevor Webb |
568 |
46.5 |
+2.0 |
|
Conservative |
Simon Corello |
327 |
26.8 |
-0.8 |
|
Liberal Democrat |
Brett McLean |
188 |
15.4 |
-12.4 |
|
BNP |
Frank Swaine |
81 |
6.6 |
+6.6 |
|
Independent |
David Knight |
57 |
4.7 |
+4.7 |
| Majority |
241 |
19.7 |
+3.0 |
| Turnout |
1,221 |
31.4 |
-1.7 |
|
Labour hold |
Swing |
|
|
| Conquest[3][4] |
| Party |
Candidate |
Votes |
% |
±% |
|
Conservative |
Peter Pragnell |
835 |
48.9 |
-11.9 |
|
Liberal Democrat |
Margaret Williams |
521 |
30.5 |
+10.4 |
|
Labour |
Nigel Sinden |
231 |
13.5 |
-5.6 |
|
UKIP |
Diane Granger |
120 |
7.0 |
+7.0 |
| Majority |
314 |
18.4 |
-22.3 |
| Turnout |
1,707 |
45.4 |
+5.2 |
|
Conservative hold |
Swing |
|
|
| Gensing[3][4] |
| Party |
Candidate |
Votes |
% |
±% |
|
Labour |
Kim Forward |
526 |
37.1 |
+10.9 |
|
Liberal Democrat |
Vivienne Bond |
457 |
32.2 |
+12.4 |
|
Conservative |
Cath Burrows |
435 |
30.7 |
-15.5 |
| Majority |
69 |
4.9 |
|
| Turnout |
1,418 |
36.7 |
-5.5 |
|
Labour gain from Liberal Democrat |
Swing |
|
|
| Hollington[3][4] |
| Party |
Candidate |
Votes |
% |
±% |
|
Labour |
Terry Soan |
427 |
41.1 |
-3.9 |
|
Conservative |
Amanda Charlesworth |
324 |
31.2 |
+11.3 |
|
BNP |
Victoria Britton |
161 |
15.5 |
-2.5 |
|
Liberal Democrat |
Nathan Lauder |
128 |
12.3 |
+0.5 |
| Majority |
103 |
9.9 |
-15.2 |
| Turnout |
1,040 |
25.1 |
-4.3 |
|
Labour hold |
Swing |
|
|
| Old Hastings[3][4] |
| Party |
Candidate |
Votes |
% |
±% |
|
Liberal Democrat |
Richard Stevens |
634 |
35.0 |
-1.6 |
|
Conservative |
Stuart Padget |
633 |
34.9 |
+4.5 |
|
Labour |
Kate Francis |
547 |
30.2 |
-2.8 |
| Majority |
1 |
0.1 |
-3.5 |
| Turnout |
1,814 |
42.8 |
+0.2 |
|
Liberal Democrat hold |
Swing |
|
|
| Tressell[3][4] |
| Party |
Candidate |
Votes |
% |
±% |
|
Labour |
Peter Chowney |
372 |
37.0 |
|
|
Conservative |
Kate Walsgrove |
279 |
27.7 |
|
|
Liberal Democrat |
Evelyn Modlinger |
208 |
20.7 |
|
|
BNP |
Nick Prince |
147 |
14.6 |
|
| Majority |
93 |
9.2 |
|
| Turnout |
1,006 |
29.5 |
-5.1 |
|
Labour hold |
Swing |
|
|
| West St Leonards[3][4] |
| Party |
Candidate |
Votes |
% |
±% |
|
Conservative |
Matthew Beaver |
663 |
48.5 |
+5.5 |
|
Labour |
Mike Turner |
517 |
37.8 |
+3.6 |
|
Liberal Democrat |
Tricia Kennelly |
186 |
13.6 |
-9.2 |
| Majority |
146 |
10.7 |
+1.9 |
| Turnout |
1,366 |
35.8 |
-3.4 |
|
Conservative hold |
Swing |
|
|
| Wishing Tree[3][4] |
| Party |
Candidate |
Votes |
% |
±% |
|
Labour |
Phil Scott |
614 |
46.7 |
+0.4 |
|
Conservative |
Jason Perry |
498 |
37.9 |
+10.2 |
|
Liberal Democrat |
Norman Wilcock |
203 |
15.4 |
-10.6 |
| Majority |
116 |
8.8 |
-9.8 |
| Turnout |
1,315 |
36.3 |
+0.8 |
|
Labour hold |
Swing |
|
|
References