Hastings Borough Council election, 2004
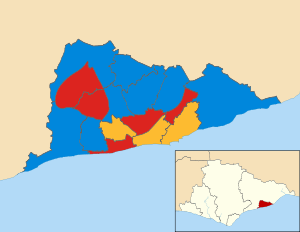
Map of the results of the 2004 Hastings council election.
Conservatives in blue,
Labour in red and Liberal Democrats in yellow.
Elections to Hastings Borough Council were held on 10 June 2004. Half of the council was up for election and the Labour party lost overall control of the council to no overall control. Overall turnout was 34.5%.
After the election, the composition of the council was
Election result
| Hastings Local Election Result 2004 |
| Party |
Seats |
Gains |
Losses |
Net gain/loss |
Seats % |
Votes % |
Votes |
+/− |
| |
Conservative |
8 |
3 |
0 |
+3 |
50.0 |
37.0 |
7,972 |
+4.0% |
| |
Labour |
5 |
0 |
6 |
-6 |
31.3 |
33.0 |
7,107 |
-12.7% |
| |
Liberal Democrat |
3 |
3 |
0 |
+3 |
18.8 |
23.6 |
5,093 |
+6.0% |
| |
Green |
0 |
0 |
0 |
0 |
0 |
4.3 |
930 |
+1.5% |
| |
UKIP |
0 |
0 |
0 |
0 |
0 |
2.1 |
449 |
+2.1% |
Ward results
| Braybrooke |
| Party |
Candidate |
Votes |
% |
±% |
|
Labour |
Sabetian |
748 |
49.5 |
|
|
Conservative |
Prince |
437 |
28.9 |
|
|
Liberal Democrat |
Saxby |
184 |
12.2 |
|
|
Green |
Phillips |
143 |
9.5 |
|
| Majority |
311 |
20.6 |
|
| Turnout |
1,512 |
40.6 |
+2.5 |
|
Labour hold |
Swing |
|
|
| Castle |
| Party |
Candidate |
Votes |
% |
±% |
|
Liberal Democrat |
Smith |
576 |
40.6 |
|
|
Labour |
Jackson |
431 |
30.4 |
|
|
Conservative |
Willard |
223 |
15.7 |
|
|
Green |
Homewood |
187 |
13.2 |
|
| Majority |
145 |
10.2 |
|
| Turnout |
1,417 |
32.3 |
-0.2 |
|
Liberal Democrat gain from Labour |
Swing |
|
|
| Central St Leonards |
| Party |
Candidate |
Votes |
% |
±% |
|
Labour |
Webb |
469 |
39.7 |
|
|
Liberal Democrat |
Modlinger |
423 |
35.8 |
|
|
Conservative |
Evans |
288 |
24.4 |
|
| Majority |
46 |
3.9 |
|
| Turnout |
1,180 |
27.3 |
-3.6 |
|
Labour hold |
Swing |
|
|
| Gensing |
| Party |
Candidate |
Votes |
% |
±% |
|
Liberal Democrat |
Bond |
433 |
33.0 |
|
|
Labour |
Rushbrook |
421 |
32.0 |
|
|
Conservative |
Lock |
320 |
24.4 |
|
|
Green |
Carey-Stuart |
140 |
10.7 |
|
| Majority |
12 |
1.0 |
|
| Turnout |
1,314 |
30.1 |
+2.8 |
|
Liberal Democrat gain from Labour |
Swing |
|
|
| Maze Hill |
| Party |
Candidate |
Votes |
% |
±% |
|
Conservative |
Charlesworth |
687 |
48.1 |
|
|
Liberal Democrat |
Russell |
261 |
18.3 |
|
|
Labour |
Maloney |
250 |
17.5 |
|
|
UKIP |
Manning |
229 |
16.0 |
|
| Majority |
426 |
29.8 |
|
| Turnout |
1,427 |
36.3 |
+2.9 |
|
Conservative hold |
Swing |
|
|
| Old Hastings |
| Party |
Candidate |
Votes |
% |
±% |
|
Liberal Democrat |
Stevens |
662 |
36.3 |
|
|
Labour |
Kitson |
548 |
30.1 |
|
|
Conservative |
Keen |
456 |
25.0 |
|
|
Green |
Robertson |
156 |
8.6 |
|
| Majority |
114 |
6.2 |
|
| Turnout |
1,822 |
42.8 |
+3.5 |
|
Liberal Democrat gain from Labour |
Swing |
|
|
| West St. Leonards |
| Party |
Candidate |
Votes |
% |
±% |
|
Conservative |
Beaver |
443 |
38.2 |
|
|
Liberal Democrat |
Wise |
255 |
22.0 |
|
|
Labour |
Wood |
243 |
20.9 |
|
|
UKIP |
Powell |
219 |
18.9 |
|
| Majority |
188 |
16.2 |
|
| Turnout |
1,160 |
31.2 |
+0.1 |
|
Conservative hold |
Swing |
|
|
| Wishing Tree |
| Party |
Candidate |
Votes |
% |
±% |
|
Labour |
Scott |
712 |
55.5 |
|
|
Conservative |
Molloy |
378 |
29.4 |
|
|
Liberal Democrat |
Pickard |
194 |
15.1 |
|
| Majority |
334 |
26.1 |
|
| Turnout |
1,284 |
35.6 |
+1.2 |
|
Labour hold |
Swing |
|
|
References