Harlow District Council election, 2003
The 2003 Harlow District Council election took place on 1 May 2003 to elect members of Harlow District Council in Essex, England. One third of the council was up for election and the council stayed under no overall control.[1]
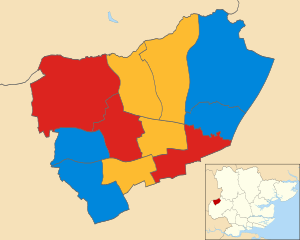
After the election, the composition of the council was
Background
Before the election both the Conservatives and Liberal Democrats had 12 councillors, while Labour had 9 seats.[3]
A total of 36 candidates stood for the 11 seats that were being contested, with the councillors who got the lowest number of votes from the 2002 election defending their seats.[3] One Labour councillor, John Cave, stood down at the election after 32 years, while 3 former Labour councillors and 1 former Liberal Democrat councillor attempted to regain seats.[3] Among the councillors defending their seats was the Conservative group leader Andrew Johnson in Sumners and Kingsmoor ward.[3]
Election result
There was no change in the party situation on the council with no party gaining a majority.[4] The closest result was in Bush Fair ward where Liberal Democrat Chris Millington held the seat by 39 votes, but the Liberal Democrat council chairman Nick Macy was not re-elected after contesting the Labour held seat in Little Parndon and Hare Street.[5] Overall turnout at the election was 29%.[6]
However an enquiry was started after the election as 3,279 postal votes had to be rejected as they did not have an official mark on them.[7]
| Harlow local election result 2003[2][6] |
| Party |
Seats |
Gains |
Losses |
Net gain/loss |
Seats % |
Votes % |
Votes |
+/− |
| |
Conservative |
4 |
0 |
0 |
0 |
36.4 |
32.7 |
4,610 |
+0.9% |
| |
Liberal Democrat |
4 |
0 |
0 |
0 |
36.4 |
27.8 |
3,915 |
-1.9% |
| |
Labour |
3 |
0 |
0 |
0 |
27.3 |
38.3 |
5,394 |
+0.6% |
| |
Socialist Alliance |
0 |
0 |
0 |
0 |
0 |
1.3 |
181 |
+0.7% |
Ward results
| Bush Fair[6] |
| Party |
Candidate |
Votes |
% |
±% |
|
Liberal Democrat |
Christopher Millington |
663 |
46.5 |
|
|
Labour |
Terence Brandon |
624 |
43.7 |
|
|
Conservative |
Hazel Beckers |
140 |
9.8 |
|
| Majority |
39 |
2.8 |
|
| Turnout |
1,427 |
31.3 |
-9 |
|
Liberal Democrat hold |
Swing |
|
|
| Harlow Common[6] |
| Party |
Candidate |
Votes |
% |
±% |
|
Labour |
Mark Wilkinson |
725 |
54.5 |
|
|
Conservative |
Nora Arnott |
405 |
30.4 |
|
|
Liberal Democrat |
Audrey Curran |
201 |
15.1 |
|
| Majority |
320 |
24.1 |
|
| Turnout |
1,331 |
29.1 |
-10 |
|
Labour hold |
Swing |
|
|
| Mark Hall[6] |
| Party |
Candidate |
Votes |
% |
±% |
|
Liberal Democrat |
Lesley Rideout |
598 |
44.8 |
|
|
Labour |
Sean Folan |
510 |
38.2 |
|
|
Conservative |
Callum Finlayson |
179 |
13.4 |
|
|
Socialist Alliance |
Robert Delbridge |
48 |
3.6 |
|
| Majority |
88 |
6.6 |
|
| Turnout |
1,335 |
33.6 |
-8.9 |
|
Liberal Democrat hold |
Swing |
|
|
| Netteswell[6] |
| Party |
Candidate |
Votes |
% |
±% |
|
Liberal Democrat |
James Pailing |
622 |
49.8 |
|
|
Labour |
Feroz Khan |
406 |
32.5 |
|
|
Conservative |
Matthew Warren |
153 |
12.3 |
|
|
Socialist Alliance |
Josephine Clarke |
67 |
5.4 |
|
| Majority |
216 |
17.3 |
|
| Turnout |
1,248 |
29.2 |
-8.3 |
|
Liberal Democrat hold |
Swing |
|
|
| Staple Tye[6] |
| Party |
Candidate |
Votes |
% |
±% |
|
Liberal Democrat |
Michael Faccini |
519 |
55.2 |
|
|
Labour |
Sandra Rootsey |
246 |
26.2 |
|
|
Conservative |
Shona Souter |
175 |
18.6 |
|
| Majority |
273 |
29.0 |
|
| Turnout |
940 |
22.7 |
-5 |
|
Liberal Democrat hold |
Swing |
|
|
| Toddbrook[6] |
| Party |
Candidate |
Votes |
% |
±% |
|
Labour |
Robert Davis |
630 |
48.8 |
|
|
Conservative |
Muriel Jolles |
473 |
36.6 |
|
|
Liberal Democrat |
Paul Lawton |
189 |
14.6 |
|
| Majority |
157 |
12.2 |
|
| Turnout |
1,292 |
29.6 |
-6 |
|
Labour hold |
Swing |
|
|
References