Harlow (UK Parliament constituency)
| Harlow | |
|---|---|
|
County constituency for the House of Commons | |
|
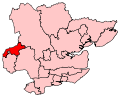
Boundary of Harlow in Essex. | |
|
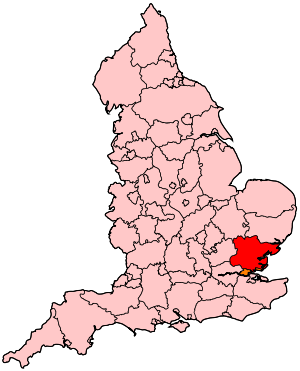
Location of Essex within England. | |
| County | Essex |
| Electorate | 67,700 (December 2010)[1] |
| Current constituency | |
| Created | 1974 |
| Member of parliament | Robert Halfon (Conservative) |
| Number of members | One |
| Created from | Epping |
| Overlaps | |
| European Parliament constituency | East of England |
Harlow is a constituency[n 1] represented in the House of Commons of the UK Parliament since 2010 by Robert Halfon, a Conservative.[n 2]
Boundaries
Harlow's seat encompasses the 'new town' of Harlow along with the northern wards from Epping Forest district of:
- Hastingwood, Matching and Sheering Village; and Lower Sheering.[2]
History
This seat was created in 1974 from the former seat of Epping and until changes introduced in time for the 2010 election included part of the electoral ward of Broadley Common, Epping Upland and Nazeing.[2]
Constituency profile
The seat has been a bellwether since the result in 1983. Included are above county-average levels of social housing,[3] underemployment and unemployment as at the 2001 census and the associated 2000 Index of Multiple Deprivation[4] however the new town has brought growth sustained in part by more commuting with an increasingly-used and separate Mill station in the London Commuter Belt and has seen a 9.2% increase in the number of apartments to 2011 which brings the proportion of the housing market made up by flats and apartments to 23.8%.[3]
Members of Parliament
| Election | Member[5] | Party | |
|---|---|---|---|
| February 1974 | Stan Newens | Labour Co-op | |
| 1983 | Jerry Hayes | Conservative | |
| 1997 | Bill Rammell | Labour | |
| 2010 | Robert Halfon | Conservative | |
Elections
Elections in the 2010s
| General Election 2015: Harlow [6] | |||||
|---|---|---|---|---|---|
| Party | Candidate | Votes | % | ±% | |
| TUSC | David Brown[7] | ||||
| English Democrats | Eddy Butler | ||||
| Conservative | Robert Halfon[8] | ||||
| Green | Murray Sackwild [9] | ||||
| Liberal Democrat | Geoffrey Seeff | ||||
| UKIP | Sam Stopplecamp[10] | ||||
| Labour | Suzy Stride [11] | ||||
| General Election 2010: Harlow[12] | |||||
|---|---|---|---|---|---|
| Party | Candidate | Votes | % | ±% | |
| Conservative | Robert Halfon | 19,691 | 44.9 | +4.1 | |
| Labour | Bill Rammell | 14,766 | 33.7 | −7.7 | |
| Liberal Democrat | David White | 5,990 | 13.7 | +0.7 | |
| BNP | Eddy Butler | 1,739 | 4.0 | N/A | |
| UKIP | John Croft | 1,591 | 3.6 | +1.1 | |
| Christian | Oluyemi Adeeko | 101 | 0.2 | +0.2 | |
| Majority | 4,925 | 11.2 | |||
| Turnout | 43,878 | 65.1 | +2.7 | ||
| Conservative gain from Labour | Swing | +5.9 | |||
Elections in the 2000s
| General Election 2005: Harlow | |||||
|---|---|---|---|---|---|
| Party | Candidate | Votes | % | ±% | |
| Labour | Bill Rammell | 16,453 | 41.4 | −6.4 | |
| Conservative | Robert Halfon | 16,356 | 41.2 | +6.4 | |
| Liberal Democrat | Lorna Spenceley | 5,002 | 12.6 | −0.8 | |
| UKIP | John Felgate | 981 | 2.5 | −0.5 | |
| Veritas | Anthony Bennett | 941 | 2.4 | N/A | |
| Majority | 97 | 0.2 | |||
| Turnout | 39,733 | 62.6 | +2.9 | ||
| Labour hold | Swing | −6.4 | |||
| General Election 2001: Harlow | |||||
|---|---|---|---|---|---|
| Party | Candidate | Votes | % | ±% | |
| Labour | Bill Rammell | 19,169 | 47.8 | −6.3 | |
| Conservative | Robert Halfon | 13,941 | 34.8 | +2.7 | |
| Liberal Democrat | Lorna Spenceley | 5,381 | 13.4 | +4.0 | |
| UKIP | Tony Bennett | 1,223 | 3.0 | +2.3 | |
| Socialist Alliance | John Hobbs | 401 | 1.0 | N/A | |
| Majority | 5,228 | 13.0 | |||
| Turnout | 40,115 | 59.7 | −14.6 | ||
| Labour hold | Swing | ||||
Elections in the 1990s
| General Election 1997: Harlow | |||||
|---|---|---|---|---|---|
| Party | Candidate | Votes | % | ±% | |
| Labour | Bill Rammell | 25,861 | 54.1 | +12.3 | |
| Conservative | Jerry Hayes | 15,347 | 32.1 | −14.9 | |
| Liberal Democrat | Lorna Spenceley | 4,523 | 9.5 | −1.8 | |
| Referendum Party | Mark Wells | 1,422 | 3.0 | N/A | |
| UKIP | Gerard Batten | 340 | 0.7 | N/A | |
| BNP | John Bowles | 319 | 0.7 | N/A | |
| Majority | 10,514 | 22.0 | |||
| Turnout | 47,812 | ||||
| Labour gain from Conservative | Swing | ||||
| General Election 1992: Harlow[13] | |||||
|---|---|---|---|---|---|
| Party | Candidate | Votes | % | ±% | |
| Conservative | Jerry Hayes | 26,608 | 47.0 | −0.2 | |
| Labour | Bill Rammell | 23,668 | 41.8 | +5.2 | |
| Liberal Democrat | Lorna Spenceley | 6,375 | 11.3 | −4.9 | |
| Majority | 2,940 | 5.2 | |||
| Turnout | 56,651 | 82.6 | |||
| Conservative hold | Swing | −2.7 | |||
Elections in the 1980s
| General Election 1987: Harlow | |||||
|---|---|---|---|---|---|
| Party | Candidate | Votes | % | ±% | |
| Conservative | Jerry Hayes | 26,017 | 47.2 | +6.1 | |
| Labour | Stanley Newens | 20,140 | 36.6 | +2.3 | |
| Social Democratic | M.C. Eden-Green | 8,915 | 16.2 | −8.0 | |
| Majority | 5,877 | 10.7 | |||
| Turnout | 55,072 | 74.1 | −2.4 | ||
| Conservative hold | Swing | +1.9 | |||
| General Election 1983: Harlow | |||||
|---|---|---|---|---|---|
| Party | Candidate | Votes | % | ±% | |
| Conservative | Jerry Hayes | 21,924 | 41.1 | +1.0 | |
| Labour | Stanley Newens | 18,250 | 34.2 | −8.5 | |
| Liberal | John Bastick | 12,891 | 24.2 | +8.6 | |
| Independent | J. Ward | 256 | 0.5 | N/A | |
| Majority | 3,674 | 6.9 | |||
| Turnout | 53,321 | 76.5 | −2.2 | ||
| Conservative gain from Labour | Swing | +4.8 | |||
Elections in the 1970s
| General Election 1979: Harlow | |||||
|---|---|---|---|---|---|
| Party | Candidate | Votes | % | ±% | |
| Labour | Stanley Newens | 22,698 | 42.7 | −10.0 | |
| Conservative | John Powley | 21,306 | 40.1 | +15.8 | |
| Liberal | R. Browne | 8,289 | 15.7 | −7.4 | |
| Majority | 1,392 | 2.6 | |||
| Turnout | 53,133 | 78.7 | +3.5 | ||
| Labour hold | Swing | −12.9 | |||
| General Election October 1974: Harlow | |||||
|---|---|---|---|---|---|
| Party | Candidate | Votes | % | ±% | |
| Labour | Stanley Newens | 24,961 | 52.7 | +3.2 | |
| Conservative | J.E. Smith | 11,510 | 24.3 | −0.7 | |
| Liberal | Basil Goldstone | 10,869 | 23.0 | −2.5 | |
| Majority | 13,451 | 28.4 | |||
| Turnout | 47,340 | 75.2 | −8.7 | ||
| Labour hold | Swing | +2.0 | |||
| General Election February 1974: Harlow | |||||
|---|---|---|---|---|---|
| Party | Candidate | Votes | % | ±% | |
| Labour | Stanley Newens | 25,814 | 49.5 | −11.4 | |
| Liberal | Basil Goldstone | 13,280 | 25.5 | +25.5 | |
| Conservative | J.E. Smith | 13,016 | 25.0 | −14.1 | |
| Majority | 12,534 | 24.1 | |||
| Turnout | 52,110 | 83.9 | +10.0 | ||
| Labour win (new seat) | |||||
| General Election 1970 (Notional): Harlow | |||||
|---|---|---|---|---|---|
| Party | Candidate | Votes | % | ±% | |
| Labour | 29,453 | 60.9 | |||
| Conservative | 18,880 | 39.1 | |||
| Majority | 10,573 | 21.8 | |||
| Turnout | 48,333 | 72.9 | |||
| Labour hold | Swing | ||||
| Preceded by Epping |
UK Parliament constituency 1974– |
Succeeded by Current Incumbent |
See also
Notes and references
- Notes
- References
- ↑ "Electorate Figures - Boundary Commission for England". 2011 Electorate Figures. Boundary Commission for England. 4 March 2011. Retrieved 13 March 2011.
- ↑ 2.0 2.1 pp308-308 Fifth Periodic Review of Westminster constituencies
- ↑ 3.0 3.1 2011 census interactive maps 31.2% of property is socially rented, higher than the other districts in Essex
- ↑ 2001 Census
- ↑ Leigh Rayment's Historical List of MPs – Constituencies beginning with "H" (part 1)
- ↑ http://ukpollingreport.co.uk/2015guide/harlow/
- ↑ http://www.tusc.org.uk/txt/320.pdf
- ↑ http://electionresults.blogspot.co.uk/2013/04/harlow-2015.html
- ↑ http://www.harlowstar.co.uk/Green-Party-select-candidate-Harlow-General/story-23844618-detail/story.html
- ↑ "Could UKIP’s Sam Stopplecamp be Harlow’s next MP?". Your Harlow. 1 September 2014. Retrieved 17 January 2015.
- ↑ http://www.labour.org.uk/candidates
- ↑ Statement of Persons Nominated Harlow Council
- ↑ "Politics Resources". Election 1992. Politics Resources. 9 April 1992. Retrieved 2010-12-06.