Hampshire County Council election, 2009
Hampshire County Council election, 2009
|
|
|
|
|
|
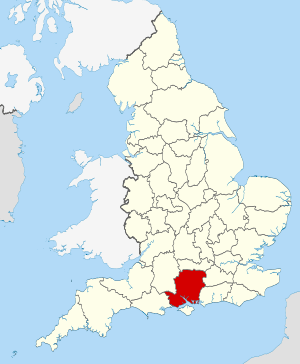
| The county of Hampshire within England |
|
An election to Hampshire County Council took place on 4 June 2009 as part of the United Kingdom local elections, 2009, having been delayed from 7 May, in order to coincide with elections to the European Parliament.[1] 78 councillors were elected from 75 electoral divisions, which returned either one or two county councillors each by first-past-the-post voting for a four-year term of office. The electoral divisions were the same as those used at the previous election in 2005. Elections in Portsmouth and Southampton do not coincide with this set, being unitary authorities outside the area covered by the County Council.
All locally registered electors (British, Irish, Commonwealth and European Union citizens) who were aged 18 or over on Thursday 2 May 2013 were entitled to vote in the local elections. Those who were temporarily away from their ordinary address (for example, away working, on holiday, in student accommodation or in hospital) were also entitled to vote in the local elections,[2] although those who had moved abroad and registered as overseas electors cannot vote in the local elections. It is possible to register to vote at more than one address (such as a university student who had a term-time address and lives at home during holidays) at the discretion of the local Electoral Register Office, but it remains an offence to vote more than once in the same local government election.[3]
Summary
The election saw the Conservatives retain control of the council and increase their majority from 14 seats to 24 seats. As the largest opposition party, the Liberal Democrats lost seats overall, while Labour were reduced to holding just one seat (Basingstoke North). The Community Campaign in Hart also won a seat in Church Crookham and Ewshot.
Results
| Hampshire County Council election, 2009[4][5][6] |
| Party |
Seats |
Gains |
Losses |
Net gain/loss |
Seats % |
Votes % |
Votes |
+/− |
| |
Conservative |
51 |
7 |
2 |
+5 |
65.4 |
47.72 |
192900 |
+4.03 |
| |
Liberal Democrat |
25 |
2 |
5 |
-3 |
32.1 |
32.89 |
132975 |
-3.12 |
| |
Labour |
1 |
0 |
3 |
-3 |
1.3 |
7.07 |
28591 |
-10.25 |
| |
Community Campaign ♥ |
1 |
1 |
0 |
+1 |
1.3 |
0.95 |
3822 |
N/A |
| |
UKIP |
0 |
0 |
0 |
0 |
0 |
5.92 |
23949 |
+5.17 |
| |
Independent |
0 |
0 |
0 |
0 |
0 |
1.86 |
7504 |
+1.25 |
| |
Green |
0 |
0 |
0 |
0 |
0 |
1.72 |
6947 |
+0.28 |
| |
English Democrats |
0 |
0 |
0 |
0 |
0 |
1.04 |
4200 |
+0.97 |
| |
No Party |
0 |
0 |
0 |
0 |
0 |
0.49 |
2001 |
+0.38 |
| |
BNP |
0 |
0 |
0 |
0 |
0 |
0.34 |
1386 |
N/A |
Results by district
Hampshire County Council is split into 11 Districts, each district is further split into wards, the following are the results for these wards.
Basingstoke and Deane
| Basingstoke Central |
| Party |
Candidate |
Votes |
% |
±% |
|
Liberal Democrat |
Ronald Hussey |
1912 |
43.10 |
+9.73 |
|
Conservative |
Paul Miller |
1300 |
29.31 |
+0.07 |
|
Labour |
Sean Keating |
970 |
21.87 |
-15.52 |
|
No Party |
Michael Brooke |
254 |
5.73 |
+5.73 |
| Majority |
612 |
13.79 |
|
| Turnout |
4436 |
32.92 |
-28.10 |
|
Liberal Democrat gain from Labour |
Swing |
+12.62 |
|
| Basingstoke North |
| Party |
Candidate |
Votes |
% |
±% |
|
Labour |
Jane Frankum |
1726 |
47.63 |
|
|
Conservative |
Christopher Aldous |
1062 |
29.30 |
|
|
Liberal Democrat |
Janice Spalding |
526 |
14.51 |
|
|
No Party |
Rebecca Butcher |
310 |
8.55 |
|
| Majority |
664 |
18.33 |
|
| Turnout |
3624 |
28.35 |
-28.20 |
|
Labour hold |
Swing |
|
|
| Basingstoke North West |
| Party |
Candidate |
Votes |
% |
±% |
|
Conservative |
Stephen Reid |
1745 |
55.19 |
|
|
Labour |
Andy McCormick |
632 |
19.99 |
|
|
Liberal Democrat |
Michael Berwick-Gooding |
475 |
15.02 |
|
|
No Party |
Christine Heath |
310 |
9.80 |
|
| Majority |
1113 |
35.20 |
|
| Turnout |
3162 |
30.45 |
-27.15 |
|
Conservative hold |
Swing |
|
|
| Basingstoke South East |
| Party |
Candidate |
Votes |
% |
±% |
|
Liberal Democrat |
Brian Gurden |
2454 |
59.74 |
|
|
Conservative |
Nalin Jayawardena |
1265 |
30.79 |
|
|
Labour |
Mike Stockwell |
389 |
9.47 |
|
| Majority |
1189 |
28.95 |
|
| Turnout |
4108 |
33.68 |
-27.17 |
|
Liberal Democrat hold |
Swing |
|
|
| Basingstoke South West |
| Party |
Candidate |
Votes |
% |
±% |
|
Conservative |
Rita Burgess |
2900 |
61.90 |
|
|
No Party |
Philip Heath |
745 |
15.90 |
|
|
Liberal Democrat |
Kevin Harkess |
662 |
14.13 |
|
|
Labour |
Paul Frankum |
378 |
8.07 |
|
| Majority |
2155 |
46 |
|
| Turnout |
4685 |
35.07 |
-32.69 |
|
Conservative hold |
Swing |
|
|
| Calleva and Kingsclere |
| Party |
Candidate |
Votes |
% |
±% |
|
Conservative |
Keith Chapman |
3931 |
72.46 |
|
|
Liberal Democrat |
Roger Ward |
1116 |
20.57 |
|
|
Labour |
Steve Rothman |
378 |
6.97 |
|
| Majority |
2815 |
51.89 |
|
| Turnout |
5425 |
41.72 |
-29.43 |
|
Conservative hold |
Swing |
|
|
| Candovers |
| Party |
Candidate |
Votes |
% |
±% |
|
Conservative |
Anna McNair Scott |
2709 |
54.15 |
|
|
Independent |
Ian Tilbury |
1238 |
24.75 |
|
|
Liberal Democrat |
Jeff Teagle |
798 |
15.95 |
|
|
Labour |
Susan Dady |
258 |
5.16 |
|
| Majority |
1471 |
29.4 |
|
| Turnout |
5003 |
44.45 |
-27.9 |
|
Conservative hold |
Swing |
|
|
| Loddon |
| Party |
Candidate |
Votes |
% |
±% |
|
Conservative |
Elaine Still |
3134 |
64.49 |
|
|
Liberal Democrat |
Stephen Day |
1170 |
24.07 |
|
|
Labour |
Colin Regan |
304 |
6.26 |
|
|
No Party |
Alex MacDonald |
252 |
5.19 |
|
| Majority |
1964 |
40.42 |
|
| Turnout |
4860 |
37.3 |
-32.66 |
|
Conservative hold |
Swing |
|
|
| Tadley and Baughurst |
| Party |
Candidate |
Votes |
% |
±% |
|
Conservative |
Marilyn Tucker |
2021 |
48.61 |
|
|
Liberal Democrat |
Warwick Lovegrove |
1981 |
47.64 |
|
|
Labour |
Rick Dady |
156 |
3.75 |
|
| Majority |
40 |
0.97 |
|
| Turnout |
4158 |
38.91 |
-25.76 |
|
Conservative hold |
Swing |
|
|
| Whitchurch and Clere |
| Party |
Candidate |
Votes |
% |
±% |
|
Conservative |
Tom Thacker |
2696 |
55.46 |
|
|
Liberal Democrat |
Keith Watts |
1527 |
31.41 |
|
|
UKIP |
George Garton |
486 |
10.00 |
|
|
Labour |
Criss Connor |
152 |
3.13 |
|
| Majority |
1169 |
24.05 |
|
| Turnout |
4861 |
46.25 |
-24.49 |
|
Conservative hold |
Swing |
|
|
Eastleigh
| Bishopstoke and Fair Oak |
| Party |
Candidate |
Votes |
% |
±% |
|
Liberal Democrat |
Angela May Roling |
2300 |
47.10 |
|
|
Conservative |
Chris Rhodes |
1338 |
27.40 |
|
|
UKIP |
Hugh McGuinness |
892 |
18.27 |
|
|
Labour |
Wendy Borrill |
353 |
7.23 |
|
| Majority |
962 |
19.7 |
|
| Turnout |
4883 |
37.12 |
-30.97 |
|
Liberal Democrat hold |
Swing |
|
|
| Botley and Hedge End |
| Party |
Candidate |
Votes |
% |
±% |
|
Liberal Democrat |
Rupert Gregory Miles Kyrle |
3001 |
48.08 |
|
|
Conservative |
Jerry Hall |
2402 |
38.48 |
|
|
UKIP |
Beryl Alice Humphrey |
670 |
10.73 |
|
|
Labour |
Geoffrey Kosted |
169 |
2.71 |
|
| Majority |
599 |
9.60 |
|
| Turnout |
6242 |
43.73 |
-24.13 |
|
Liberal Democrat hold |
Swing |
|
|
| Chandlers Ford |
| Party |
Candidate |
Votes |
% |
±% |
|
Conservative |
Colin Davidovitz |
2860 |
51.29 |
|
|
Liberal Democrat |
Terry Holden-Brown |
1928 |
34.58 |
|
|
UKIP |
Paul Michael Webber |
573 |
10.28 |
|
|
Labour |
Kevin Richard Butt |
215 |
3.86 |
|
| Majority |
932 |
16.71 |
|
| Turnout |
5576 |
46.77 |
-26.81 |
|
Conservative hold |
Swing |
|
|
| Eastleigh East |
| Party |
Candidate |
Votes |
% |
±% |
|
Liberal Democrat |
Christopher Thomas |
1887 |
45.40 |
|
|
Conservative |
Richard Uren |
966 |
23.24 |
|
|
UKIP |
Caroline Bradbeer |
829 |
19.95 |
|
|
Labour |
Peter Luffman |
474 |
11.41 |
|
| Majority |
921 |
22.16 |
|
| Turnout |
4156 |
32.96 |
-30.49 |
|
Liberal Democrat hold |
Swing |
|
|
| Eastleigh West |
| Party |
Candidate |
Votes |
% |
±% |
|
Liberal Democrat |
Alan Broadhurst |
2074 |
46.20 |
|
|
Conservative |
Judith Grajewski |
1159 |
25.82 |
|
|
UKIP |
Ann Bays |
740 |
16.48 |
|
|
Labour |
Sue Parkinson |
516 |
11.49 |
|
| Majority |
4489 |
32.26 |
|
| Turnout |
4489 |
32.4 |
-31.13 |
|
Liberal Democrat hold |
Swing |
|
|
| Hamble |
| Party |
Candidate |
Votes |
% |
±% |
|
Liberal Democrat |
Keith House |
2898 |
53.50 |
|
|
Conservative |
John Milne |
1599 |
29.52 |
|
|
UKIP |
Mark Collins |
733 |
13.53 |
|
|
Labour |
Ted White |
187 |
3.45 |
|
| Majority |
5417 |
38.29 |
|
| Turnout |
5417 |
38.5 |
-26.18 |
|
Liberal Democrat hold |
Swing |
|
|
| West End and Hedge End Grange Park |
| Party |
Candidate |
Votes |
% |
±% |
|
Liberal Democrat |
Bruce Tennent |
2423 |
52.40 |
|
|
Conservative |
Martin Briggs |
1438 |
31.10 |
|
|
UKIP |
Martin Lyon |
550 |
11.89 |
|
|
Labour |
Nancy Smith |
213 |
4.61 |
|
| Majority |
985 |
21.30 |
|
| Turnout |
4624 |
34.37 |
-32.09 |
|
Liberal Democrat hold |
Swing |
|
|
East Hampshire
| Alton Rural |
| Party |
Candidate |
Votes |
% |
±% |
|
Conservative |
Mark Kemp-Gee |
4031 |
70.04 |
|
|
Liberal Democrat |
Jacky Powers |
1464 |
25.44 |
|
|
Labour |
Jan Treacher |
260 |
4.52 |
|
| Majority |
2567 |
44.6 |
|
| Turnout |
5755 |
43.37 |
-31.06 |
|
Conservative hold |
Swing |
|
|
| Alton Town |
| Party |
Candidate |
Votes |
% |
±% |
|
Conservative |
Andrew Joy |
2191 |
47.38 |
|
|
Liberal Democrat |
Tony Ludlow |
2107 |
45.57 |
|
|
Labour |
Barbara Burfoot |
326 |
7.05 |
|
| Majority |
84 |
1.81 |
|
| Turnout |
4624 |
35.00 |
-29.28 |
|
Conservative gain from Liberal Democrat |
Swing |
|
|
| Bordon, Whitehill and Lindford |
| Party |
Candidate |
Votes |
% |
±% |
|
Liberal Democrat |
Adam Carew |
2111 |
64.81 |
|
|
Conservative |
Yvonne Parker-Smith |
1038 |
31.87 |
|
|
Labour |
Melanie Onn |
108 |
3.32 |
|
| Majority |
1073 |
32.94 |
|
| Turnout |
3257 |
27.77 |
-26.78 |
|
Liberal Democrat hold |
Swing |
|
|
| Catherington |
| Party |
Candidate |
Votes |
% |
±% |
|
Liberal Democrat |
Sam Payne |
2375 |
46.32 |
|
|
Conservative |
Dave Harvey |
2015 |
39.30 |
|
|
English Democrats |
Pat Harris |
335 |
6.53 |
|
|
Independent |
Eunice Byrom |
285 |
5.56 |
|
|
Labour |
Kenneth Monks |
117 |
2.28 |
|
| Majority |
360 |
7.02 |
|
| Turnout |
5127 |
41.52 |
-26.51 |
|
Liberal Democrat gain from Conservative |
Swing |
|
|
| Headley |
| Party |
Candidate |
Votes |
% |
±% |
|
Conservative |
Sam James |
2849 |
63.65 |
|
|
Liberal Democrat |
Richard Clifford |
1393 |
31.12 |
|
|
Labour |
John Tough |
234 |
5.23 |
|
| Majority |
1456 |
32.53 |
|
| Turnout |
4476 |
35.29 |
-30.95 |
|
Conservative hold |
Swing |
|
|
| Petersfield Butser |
| Party |
Candidate |
Votes |
% |
±% |
|
Conservative |
John West |
2800 |
55.16 |
|
|
Liberal Democrat |
Judith Rodgers |
1946 |
38.34 |
|
|
Labour |
Bill Organ |
330 |
6.50 |
|
| Majority |
854 |
16.82 |
|
| Turnout |
5076 |
39.09 |
-27.57 |
|
Conservative gain from Liberal Democrat |
Swing |
|
|
| Petersfield Hangers |
| Party |
Candidate |
Votes |
% |
±% |
|
Conservative |
Clarke Vaughan |
3340 |
68.32 |
|
|
Liberal Democrat |
Roger Mullenger |
1314 |
26.88 |
|
|
Labour |
Wendy Godber |
235 |
4.81 |
|
| Majority |
2026 |
41.44 |
|
| Turnout |
4889 |
41.49 |
-29.43 |
|
Conservative hold |
Swing |
|
|
Fareham
| Fareham Crofton |
| Party |
Candidate |
Votes |
% |
±% |
|
Conservative |
Tim Knight |
3151 |
58.47 |
+7.31 |
|
Liberal Democrat |
Craig Lewis |
1317 |
24.44 |
-8.98 |
|
UKIP |
Frederick Estall |
438 |
8.13 |
+8.13 |
|
Green |
John Vivian |
309 |
5.73 |
+5.73 |
|
Labour |
Cameron Crouchman |
174 |
3.23 |
-12.19 |
| Majority |
1834 |
34.03 |
|
| Turnout |
5389 |
46.36 |
-25.04 |
|
Conservative hold |
Swing |
|
|
| Fareham Portchester |
| Party |
Candidate |
Votes |
% |
±% |
|
Liberal Democrat |
Roger Price |
2841 |
47.41 |
|
|
Conservative |
Nick Gregory |
1673 |
27.92 |
|
|
Labour |
Richard Ryan |
364 |
6.07 |
|
|
BNP |
Roger Knight |
311 |
5.19 |
|
|
English Democrats |
Alan Chapman |
202 |
3.37 |
|
| Majority |
1168 |
19.49 |
|
| Turnout |
5992 |
41.28 |
-26.65 |
|
Liberal Democrat hold |
Swing |
|
|
| Fareham Sarisbury |
| Party |
Candidate |
Votes |
% |
±% |
|
Conservative |
Sean Woodward |
2661 |
64.14 |
|
|
Liberal Democrat |
Martin Haysom |
533 |
12.85 |
|
|
UKIP |
Vivienne Young |
476 |
11.47 |
|
|
Green |
Iain Maclennan |
279 |
6.72 |
|
|
Labour |
Brenda Caines |
200 |
4.82 |
|
| Majority |
2128 |
51.29 |
|
| Turnout |
4149 |
37.06 |
-29.96 |
|
Conservative hold |
Swing |
|
|
| Fareham Titchfield |
| Party |
Candidate |
Votes |
% |
±% |
|
Conservative |
Geoff Hockley |
2037 |
45.83 |
|
|
Liberal Democrat |
Jack Englefield |
1451 |
32.64 |
|
|
UKIP |
Geoff Townley |
530 |
11.92 |
|
|
Green |
Peter Doggett |
247 |
5.56 |
|
|
Labour |
Michael Prior |
180 |
4.05 |
|
| Majority |
586 |
13.19 |
|
| Turnout |
4445 |
40.39 |
-26.3 |
|
Conservative hold |
Swing |
|
|
| Fareham Town (2) |
| Party |
Candidate |
Votes |
% |
±% |
|
Conservative |
John Bryant |
5092 |
24.93 |
|
|
Conservative |
Raymond Ellis |
4451 |
21.80 |
|
|
Liberal Democrat |
Katrina Trott |
2819 |
13.80 |
|
|
Liberal Democrat |
Jim Murray |
2695 |
13.20 |
|
|
UKIP |
Steve Richards |
1665 |
8.15 |
|
|
UKIP |
Graeme Young |
1392 |
6.82 |
|
|
Green |
David Harrison |
1062 |
5.20 |
|
|
Labour |
Les Ricketts |
631 |
3.09 |
|
|
Labour |
Stuart Rose |
615 |
3.01 |
|
| Turnout |
11020 |
39.74 |
-25.43 |
|
Conservative hold |
Swing |
|
|
|
Conservative hold |
Swing |
|
|
| Fareham Warsash |
| Party |
Candidate |
Votes |
% |
±% |
|
Conservative |
Keith Evans |
2767 |
60.48 |
+5.11 |
|
UKIP |
John Claydon |
680 |
14.86 |
+14.86 |
|
Liberal Democrat |
David Savage |
545 |
11.91 |
-9.78 |
|
Green |
Linda Maclennan |
338 |
7.39 |
+7.39 |
|
Labour |
James Carr |
245 |
5.36 |
-12.28 |
| Majority |
2087 |
45.62 |
|
| Turnout |
4575 |
41.06 |
-28.64 |
|
Conservative hold |
Swing |
|
|
Gosport
| Hardway |
| Party |
Candidate |
Votes |
% |
±% |
|
Liberal Democrat |
Peter Chegwyn |
1668 |
49.23 |
|
|
Conservative |
Mark Hook |
1328 |
39.20 |
|
|
Labour |
Stephen Williams |
392 |
11.57 |
|
| Majority |
340 |
10.03 |
|
| Turnout |
3388 |
30.37 |
-27.79 |
|
Liberal Democrats gain from The Liberal Democrat Local Resident |
Swing |
|
|
Hart
| Church Crookham and Ewshot |
| Party |
Candidate |
Votes |
% |
±% |
|
Community Campaign ♥ |
Jenny Radley |
3822 |
66.54 |
|
|
Conservative |
Pritpal Singh |
1744 |
30.88 |
|
|
Labour |
Jim White |
148 |
2.58 |
|
| Majority |
2048 |
35.66 |
|
| Turnout |
5744 |
44.66 |
-21.96 |
|
Community Campaign ♥ gain from Conservative |
Swing |
|
|
| Hartley Wintney, Eversley and Yateley West |
| Party |
Candidate |
Votes |
% |
±% |
|
Liberal Democrat |
David Simpson |
2361 |
42.18 |
|
|
Conservative |
Sara Kinnell |
2288 |
40.88 |
|
|
Independent |
Roger Robertson |
599 |
9.99 |
|
|
BNP |
Geoffrey Crompton |
222 |
3.97 |
|
|
Labour |
Joyce Still |
167 |
2.98 |
|
| Majority |
73 |
1.30 |
|
| Turnout |
5597 |
41.74 |
-23.59 |
|
Liberal Democrat hold |
Swing |
|
|
| Yateley East, Blackwater and Ancells |
| Party |
Candidate |
Votes |
% |
±% |
|
Liberal Democrat |
Adrian Collett |
3015 |
62.64 |
|
|
Conservative |
Edward Dawson |
1615 |
33.55 |
|
|
Labour |
Barry Jones |
183 |
3.80 |
|
| Majority |
1400 |
29.09 |
|
| Turnout |
4813 |
35.97 |
-28.82 |
|
Liberal Democrat hold |
Swing |
|
|
Havant
| Cowplain and Hart Plain |
| Party |
Candidate |
Votes |
% |
±% |
|
Conservative |
David Keast |
2105 |
53.41 |
|
|
Liberal Democrat |
Mike Ashton |
1048 |
26.59 |
|
|
Green |
Dave Ludlam |
521 |
13.22 |
|
|
Labour |
Howard Linsley |
267 |
6.77 |
|
| Majority |
1057 |
26.82 |
|
| Turnout |
3941 |
33.24 |
-27.83 |
|
Conservative hold |
Swing |
|
|
| Emsworth and St Faith's |
| Party |
Candidate |
Votes |
% |
±% |
|
Conservative |
Ray Bolton |
3144 |
46.66 |
|
|
Liberal Democrat |
Ray Cobbett |
1648 |
24.46 |
|
|
UKIP |
Stephen Harris |
807 |
11.98 |
|
|
Green |
Mary Youle |
546 |
8.10 |
|
|
Labour |
John Ogden |
406 |
6.03 |
|
|
English Democrats |
Grant Greenham |
187 |
2.78 |
|
| Majority |
1496 |
22.20 |
|
| Turnout |
6738 |
45.14 |
-25.43 |
|
Conservative hold |
Swing |
|
|
| Hayling Island |
| Party |
Candidate |
Votes |
% |
±% |
|
Conservative |
Frank Pearce |
2579 |
47.05 |
|
|
UKIP |
Gary Kerrin |
1108 |
20.22 |
|
|
Liberal Democrat |
Paul Pritchard |
700 |
12.77 |
|
|
Labour |
Sheila Mealy |
443 |
8.08 |
|
|
Green |
Gill Leek |
436 |
7.95 |
|
|
English Democrats |
Christopher Pritchard |
215 |
3.92 |
|
| Majority |
1471 |
26.83 |
|
| Turnout |
5481 |
38.84 |
-25.33 |
|
Conservative hold |
Swing |
|
|
| Waterloo and Stakes North |
| Party |
Candidate |
Votes |
% |
±% |
|
Conservative |
Ian Beagley |
2667 |
61.85 |
|
|
Liberal Democrat |
Fred Dunford |
1298 |
30.10 |
|
|
Labour |
Howard Sherlock |
347 |
8.05 |
|
| Majority |
1369 |
31.75 |
|
| Turnout |
4312 |
33.36 |
-30.52 |
|
Conservative hold |
Swing |
|
|
New Forest
| Brockenhurst |
| Party |
Candidate |
Votes |
% |
±% |
|
Conservative |
Ken Thornber |
2899 |
58.32 |
|
|
Liberal Democrat |
Rachel Smith |
1235 |
24.84 |
|
|
UKIP |
Michael Biddiscombe |
654 |
13.16 |
|
|
Labour |
Stephen Short |
183 |
3.68 |
|
| Majority |
1664 |
33.48 |
|
| Turnout |
4971 |
43.16 |
-24.67 |
|
Conservative hold |
Swing |
|
|
| Fordingbridge |
| Party |
Candidate |
Votes |
% |
±% |
|
Conservative |
Edward Heron |
2686 |
54.91 |
|
|
Liberal Democrat |
Miranda Whitehead |
1989 |
40.66 |
|
|
Labour |
Brian Shemmings |
217 |
4.44 |
|
| Majority |
697 |
14.25 |
|
| Turnout |
4892 |
42.69 |
-27.04 |
|
Conservative hold |
Swing |
|
|
| Lymington |
| Party |
Candidate |
Votes |
% |
±% |
|
Conservative |
Adrian Evans |
2954 |
62.65 |
|
|
Liberal Democrat |
Paul Hickman |
1565 |
33.19 |
|
|
Labour |
Peter Coakes |
196 |
4.16 |
|
| Majority |
1389 |
29.46 |
|
| Turnout |
4715 |
38.60 |
-25.03 |
|
Conservative hold |
Swing |
|
|
| Milford and Hordle |
| Party |
Candidate |
Votes |
% |
±% |
|
Conservative |
Alan Rice |
3258 |
58.32 |
|
|
Liberal Democrat |
Wynford Davies |
1077 |
19.28 |
|
|
UKIP |
Celia Pilling |
997 |
17.85 |
|
|
Labour |
Amy Coakes |
254 |
4.55 |
|
| Majority |
2181 |
39.04 |
|
| Turnout |
5586 |
41.33 |
-23.58 |
|
Conservative hold |
Swing |
|
|
| New Milton |
| Party |
Candidate |
Votes |
% |
±% |
|
Conservative |
Mel Kendal |
2865 |
51.62 |
|
|
UKIP |
Nigel Cox |
1326 |
23.89 |
|
|
Independent |
John Evans |
1000 |
18.02 |
|
|
Labour |
Peter Dance |
359 |
6.47 |
|
| Majority |
1539 |
27.73 |
|
| Turnout |
5550 |
40.17 |
-26.57 |
|
Conservative hold |
Swing |
|
|
| Ringwood |
| Party |
Candidate |
Votes |
% |
±% |
|
Conservative |
Steve Rippon-Swaine |
2513 |
60.35 |
|
|
Liberal Democrat |
Mark Radford |
1341 |
32.20 |
|
|
Labour |
Peter Harper |
310 |
7.44 |
|
| Majority |
1172 |
28.15 |
|
| Turnout |
4164 |
35.55 |
-27.52 |
|
Conservative hold |
Swing |
|
|
| Totton South and Marchwood |
| Party |
Candidate |
Votes |
% |
±% |
|
Liberal Democrat |
David Harrison |
2641 |
54.92 |
|
|
Conservative |
David Russell |
1897 |
39.45 |
|
|
Labour |
Alun Barnett |
271 |
5.64 |
|
| Majority |
744 |
15.47 |
|
| Turnout |
4809 |
33.88 |
-29.19 |
|
Liberal Democrat hold |
Swing |
|
|
Rushmoor
| Aldershot East |
| Party |
Candidate |
Votes |
% |
±% |
|
Conservative |
Eric Neal |
1419 |
35.91 |
|
|
Labour |
Mike Roberts |
1088 |
27.54 |
|
|
Independent |
Peter Sandy |
700 |
17.72 |
|
|
Liberal Democrat |
Paul Bowers |
614 |
15.54 |
|
|
No Party |
Roger Watkins |
130 |
3.29 |
|
| Majority |
331 |
8.37 |
|
| Turnout |
3951 |
29.75 |
-27.37 |
|
Conservative hold |
Swing |
|
|
| Aldershot West |
| Party |
Candidate |
Votes |
% |
±% |
|
Conservative |
Roger James Kimber |
1811 |
55.93 |
|
|
Liberal Democrat |
Shaun Murphy |
757 |
23.38 |
|
|
Labour |
Alex Crawford |
670 |
20.69 |
|
| Majority |
1054 |
32.55 |
|
| Turnout |
3238 |
28.16 |
-24.78 |
|
Conservative hold |
Swing |
|
|
| Farnborough North |
| Party |
Candidate |
Votes |
% |
±% |
|
Conservative |
Roz Muschamp |
1451 |
34.41 |
|
|
Liberal Democrat |
Charlie Fraser-Fleming |
1295 |
30.71 |
|
|
Independent |
Jon Paul Weston |
673 |
15.96 |
|
|
BNP |
Warren Glass |
529 |
12.54 |
|
|
Labour |
Jonathan Slater |
269 |
6.38 |
|
| Majority |
156 |
3.70 |
|
| Turnout |
4217 |
34.42 |
-21.51 |
|
Conservative hold |
Swing |
|
|
| Farnborough South |
| Party |
Candidate |
Votes |
% |
±% |
|
Conservative |
John Wall |
2715 |
55.13 |
|
|
Liberal Democrat |
Craig Card |
1866 |
37.89 |
|
|
Labour |
Bill Tootill |
344 |
6.98 |
|
| Majority |
849 |
17.24 |
|
| Turnout |
4925 |
37.97 |
-26.72 |
|
Conservative hold |
Swing |
|
|
| Farnborough West |
| Party |
Candidate |
Votes |
% |
±% |
|
Conservative |
Carol Leversha |
2707 |
57.45 |
|
|
Liberal Democrat |
Sue Gadsby |
1658 |
35.19 |
|
|
Labour |
Clive Grattan |
347 |
7.36 |
|
| Majority |
1049 |
22.26 |
|
| Turnout |
4712 |
34.82 |
-30.17 |
|
Conservative hold |
Swing |
|
|
Test Valley
| Andover South |
| Party |
Candidate |
Votes |
% |
±% |
|
Conservative |
David Kirk |
2102 |
49.09 |
|
|
Liberal Democrat |
Vincent McGarry |
961 |
22.44 |
|
|
UKIP |
Bill McCabe |
916 |
21.39 |
|
|
Labour |
John Newland |
303 |
7.08 |
|
| Majority |
1141 |
26.65 |
|
| Turnout |
4282 |
35.73 |
-28.14 |
|
Conservative hold |
Swing |
|
|
| Romsey Extra |
| Party |
Candidate |
Votes |
% |
±% |
|
Conservative |
Roy Perry |
3054 |
58.44 |
|
|
Liberal Democrat |
Kath Tilling |
1986 |
38.00 |
|
|
Labour |
David Stevens |
186 |
3.56 |
|
| Majority |
1068 |
20.44 |
|
| Turnout |
5226 |
43.90 |
-26.27 |
|
Conservative hold |
Swing |
|
|
| Test Valley Central |
| Party |
Candidate |
Votes |
% |
±% |
|
Conservative |
Andrew Gibson |
4063 |
60.61 |
|
|
Liberal Democrat |
Richard Rowles |
1705 |
25.43 |
|
|
UKIP |
Stan Oram |
702 |
10.47 |
|
|
Labour |
Paul Doran |
234 |
3.49 |
|
| Majority |
2358 |
35.18 |
|
| Turnout |
6704 |
46.43 |
-25.71 |
|
Conservative hold |
Swing |
|
|
Winchester
| Bishops Waltham |
| Party |
Candidate |
Votes |
% |
±% |
|
Liberal Democrat |
Peter Mason |
2870 |
46.22 |
|
|
Conservative |
Laurence Ruffell |
2357 |
37.96 |
|
|
UKIP |
Colin Mason |
542 |
8.73 |
|
|
Green |
Jim Kirkpatrick |
311 |
5.01 |
|
|
Labour |
Patricia Hayward |
129 |
2.08 |
|
| Majority |
513 |
8.26 |
|
| Turnout |
6209 |
49.49 |
-24.71 |
|
Liberal Democrat hold |
Swing |
|
|
| Itchen Valley |
| Party |
Candidate |
Votes |
% |
±% |
|
Liberal Democrat |
Jackie Porter |
3701 |
53.59 |
|
|
Conservative |
George Beckett |
2524 |
36.55 |
|
|
UKIP |
David Samuel |
344 |
4.98 |
|
|
Green |
Alison Craig |
234 |
3.39 |
|
|
Labour |
Robin Atkins |
103 |
1.49 |
|
| Majority |
1177 |
17.04 |
|
| Turnout |
6906 |
55.23 |
-20.61 |
|
Liberal Democrat hold |
Swing |
|
|
| Meon Valley |
| Party |
Candidate |
Votes |
% |
±% |
|
Conservative |
Felicity Hindson |
3502 |
61.49 |
|
|
Liberal Democrat |
Sheila Campbell |
1454 |
25.53 |
|
|
UKIP |
John Clark |
586 |
10.29 |
|
|
Labour |
David Picton-Jones |
153 |
2.69 |
|
| Majority |
2048 |
35.96 |
|
| Turnout |
5695 |
50.05 |
-26.91 |
|
Conservative hold |
Swing |
|
|
| Winchester Eastgate |
| Party |
Candidate |
Votes |
% |
±% |
|
Liberal Democrat |
Brian Collin |
2651 |
42.56 |
|
|
Conservative |
Ian Tait |
2313 |
37.13 |
|
|
Labour |
Chris Pines |
510 |
8.19 |
|
|
Green |
Rupert Pitt |
426 |
6.84 |
|
|
UKIP |
Lawrence Hole |
329 |
5.28 |
|
| Majority |
338 |
5.43 |
|
| Turnout |
6229 |
43.77 |
-23.00 |
|
Liberal Democrat hold |
Swing |
|
|
| Winchester Westgate |
| Party |
Candidate |
Votes |
% |
±% |
|
Liberal Democrat |
Phryn Dickens |
3101 |
52.16 |
|
|
Conservative |
Roger Davey |
1829 |
30.77 |
|
|
Green |
Dave Walker-Nix |
373 |
6.27 |
|
|
UKIP |
Douglas Reed |
323 |
5.43 |
|
|
Labour |
Patrick Davies |
319 |
5.37 |
|
| Majority |
1272 |
21.39 |
|
| Turnout |
5945 |
43.65 |
-26.66 |
|
Liberal Democrat hold |
Swing |
|
|
References