Hammersmith South (UK Parliament constituency)
| Hammersmith South | |
|---|---|
|
Former Borough constituency for the House of Commons | |
| County | County of London |
| 1918–1955 | |
| Number of members | One |
| Replaced by | Barons Court |
| Created from | Hammersmith |

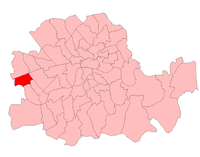
Hammersmith South in the Parliamentary County of London, showing boundaries used from 1918 to 1950

Hammersmith South in the Parliamentary County of London, showing boundaries used from 1950 to 1955.
Hammersmith South was a borough constituency in the Metropolitan Borough of Hammersmith in west London. It returned one Member of Parliament (MP) to the House of Commons of the Parliament of the United Kingdom, elected by the first-past-the-post system.
The constituency was created when the Hammersmith constituency was divided for the 1918 general election. It was abolished for the 1955 general election.
Members of Parliament
| Election | Member | Party | |
|---|---|---|---|
| 1918 | Sir William James Bull | Coalition Conservative | |
| 1922 | Conservative | ||
| 1929 | Daniel Chater | Labour Co-operative | |
| 1931 | James Douglas Cooke | Conservative | |
| 1945 | William Thomas Adams | Labour Co-operative | |
| 1949 | William Thomas Williams | Labour Co-operative | |
| 1955 | constituency abolished: see Hammersmith | ||
Election results
Elections in the 1910s

Atholl Robertson
| UK general election, 1918 | |||||
|---|---|---|---|---|---|
| Party | Candidate | Votes | % | ±% | |
| Conservative | 8,592 | 65.6 | n/a | ||
| Liberal | Thomas Atholl Robertson | 2,555 | 19.5 | n/a | |
| Labour | John Thomas Westcott | 1,958 | 14.9 | n/a | |
| Majority | 6,037 | 46.1 | n/a | ||
| Turnout | n/a | ||||
| Conservative win | |||||
- endorsed by the Coalition Government
Elections in the 1920s
.jpg)
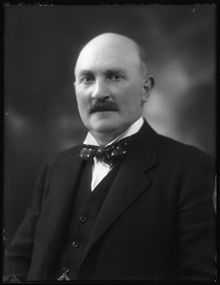
Sir William Bull
| UK general election, 1922 | |||||
|---|---|---|---|---|---|
| Party | Candidate | Votes | % | ±% | |
| Unionist | Rt Hon. Sir William James Bull | 10,877 | 63.0 | -2.5 | |
| Labour | Wyndham James Albery | 6,397 | 37.0 | +22.1 | |
| Majority | 4,480 | 26.0 | -24.6 | ||
| Turnout | 56.4 | ||||
| Unionist hold | Swing | -12.3 | |||
| UK general election, 1923 | |||||
|---|---|---|---|---|---|
| Party | Candidate | Votes | % | ±% | |
| Unionist | Rt Hon. Sir William James Bull | 8,184 | 43.4 | ||
| Labour | Wyndham James Albery | 6,974 | 36.9 | ||
| Liberal | Ernest Devan Wetton | 3,723 | 19.7 | n/a | |
| Majority | 1,210 | 6.5 | |||
| Turnout | 61.1 | +4.7 | |||
| Unionist hold | Swing | ||||

Christopher Addison
| UK general election, 1924 | |||||
|---|---|---|---|---|---|
| Party | Candidate | Votes | % | ±% | |
| Unionist | Rt Hon. Sir William James Bull | 12,679 | 55.4 | ||
| Labour | Rt Hon. Christopher Addison | 8,804 | 38.5 | ||
| Liberal | Ernest Devan Wetton | 1,393 | 6.1 | ||
| Majority | 3,875 | 16.9 | |||
| Turnout | 72.3 | ||||
| Unionist hold | Swing | ||||
| UK general election, 1929 | |||||
|---|---|---|---|---|---|
| Party | Candidate | Votes | % | ±% | |
| Labour | Daniel Chater | 12,630 | 43.8 | ||
| Unionist | Sir John Ferguson | 12,218 | 42.4 | ||
| Liberal | Capt. J J Davies | 3,976 | 13.8 | ||
| Majority | 412 | 1.4 | |||
| Turnout | 67.3 | ||||
| Labour gain from Unionist | Swing | ||||
Elections in the 1930s
| UK general election, 1931 | |||||
|---|---|---|---|---|---|
| Party | Candidate | Votes | % | ±% | |
| Conservative | James Douglas Cooke | 21,018 | 71.5 | +27.7 | |
| Labour | Daniel Chater | 8,390 | 28.5 | -13.9 | |
| Majority | 12,628 | 42.9 | 41.6 | ||
| Turnout | 29,408 | 68.0 | |||
| Conservative gain from Labour | Swing | +20.8 | |||
| UK general election, 1935 | |||||
|---|---|---|---|---|---|
| Party | Candidate | Votes | % | ±% | |
| Conservative | James Douglas Cooke | 15,377 | 62.3 | ||
| Labour | William Thomas Adams | 9,309 | 37.7 | ||
| Majority | 6,068 | 24.6 | |||
| Turnout | 24,686 | 60.1 | |||
| Conservative hold | Swing | ||||
Elections in the 1940s
| UK general election, 1945: Hammersmith South | |||||
|---|---|---|---|---|---|
| Party | Candidate | Votes | % | ±% | |
| Labour | William Thomas Adams | 12,502 | 58.0 | ||
| Conservative | Sir James Douglas Cooke | 9,044 | 42.0 | ||
| Majority | 3,458 | 16.0 | |||
| Turnout | 65.9 | ||||
| Labour gain from Conservative | Swing | ||||
| Hammersmith South by-election, 1949 | |||||
|---|---|---|---|---|---|
| Party | Candidate | Votes | % | ±% | |
| Labour | William Thomas Williams | 15,223 | 52.8 | ||
| Conservative | Anthony Fell | 13,610 | 47.2 | ||
| Majority | 1,613 | 5.6 | |||
| Turnout | 60.6 | ||||
| Labour hold | Swing | ||||
Elections in the 1950s
| General Election 1950: Hammersmith South[1] | |||||
|---|---|---|---|---|---|
| Party | Candidate | Votes | % | ±% | |
| Labour | William Thomas Williams | 18,825 | 51.8 | ||
| Conservative | Anthony Fell | 16,161 | 44.4 | ||
| Liberal | John Stanton Ritter | 1,400 | 3.8 | n/a | |
| Majority | 2,664 | 7.4 | |||
| Turnout | |||||
| Labour hold | Swing | ||||
| United Kingdom general election, 1951: Hammersmith South[2] | |||||
|---|---|---|---|---|---|
| Party | Candidate | Votes | % | ±% | |
| Labour | William Thomas Williams | 19,273 | 54.6 | +2.8 | |
| Conservative | Robert N E Hinton | 16,038 | 45.4 | +1.0 | |
| Majority | 3,235 | 9.2 | +1.8 | ||
| Turnout | 80.2 | ||||
| Labour hold | Swing | +0.9 | |||
References
- Craig, F. W. S. (1983) [1969]. British parliamentary election results 1918-1949 (3rd edition ed.). Chichester: Parliamentary Research Services. ISBN 0-900178-06-X.
Leigh Rayment's Historical List of MPs – Constituencies beginning with "H" (part 1)