Gross domestic product
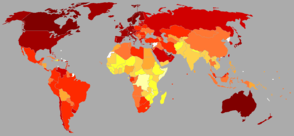
_in_US%24.png)
Gross domestic product (GDP) is defined by the Organisation for Economic Co-operation and Development (OECD) as "an aggregate measure of production equal to the sum of the gross values added of all resident, institutional units engaged in production (plus any taxes, and minus any subsidies, on products not included in the value of their outputs)."[2]
GDP estimates are commonly used to measure the economic performance of a whole country or region, but can also measure the relative contribution of an industry sector. This is possible because GDP is a measure of 'value added' rather than sales; it adds each firm's value added (the value of its output minus the value of goods that are used up in producing it). For example, a firm buys steel and adds value to it by producing a car; double counting would occur if GDP added together the value of the steel and the value of the car.[3] Because it is based on value added, GDP also increases when an enterprise reduces its use of materials or other resources ('intermediate consumption') to produce the same output.
The more familiar use of GDP estimates is to calculate the growth of the economy from year to year (and recently from quarter to quarter). The pattern of GDP growth is held to indicate the success or failure of economic policy and to determine whether an economy is 'in recession'.
History
The concept of GDP was first developed by Simon Kuznets for a US Congress report in 1934.[4] In this report, Kuznets warned against its use as a measure of welfare (see below under limitations and criticisms). After the Bretton Woods conference in 1944, GDP became the main tool for measuring a country's economy.[5] At that time Gross National Product (GNP) was the preferred estimate, which differed from GDP in that it measured production by a country's citizens at home and abroad rather than its 'resident institutional units' (see OECD definition above). The switch to GDP was in the 1980s.
The history of the concept of GDP should be distinguished from the history of changes in ways of estimating it. The value added by firms is relatively easy to calculate from their accounts, but the value added by the public sector, by financial industries, and by intangible asset creation is more complex. These activities are increasingly important in developed economies, and the international conventions governing their estimation and their inclusion or exclusion in GDP regularly change in an attempt to keep up with industrial advances. In the words of one academic economist "The actual number for GDP is therefore the product of a vast patchwork of statistics and a complicated set of processes carried out on the raw data to fit them to the conceptual framework."[6]
Angus Maddison calculated historical GDP figures going back to 1830 and before.
Determining GDP
| Economics |
|---|
 |
|
|
| By application |
|
| Lists |
|
GDP can be determined in three ways, all of which should, in principle, give the same result. They are the production (or output or value added) approach, the income approach, or the expenditure approach.
The most direct of the three is the production approach, which sums the outputs of every class of enterprise to arrive at the total. The expenditure approach works on the principle that all of the product must be bought by somebody, therefore the value of the total product must be equal to people's total expenditures in buying things. The income approach works on the principle that the incomes of the productive factors ("producers," colloquially) must be equal to the value of their product, and determines GDP by finding the sum of all producers' incomes.[7]
Production approach
This approach mirrors the OECD definition given above.
- Estimate the gross value of domestic output out of the many various economic activities;
- Determine the intermediate consumption, i.e., the cost of material, supplies and services used to produce final goods or services.
- Deduct intermediate consumption from gross value to obtain the gross value added.
Gross value added = gross value of output – value of intermediate consumption.
Value of output = value of the total sales of goods and services plus value of changes in the inventories.
The sum of the gross value added in the various economic activities is known as "GDP at factor cost".
GDP at factor cost plus indirect taxes less subsidies on products = "GDP at producer price".
For measuring output of domestic product, economic activities (i.e. industries) are classified into various sectors. After classifying economic activities, the output of each sector is calculated by any of the following two methods:
- By multiplying the output of each sector by their respective market price and adding them together
- By collecting data on gross sales and inventories from the records of companies and adding them together
The gross value of all sectors is then added to get the gross value added (GVA) at factor cost. Subtracting each sector's intermediate consumption from gross output gives the GDP at factor cost. Adding indirect tax minus subsidies in GDP at factor cost gives the "GDP at producer prices".
Income approach
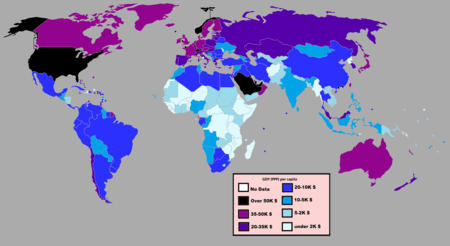
| over $102,400 $51,200–102,400 $25,600–51,200 $12,800–25,600 $6,400–12,800 $3,200–6,400 |
$1,600–3,200 $800–1,600 $400–800 below $400 unavailable |
The second way of estimating GDP is to use "the sum of primary incomes distributed by resident producer units".[2]
If GDP is calculated this way it is sometimes called gross domestic income (GDI), or GDP (I). GDI should provide the same amount as the expenditure method described later. (By definition, GDI = GDP. In practice, however, measurement errors will make the two figures slightly off when reported by national statistical agencies.)
This method measures GDP by adding incomes that firms pay households for factors of production they hire - wages for labour, interest for capital, rent for land and profits for entrepreneurship.
The US "National Income and Expenditure Accounts" divide incomes into five categories:
- Wages, salaries, and supplementary labour income
- Corporate profits
- Interest and miscellaneous investment income
- Farmers' incomes
- Income from non-farm unincorporated businesses
These five income components sum to net domestic income at factor cost.
Two adjustments must be made to get GDP:
- Indirect taxes minus subsidies are added to get from factor cost to market prices.
- Depreciation (or capital consumption allowance) is added to get from net domestic product to gross domestic product.
Total income can be subdivided according to various schemes, leading to various formulae for GDP measured by the income approach. A common one is:
- GDP = compensation of employees + gross operating surplus + gross mixed income + taxes less subsidies on production and imports
- GDP = COE + GOS + GMI + TP & M – SP & M
- Compensation of employees (COE) measures the total remuneration to employees for work done. It includes wages and salaries, as well as employer contributions to social security and other such programs.
- Gross operating surplus (GOS) is the surplus due to owners of incorporated businesses. Often called profits, although only a subset of total costs are subtracted from gross output to calculate GOS.
- Gross mixed income (GMI) is the same measure as GOS, but for unincorporated businesses. This often includes most small businesses.
The sum of COE, GOS and GMI is called total factor income; it is the income of all of the factors of production in society. It measures the value of GDP at factor (basic) prices. The difference between basic prices and final prices (those used in the expenditure calculation) is the total taxes and subsidies that the government has levied or paid on that production. So adding taxes less subsidies on production and imports converts GDP at factor cost to GDP(I).
Total factor income is also sometimes expressed as:
- Total factor income = employee compensation + corporate profits + proprietor's income + rental income + net interest[9]
Yet another formula for GDP by the income method is:

where R : rents
I : interests
P : profits
SA : statistical adjustments (corporate income taxes, dividends, undistributed corporate profits)
W : wages.
Expenditure approach
The third way to estimate GDP is to calculate the sum of the final uses of goods and services (all uses except intermediate consumption) measured in purchasers' prices.[2]
In economics, most things produced are produced for sale and then sold. Therefore, measuring the total expenditure of money used to buy things is a way of measuring production. This is known as the expenditure method of calculating GDP. Note that if you knit yourself a sweater, it is production but does not get counted as GDP because it is never sold. Sweater-knitting is a small part of the economy, but if one counts some major activities such as child-rearing (generally unpaid) as production, GDP ceases to be an accurate indicator of production. Similarly, if there is a long term shift from non-market provision of services (for example cooking, cleaning, child rearing, do-it yourself repairs) to market provision of services, then this trend toward increased market provision of services may mask a dramatic decrease in actual domestic production, resulting in overly optimistic and inflated reported GDP. This is particularly a problem for economies which have shifted from production economies to service economies.
Components of GDP by expenditure
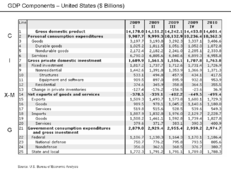
GDP (Y) is the sum of consumption (C), investment (I), government spending (G) and net exports (X – M).
- Y = C + I + G + (X − M)
Here is a description of each GDP component:
- C (consumption) is normally the largest GDP component in the economy, consisting of private (household final consumption expenditure) in the economy. These personal expenditures fall under one of the following categories: durable goods, non-durable goods, and services. Examples include food, rent, jewelry, gasoline, and medical expenses but does not include the purchase of new housing.
- I (investment) includes, for instance, business investment in equipment, but does not include exchanges of existing assets. Examples include construction of a new mine, purchase of software, or purchase of machinery and equipment for a factory. Spending by households (not government) on new houses is also included in investment. In contrast to its colloquial meaning, "investment" in GDP does not mean purchases of financial products. Buying financial products is classed as 'saving', as opposed to investment. This avoids double-counting: if one buys shares in a company, and the company uses the money received to buy plant, equipment, etc., the amount will be counted toward GDP when the company spends the money on those things; to also count it when one gives it to the company would be to count two times an amount that only corresponds to one group of products. Buying bonds or stocks is a swapping of deeds, a transfer of claims on future production, not directly an expenditure on products.
- G (government spending) is the sum of government expenditures on final goods and services. It includes salaries of public servants, purchases of weapons for the military and any investment expenditure by a government. It does not include any transfer payments, such as social security or unemployment benefits.
- X (exports) represents gross exports. GDP captures the amount a country produces, including goods and services produced for other nations' consumption, therefore exports are added.
- M (imports) represents gross imports. Imports are subtracted since imported goods will be included in the terms G, I, or C, and must be deducted to avoid counting foreign supply as domestic.
A fully equivalent definition is that GDP (Y) is the sum of final consumption expenditure (FCE), gross capital formation (GCF), and net exports (X – M).
- Y = FCE + GCF+ (X − M)
FCE can then be further broken down by three sectors (households, governments and non-profit institutions serving households) and GCF by five sectors (non-financial corporations, financial corporations, households, governments and non-profit institutions serving households). The advantage of this second definition is that expenditure is systematically broken down, firstly, by type of final use (final consumption or capital formation) and, secondly, by sectors making the expenditure, whereas the first definition partly follows a mixed delimitation concept by type of final use and sector.
Note that C, G, and I are expenditures on final goods and services; expenditures on intermediate goods and services do not count. (Intermediate goods and services are those used by businesses to produce other goods and services within the accounting year.[10] )
According to the U.S. Bureau of Economic Analysis, which is responsible for calculating the national accounts in the United States, "In general, the source data for the expenditures components are considered more reliable than those for the income components [see income method, below]."[11]
Examples of GDP component variables
C, I, G, and NX(net exports): If a person spends money to renovate a hotel to increase occupancy rates, the spending represents private investment, but if he buys shares in a consortium to execute the renovation, it is saving. The former is included when measuring GDP (in I), the latter is not. However, when the consortium conducted its own expenditure on renovation, that expenditure would be included in GDP.
If a hotel is a private home, spending for renovation would be measured as consumption, but if a government agency converts the hotel into an office for civil servants, the spending would be included in the public sector spending, or G.
If the renovation involves the purchase of a chandelier from abroad, that spending would be counted as C, G, or I (depending on whether a private individual, the government, or a business is doing the renovation), but then counted again as an import and subtracted from the GDP so that GDP counts only goods produced within the country.
If a domestic producer is paid to make the chandelier for a foreign hotel, the payment would not be counted as C, G, or I, but would be counted as an export.
A "production boundary" delimits what will be counted as GDP.
"One of the fundamental questions that must be addressed in preparing the national economic accounts is how to define the production boundary–that is, what parts of the myriad human activities are to be included in or excluded from the measure of the economic production."[12]
All output for market is at least in theory included within the boundary. Market output is defined as that which is sold for "economically significant" prices; economically significant prices are "prices which have a significant influence on the amounts producers are willing to supply and purchasers wish to buy."[13] An exception is that illegal goods and services are often excluded even if they are sold at economically significant prices (Australia and the United States exclude them).
This leaves non-market output. It is partly excluded and partly included. First, "natural processes without human involvement or direction" are excluded.[14] Also, there must be a person or institution that owns or is entitled to compensation for the product. An example of what is included and excluded by these criteria is given by the United States' national accounts agency: "the growth of trees in an uncultivated forest is not included in production, but the harvesting of the trees from that forest is included."[15]
Within the limits so far described, the boundary is further constricted by "functional considerations."[16] The Australian Bureau for Statistics explains this: "The national accounts are primarily constructed to assist governments and others to make market-based macroeconomic policy decisions, including analysis of markets and factors affecting market performance, such as inflation and unemployment." Consequently, production that is, according to them, "relatively independent and isolated from markets," or "difficult to value in an economically meaningful way" [i.e., difficult to put a price on] is excluded.[17] Thus excluded are services provided by people to members of their own families free of charge, such as child rearing, meal preparation, cleaning, transportation, entertainment of family members, emotional support, care of the elderly.[18] Most other production for own (or one's family's) use is also excluded, with two notable exceptions which are given in the list later in this section.
Non-market outputs that are included within the boundary are listed below. Since, by definition, they do not have a market price, the compilers of GDP must impute a value to them, usually either the cost of the goods and services used to produce them, or the value of a similar item that is sold on the market.
- Goods and services provided by governments and non-profit organizations free of charge or for economically insignificant prices are included. The value of these goods and services is estimated as equal to their cost of production. This ignores the consumer surplus generated by an efficient and effective government supplied infrastructure. For example, government-provided clean water confers substantial benefits above its cost. Ironically, lack of such infrastructure which would result in higher water prices (and probably higher hospital and medication expenditures) would be reflected as a higher GDP. This may also cause a bias that mistakenly favors inefficient privatizations since some of the consumer surplus from privatized entities' sale of goods and services are indeed reflected in GDP.[19]
- Goods and services produced for own-use by businesses are attempted to be included. An example of this kind of production would be a machine constructed by an engineering firm for use in its own plant.
- Renovations and upkeep by an individual to a home that she owns and occupies are included. The value of the upkeep is estimated as the rent that she could charge for the home if she did not occupy it herself. This is the largest item of production for own use by an individual (as opposed to a business) that the compilers include in GDP.[19] If the measure uses historical or book prices for real estate, this will grossly underestimate the value of the rent in real estate markets which have experienced significant price increases (or economies with general inflation). Furthermore, depreciation schedules for houses often accelerate the accounted depreciation relative to actual depreciation (a well-built house can be lived in for several hundred years – a very long time after it has been fully depreciated). In summary, this is likely to grossly underestimate the value of existing housing stock on consumers' actual consumption or income.
- Agricultural production for consumption by oneself or one's household is included.
- Services (such as chequeing-account maintenance and services to borrowers) provided by banks and other financial institutions without charge or for a fee that does not reflect their full value have a value imputed to them by the compilers and are included. The financial institutions provide these services by giving the customer a less advantageous interest rate than they would if the services were absent; the value imputed to these services by the compilers is the difference between the interest rate of the account with the services and the interest rate of a similar account that does not have the services. According to the United States Bureau for Economic Analysis, this is one of the largest imputed items in the GDP.[20]
GDP vs GNI
GDP can be contrasted with gross national product (GNP) or, as it is now known, gross national income (GNI). The difference is that GDP defines its scope according to location, while GNI defines its scope according to ownership. In a global context, world GDP and world GNI are, therefore, equivalent terms.
GDP is product produced within a country's borders; GNI is product produced by enterprises owned by a country's citizens. The two would be the same if all of the productive enterprises in a country were owned by its own citizens, and those citizens did not own productive enterprises in any other countries. In practice, however, foreign ownership makes GDP and GNI non-identical. Production within a country's borders, but by an enterprise owned by somebody outside the country, counts as part of its GDP but not its GNI; on the other hand, production by an enterprise located outside the country, but owned by one of its citizens, counts as part of its GNI but not its GDP.
For example, the GNI of the USA is the value of output produced by American-owned firms, regardless of where the firms are located. Similarly, if a country becomes increasingly in debt, and spends large amounts of income servicing this debt this will be reflected in a decreased GNI but not a decreased GDP. Similarly, if a country sells off its resources to entities outside their country this will also be reflected over time in decreased GNI, but not decreased GDP. This would make the use of GDP more attractive for politicians in countries with increasing national debt and decreasing assets.
Gross national income (GNI) equals GDP plus income receipts from the rest of the world minus income payments to the rest of the world.[21]
In 1991, the United States switched from using GNP to using GDP as its primary measure of production.[22] The relationship between United States GDP and GNP is shown in table 1.7.5 of the National Income and Product Accounts.[23]
International standards
The international standard for measuring GDP is contained in the book System of National Accounts (1993), which was prepared by representatives of the International Monetary Fund, European Union, Organization for Economic Co-operation and Development, United Nations and World Bank. The publication is normally referred to as SNA93 to distinguish it from the previous edition published in 1968 (called SNA68) [24]
SNA93 provides a set of rules and procedures for the measurement of national accounts. The standards are designed to be flexible, to allow for differences in local statistical needs and conditions.
National measurement
Within each country GDP is normally measured by a national government statistical agency, as private sector organizations normally do not have access to the information required (especially information on expenditure and production by governments).
Interest rates
Net interest expense is a transfer payment in all sectors except the financial sector. Net interest expenses in the financial sector are seen as production and value added and are added to GDP.
Nominal GDP and adjustments to GDP
The raw GDP figure as given by the equations above is called the nominal, historical, or current, GDP. When one compares GDP figures from one year to another, it is desirable to compensate for changes in the value of money – i.e., for the effects of inflation or deflation. To make it more meaningful for year-to-year comparisons, it may be multiplied by the ratio between the value of money in the year the GDP was measured and the value of money in a base year.
For example, suppose a country's GDP in 1990 was $100 million and its GDP in 2000 was $300 million. Suppose also that inflation had halved the value of its currency over that period. To meaningfully compare its GDP in 2000 to its GDP in 1990, we could multiply the GDP in 2000 by one-half, to make it relative to 1990 as a base year. The result would be that the GDP in 2000 equals $300 million × one-half = $150 million, in 1990 monetary terms. We would see that the country's GDP had realistically increased 50 percent over that period, not 200 percent, as it might appear from the raw GDP data. The GDP adjusted for changes in money value in this way is called the real, or constant, GDP.
The factor used to convert GDP from current to constant values in this way is called the GDP deflator. Unlike consumer price index, which measures inflation or deflation in the price of household consumer goods, the GDP deflator measures changes in the prices of all domestically produced goods and services in an economy including investment goods and government services, as well as household consumption goods.[25]
Constant-GDP figures allow us to calculate a GDP growth rate, which indicates how much a country's production has increased (or decreased, if the growth rate is negative) compared to the previous year.
- Real GDP growth rate for year n = [(Real GDP in year n) − (Real GDP in year n − 1)] / (Real GDP in year n − 1)
Another thing that it may be desirable to account for is population growth. If a country's GDP doubled over a certain period, but its population tripled, the increase in GDP may not mean that the standard of living increased for the country's residents; the average person in the country is producing less than they were before. Per-capita GDP is a measure to account for population growth.
Cross-border comparison and PPP
The level of GDP in different countries may be compared by converting their value in national currency according to either the current currency exchange rate, or the purchasing power parity exchange rate.
- Current currency exchange rate is the exchange rate in the international foreign exchange market.
- Purchasing power parity exchange rate is the exchange rate based on the purchasing power parity (PPP) of a currency relative to a selected standard (usually the United States dollar). This is a comparative (and theoretical) exchange rate, the only way to directly realize this rate is to sell an entire CPI basket in one country, convert the cash at the currency market rate & then rebuy that same basket of goods in the other country (with the converted cash). Going from country to country, the distribution of prices within the basket will vary; typically, non-tradable purchases will consume a greater proportion of the basket's total cost in the higher GDP country, per the Balassa-Samuelson effect.
The ranking of countries may differ significantly based on which method is used.
- The current exchange rate method converts the value of goods and services using global currency exchange rates. The method can offer better indications of a country's international purchasing power. For instance, if 10% of GDP is being spent on buying hi-tech foreign arms, the number of weapons purchased is entirely governed by current exchange rates, since arms are a traded product bought on the international market. There is no meaningful 'local' price distinct from the international price for high technology goods.
- The purchasing power parity method accounts for the relative effective domestic purchasing power of the average producer or consumer within an economy. The method can provide a better indicator of the living standards especially of less developed countries, because it compensates for the weakness of local currencies in the international markets. It also offers better indication of total national wealth. For example, India ranks 10th by nominal GDP, but 3rd by PPP. The PPP method of GDP conversion is more relevant to non-traded goods and services. In the above example if hi-tech weapons are to be produced internally their amount will be governed by GDP(PPP) rather than nominal GDP.
There is a clear pattern of the purchasing power parity method decreasing the disparity in GDP between high and low income (GDP) countries, as compared to the current exchange rate method. This finding is called the Penn effect.
For more information, see Measures of national income and output.
Per unit GDP
GDP is an aggregate figure that does not consider differing sizes of nations. Therefore GDP can be stated as GDP per capita (per person) in which total GDP is divided by the resident population on a given date, GDP per citizen where total GDP is divided by the numbers of citizens residing in the country on a given date, and less commonly GDP per unit of a resource input, such as GDP per GJ of energy or Gross domestic product per barrel. GDP per citizen in the above case is similar to GDP per capita in most nations. However, in nations with very high proportions of temporary foreign workers like in Persian Gulf nations, the two figures can be vastly different.
| 2008 | 2009 | 2010 | 2011 | 2012 | |
|---|---|---|---|---|---|
| | 46,760 | 45,305 | 46,612 | 48,112 | 49,641 |
| | 43,147 | 35,331 | 36,238 | 38,974 | 39,090 |
Source:Helgi Library,[26] World Bank
Standard of living and GDP
GDP per capita is often used as an indicator of living standards.[27] Notably on the rationale that all citizens would benefit from their country's increased economic production as it leads to an increase in consumption opportunities which in turn increases the standard of living.[28] Similarly, GDP per capita is not a measure of personal income. In fact GDP may increase while real incomes for the majority decline.
The major advantage of GDP per capita as an indicator of standard of living is that it is measured frequently, widely, and consistently. It is measured frequently in that most countries provide information on GDP on a quarterly basis, allowing trends to be seen quickly. It is measured widely in that some measure of GDP is available for almost every country in the world, allowing inter-country comparisons. It is measured consistently in that the technical definition of GDP is relatively consistent among countries.
GDP is a neutral measure which merely shows an economy's general ability to pay for externalities such as social and environmental concerns.[29] In essence it is intended to be a measure of total national economic activity — a separate concept. As a consequence GDP not does include several factors that influence the standard of living. In particular, it fails to account for:
- Wealth distribution – GDP does not account for variances in incomes of various demographic groups. See income inequality metrics for discussion of a variety of inequality-based economic measures.[30]
- Non-market transactions–GDP excludes activities that are not provided through the market, such as household production and volunteer or unpaid services. As a result, GDP is understated. The work of New Zealand economist Marilyn Waring has highlighted that if a concerted attempt to factor in unpaid work were made, then it would in part undo the injustices of unpaid (and in some cases, slave) labour, and also provide the political transparency and accountability necessary for democracy.
- Underground economy– official GDP estimates may not take into account the underground economy, in which transactions contributing to production, such as illegal trade and tax-avoiding activities, are unreported, causing GDP to be underestimated.[30]
- Asset value– GDP does not take into account the value of all assets in an economy. This is akin to ignoring a company's balance sheet, and judging it solely on the basis of its income statement.
- Non-monetary economy– GDP omits economies where no money comes into play at all, resulting in inaccurate or abnormally low GDP figures. For example, in countries with major business transactions occurring informally, portions of local economy are not easily registered. Bartering may be more prominent than the use of money, even extending to services.[30]
- GDP also ignores subsistence production.
- Quality improvements and inclusion of new products– by not adjusting for quality improvements and new products, GDP understates true economic growth. For instance, although computers today are less expensive and more powerful than computers from the past, GDP treats them as the same products by only accounting for the monetary value. The introduction of new products is also difficult to measure accurately and is not reflected in GDP despite the fact that it may increase the standard of living. For example, even the richest person in 1900 could not purchase standard products, such as antibiotics and cell phones, that an average consumer can buy today, since such modern conveniences did not exist then.
- What is being produced– GDP counts work that produces no net change or that results from repairing harm. For example, rebuilding after a natural disaster or war may produce a considerable amount of economic activity and thus boost GDP. The economic value of health care is another classic example—it may raise GDP if many people are sick and they are receiving expensive treatment, but it is not a desirable situation. Alternative economic estimates, such as the standard of living or discretionary income per capita try to measure the human utility of economic activity. See uneconomic growth.[30]
- Sustainability of growth– GDP is a measurement of economic historic activity and is not necessarily a projection. A country may achieve a temporarily high GDP from use of natural resources or by misallocating investment.
- Nominal GDP does not measure variations in purchasing power or costs of living by area, so when the GDP figure is deflated over time, GDP growth can vary greatly depending on the basket of goods used and the relative proportions used to deflate the GDP figure.
- Cross-border comparisons of GDP can be inaccurate as they do not take into account local differences in the quality of goods, even when adjusted for purchasing power parity. This type of adjustment to an exchange rate is controversial because of the difficulties of finding comparable baskets of goods to compare purchasing power across countries. For instance, people in country A may consume the same number of locally produced apples as in country B, but apples in country A are of a more tasty variety. This difference in material well being will not show up in GDP statistics. This is especially true for goods that are not traded globally, such as houses.
- Externalities – Economic growth usually entails an increase in negative externalities that cannot directly be measured by GDP[28][30]
It can be argued that GDP per capita as an indicator standard of living can be proven through these factors:[27][31]
- More goods and services are available to consumers
- Consumers are in a better position to buy goods.
- Productivity correlates with standard of living, and GDP per capita takes this into account.
- People who live in countries with higher real GDP per capita tend to be more educated and live longer.
- Goods and services are a key element of economic well-being.
GDP per capita as a standard of living is a continued usage because of that fact that people have a fairly accurate idea of what it is and that it is tough to come up with quantitative measures for things like wellbeing, quality of life, and happiness.[27]
In conclusion, the argument for using GDP as a standard-of-living proxy is not that it is a good indicator of the absolute level of standard of living, but that living standards tend to move with per-capita GDP, so that changes in living standards are readily detected through changes in GDP.
Limitations and criticisms
Simon Kuznets, the economist who developed the first comprehensive set of measures of national income, stated in his first report to the US Congress in 1934, in a section titled "Uses and Abuses of National Income Measurements":[4]
The valuable capacity of the human mind to simplify a complex situation in a compact characterization becomes dangerous when not controlled in terms of definitely stated criteria. With quantitative measurements especially, the definiteness of the result suggests, often misleadingly, a precision and simplicity in the outlines of the object measured. Measurements of national income are subject to this type of illusion and resulting abuse, especially since they deal with matters that are the center of conflict of opposing social groups where the effectiveness of an argument is often contingent upon oversimplification. [...]
All these qualifications upon estimates of national income as an index of productivity are just as important when income measurements are interpreted from the point of view of economic welfare. But in the latter case additional difficulties will be suggested to anyone who wants to penetrate below the surface of total figures and market values. Economic welfare cannot be adequately measured unless the personal distribution of income is known. And no income measurement undertakes to estimate the reverse side of income, that is, the intensity and unpleasantness of effort going into the earning of income. The welfare of a nation can, therefore, scarcely be inferred from a measurement of national income as defined above.
In 1962, Kuznets stated:[32]
Distinctions must be kept in mind between quantity and quality of growth, between costs and returns, and between the short and long run. Goals for more growth should specify more growth of what and for what.
Austrian School economist Frank Shostak has argued that GDP is an empty abstraction devoid of any link to the real world, and, therefore, has little or no value in economic analysis. Says Shostak:[33]
The GDP framework cannot tell us whether final goods and services that were produced during a particular period of time are a reflection of real wealth expansion, or a reflection of capital consumption. For instance, if a government embarks on the building of a pyramid, which adds absolutely nothing to the well-being of individuals, the GDP framework will regard this as economic growth. In reality, however, the building of the pyramid will divert real funding from wealth-generating activities, thereby stifling the production of wealth.
So what are we to make out of the periodical pronouncements that the economy, as depicted by real GDP, grew by a particular percentage? All we can say is that this percentage has nothing to do with real economic growth and that it most likely mirrors the pace of monetary pumping. We can thus conclude that the GDP framework is an empty abstraction devoid of any link to the real world.
The UK's Natural Capital Committee highlighted the shortcomings of GDP in its advice to the UK Government in 2013, pointing out that GDP "focusses on flows, not stocks. As a result an economy can run down its assets yet, at the same time, record high levels of GDP growth, until a point is reached where the depleted assets act as a check on future growth". They then went on to say that "it is apparent that the recorded GDP growth rate overstates the sustainable growth rate. Broader measures of wellbeing and wealth are needed for this and there is a danger that short-term decisions based solely on what is currently measured by national accounts may prove to be costly in the long-term".
Many environmentalists argue that GDP is a poor measure of social progress because it does not take into account harm to the environment.[34][35]
In 1989 Herman Daly and John B. Cobb developed the Index of Sustainable Economic Welfare (ISEW), which they proposed as a more valid measure of socio-economic progress, by taking into account various other factors such as consumption of non-renewable resources and degradation of the environment.
India and China have the largest population in the world and hence has the greatest potential in productivity due to the fact that the value of a product is measured as the value of service that can be obtained by the holder in exchange for that product. ( Units per man hour)
Lists of countries by their GDP
- Lists of countries by GDP
- List of countries by GDP (nominal), (per capita)
- List of continents by GDP (nominal)
- List of countries by GDP (PPP), (per capita), (per hour)
- List of countries by GDP (real) growth rate, (per capita)
- List of countries by GDP sector composition
- List of countries by future GDP estimates (PPP), (per capita), (nominal)
List of other approaches to the measurement of (economic) progress
- Human development index (HDI) – up until 2009 report HDI used GDP as a part of its calculation and then factors in indicators of life expectancy and education levels. In 2010 the GDP component has been replaced with GNI.
- Genuine progress indicator (GPI) or Index of Sustainable Economic Welfare (ISEW) – The GPI and the ISEW attempt to address many of the above criticisms by taking the same raw information supplied for GDP and then adjust for income distribution, add for the value of household and volunteer work, and subtract for crime and pollution.
- European Quality of Life Survey – The survey, first published in 2005, assessed quality of life across European countries through a series of questions on overall subjective life satisfaction, satisfaction with different aspects of life, and sets of questions used to calculate deficits of time, loving, being and having.[36]
- Gross national happiness – The Centre for Bhutanese Studies in Bhutan is working on a complex set of subjective and objective indicators to measure 'national happiness' in various domains (living standards, health, education, eco-system diversity and resilience, cultural vitality and diversity, time use and balance, good governance, community vitality and psychological well-being). This set of indicators would be used to assess progress towards gross national happiness, which they have already identified as being the nation's priority, above GDP.
- Happy Planet Index – The happy planet index (HPI) is an index of human well-being and environmental impact, introduced by the New Economics Foundation (NEF) in 2006. It measures the environmental efficiency with which human well-being is achieved within a given country or group. Human well-being is defined in terms of subjective life satisfaction and life expectancy while environmental impact is defined by the Ecological Footprint.
- OECD Better Life Index - The better lives compendium of indicators produced in 2011 reflects some 10 years by the organisation to develop a wider of set of indicators more closely attuned to the measurement of wellbeing or welfare outcomes. There is felt to be considerable convergence (in 2011) in high income countries about the kinds of dimensions that should be included in such multi-dimensional approaches to welfare measurement - see for instance the capabilities measurement research project capabilities approach.
- Composite Wealth Indicators – Namely yearly material wealth (an amended version of GNI to include depletion of natural resources and the costs of pollution), biological wealth (measured through life expectancy) and thus expected material wealth (or physical wealth), a linear combination of biological and yearly material wealth (the amount of material wealth expected to be produced by an individual during his/her lifetime).[37]
- Future Orientation Index - Tobias Preis et al. used Google Trends data to demonstrate that Internet users from countries with a higher per capita gross domestic product (GDP) are more likely to search for information about the future than information about the past. The findings, published in the journal Scientific Reports, suggest there may be a link between online behaviour and real-world economic indicators.[38][39][40] The authors of the study examined Google search queries made by Internet users in 45 different countries in 2010 and calculated the ratio of the volume of searches for the coming year ('2011') to the volume of searches for the previous year ('2009'), which they call the 'future orientation index'.[41] They compared the future orientation index to the per capita GDP of each country and found a strong tendency for countries in which Google users enquire more about the future to exhibit a higher GDP. The results hint that there may potentially be a relationship between the economic success of a country and the information-seeking behaviour of its citizens online.
- World Governance Index - Basing their work on the United Nations Millennium Declaration, which was the subject of unprecedented U.N. consensus among the heads of state and government who adopted it in 2000, a team of researchers of the Forum for a new World Governance (FnWG) focused its research on the five main concepts defining the application framework of world governance and constituting key goals to be reached by 2015: Peace and Security; Democracy and Rule of Law; Human Rights and Participation; Sustainable Development and Human Development
- Social Progress Index - measures the extent to which countries provide for the social and environmental needs of their citizens. Fifty-two indicators in the areas of basic human needs, foundations of wellbeing, and opportunity show the relative performance of nations. The index uses outcome measures when there is sufficient data available or the closest possible proxies.
See also
Notes and references
- ↑ "GDP (Official Exchange Rate)". CIA World Factbook. Retrieved June 2, 2012.
- ↑ 2.0 2.1 2.2 "OECD". Retrieved 14 August 2014.
- ↑ Dawson, Graham (2006). Economics and Economic Chenge. FT / Prentice Hall. p. 205. ISBN 9780273693512.
- ↑ 4.0 4.1 Congress commissioned Kuznets to create a system that would measure the nation's productivity in order to better understand how to tackle the Great Depression.Simon Kuznets, 1934. "National Income, 1929–1932". 73rd US Congress, 2d session, Senate document no. 124, page 5-7 Simon Kuznets, 1934. "National Income, 1929–1932". 73rd US Congress, 2d session, Senate document no. 124, page 5-7 Simon Kuznets, 1934. "National Income, 1929–1932". 73rd US Congress, 2d session, Senate document no. 124, page 5-7. https://fraser.stlouisfed.org/scribd/?title_id=971&filepath=/docs/publications/natincome_1934/19340104_nationalinc.pdf
- ↑ Dickinson, Elizabeth. "GDP: a brief history". ForeignPolicy.com. Retrieved 25 April 2012.
- ↑ Coyle, Diane (2014). GDP: A Brief but Affectionate History. Princeton University Press. p. 6. ISBN 9780691156798.
- ↑ World Bank, Statistical Manual >> National Accounts >> GDP–final output, retrieved October 2009.
"User's guide: Background information on GDP and GDP deflator". HM Treasury.
"Measuring the Economy: A Primer on GDP and the National Income and Product Accounts" (PDF). Bureau of Economic Analysis. - ↑ Based on the IMF figures. If no number was available for a country from IMF, CIA figures were used.
- ↑ United States Bureau of Economic Analysis, A guide to the National Income and Product Accounts of the United States PDF, page 5; retrieved November 2009. Another term, "business current transfer payments", may be added. Also, the document indicates that the capital consumption adjustment (CCAdj) and the inventory valuation adjustment (IVA) are applied to the proprietor's income and corporate profits terms; and CCAdj is applied to rental income.
- ↑ Thayer Watkins, San José State University Department of Economics, "Gross Domestic Product from the Transactions Table for an Economy", commentary to first table, " Transactions Table for an Economy". (Page retrieved November 2009.)
- ↑ Concepts and Methods of the United States National Income and Product Accounts, chap. 2.
- ↑ BEA, Concepts and Methods of the United States National Income and Product Accounts, p 12.
- ↑ Australian National Accounts: Concepts, Sources and Methods, 2000, sections 3.5 and 4.15.
- ↑ This and the following statement on entitlement to compensation are from Australian National Accounts: Concepts, Sources and Methods, 2000, section 4.6.
- ↑ Concepts and Methods of the United States National Income and Product Accounts, page 2-2.
- ↑ Concepts and Methods of the United States National Income and Product Accounts, page 2-2.
- ↑ Australian National Accounts: Concepts, Sources and Methods, 2000, section 4.4.
- ↑ Concepts and Methods of the United States National Income and Product Accounts, page 2-2; and Australian National Accounts: Concepts, Sources and Methods, 2000, section 4.4.
- ↑ 19.0 19.1 Concepts and Methods of the United States National Income and Product Accounts, page 2-4.
- ↑ Concepts and Methods of the United States National Income and Product Accounts, page 2-5.
- ↑ Lequiller, François; Derek Blades (2006). Understanding National Accounts. OECD. p. 18. ISBN 978-92-64-02566-0.
To convert GDP into GNI, it is necessary to add the income received by resident units from abroad and deduct the income created by production in the country but transferred to units residing abroad.
- ↑ United States, Bureau of Economic Analysis, Glossary, "GDP". Retrieved November 2009.
- ↑ "U.S. Department of Commerce. Bureau of Economic Analysis". Bea.gov. 2009-10-21. Retrieved 2010-07-31.
- ↑ "National Accounts". Central Bureau of Statistics. Retrieved 2011-06-29.
- ↑ HM Treasury, Background information on GDP and GDP deflator
Some of the complications involved in comparing national accounts from different years are explained in this World Bank document. - ↑ | http://helgilibrary.com/indicators/index/gdp-per-capita-current-usd GDP Per Capita (Current USD) | 2014-02-10
- ↑ 27.0 27.1 27.2 "How Do We Measure Standard of Living?" (PDF). The Federal Reserve Bank of Boston.
- ↑ 28.0 28.1 Mankiw, N.G.; Taylor, M.P. (2011). Economics (2nd ed., revised ed.). Andover: Cengage Learning.
- ↑ "Eric Zencey-G.D.P. R.I.P.". Nytimes.com. August 2009. Retrieved 2011-01-31.
- ↑ 30.0 30.1 30.2 30.3 30.4 "Macroeconomics - GDP and Welfare". Retrieved 2015-02-21.
- ↑ "How Real GDP per Capita Affects the Standard of Living". Study.com.
- ↑ Simon Kuznets. "How To Judge Quality". The New Republic, October 20, 1962
- ↑ Frank Shostak. "What is up with the GDP?".
- ↑ The Virtues of Ignoring GDP http://www.thebrokeronline.eu/Articles/The-virtues-of-ignoring-GDP
- ↑ The Rise and Fall of G.D.P. http://www.nytimes.com/2010/05/16/magazine/16GDP-t.html?pagewanted=all
- ↑ "First European Quality of Life Survey".
- ↑ See Emanuele Felice, Neither dashboard nor 'mashup' indices: an empirical wealth approach as a pathway to a comprehensive measure of development, http://www.h-economica.uab.es/wps/2012_01.pdf
- ↑ Tobias Preis, Helen Susannah Moat, H. Eugene Stanley and Steven R. Bishop (2012). "Quantifying the Advantage of Looking Forward". Scientific Reports 2: 350. doi:10.1038/srep00350. PMC 3320057. PMID 22482034.
- ↑ Paul Marks (April 5, 2012). "Online searches for future linked to economic success". New Scientist. Retrieved April 9, 2012.
- ↑ Casey Johnston (April 6, 2012). "Google Trends reveals clues about the mentality of richer nations". Ars Technica. Retrieved April 9, 2012.
- ↑ Tobias Preis (2012-05-24). "Supplementary Information: The Future Orientation Index is available for download" (PDF). Retrieved 2012-05-24.
Further reading
- Coyle, Diane (2014). GDP: A Brief but Affectionate History. Princeton, NJ: Princeton University Press. ISBN 978-0-691-15679-8.
- Australian Bureau for Statistics, Australian National Accounts: Concepts, Sources and Methods, 2000. Retrieved November 2009. In depth explanations of how GDP and other national accounts items are determined.
- United States Department of Commerce, Bureau of Economic Analysis, Concepts and Methods of the United States National Income and Product Accounts PDF. Retrieved November 2009. In depth explanations of how GDP and other national accounts items are determined.
External links
| Wikimedia Commons has media related to Gross domestic product. |
| Wikiquote has quotations related to: Gross Domestic Product |
Global
- World GDP Chart (since 1960)
- OECD GDP chart
- Australian Bureau of Statistics Manual on GDP measurement
- GDP-indexed bonds
- World Development Indicators (WDI)
- UN Statistical Databases
Data
- Bureau of Economic Analysis: Official United States GDP data
- Historicalstatistics.org: Links to historical statistics on GDP for different countries and regions, maintained by the Department of Economic History at Stockholm University.
- Quandl - GDP by county - downloadable in CSV, Excel, JSON or XML
- Historical US GDP (yearly data), 1790–present, maintained by Samuel H. Williamson and Lawrence H. Officer, both professors of economics at the University of Illinois at Chicago.
- Historical US GDP (quarterly data), 1947–present
- Google – public data: GDP and Personal Income of the U.S. (annual): Nominal Gross Domestic Product
- The Maddison Project of the Groningen Growth and Development Centre at the University of Groningen, the Netherlands. This project continues and extends the work of Angus Maddison in collating all the available, credible data estimating GDP for different countries around the world. This includes data for some countries for over 2,000 years back to 1 CE and for essentially all countries since 1950.
Articles and books
| Library resources about Gross domestic product |
- Gross Domestic Product: An Economy’s All, International Monetary Fund.
- Stiglitz JE, Sen A, Fitoussi J-P. Mismeasuring our Lives: Why GDP Doesn't Add Up, New Press, New York, 2010
- What's wrong with the GDP?
- Limitations of GDP Statistics by Robert Schenk.
- Whether output and CPI inflation are mismeasured, by Nouriel Roubini and David Backus, in Lectures in Macroeconomics
- Rodney Edvinsson, Growth, Accumulation, Crisis: With New Macroeconomic Data for Sweden 1800–2000 PDF
- Clifford Cobb, Ted Halstead and Jonathan Rowe. "If the GDP is up, why is America down?" The Atlantic Monthly, vol. 276, no. 4, October 1995, pages 59–78
- Jerorn C.J.M. van den Bergh, "Abolishing GDP"
- GDP and GNI in OECD Observer No246-247, Dec 2004-Jan 2005
- Progress, what progress? in OECD Observer No272 March 2009
| ||||||||||||||||||||||||||||||
| ||||||||||||||||||||||||||||||||||||||||||||||||