Greenwich (UK Parliament constituency)
| Greenwich | |
|---|---|
|
Former Borough constituency for the House of Commons | |
| County | Greater London |
| 1832–1885 | |
| Number of members | Two |
| Replaced by | Deptford, Greenwich, Lewisham and Woolwich |
| Created from | Kent |
| 1885–1997 | |
| Number of members | One |
| Replaced by | Greenwich & Woolwich |
| Created from | Greenwich |
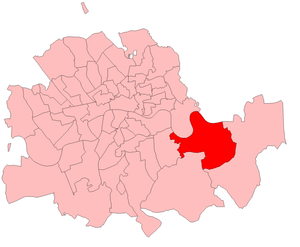
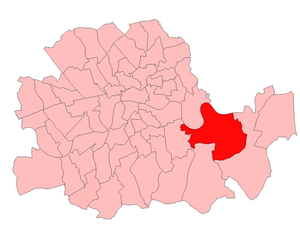
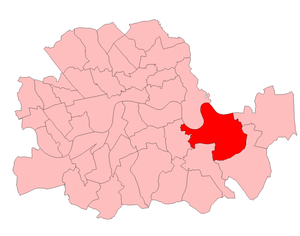
Greenwich was a parliamentary constituency in South-East London, which returned Members of Parliament to the House of Commons of the Parliament of the United Kingdom from 1832 to 1997 by the first past the post system.
History
From 1832 until 1885 it was a two-member constituency, but its representation was reduced to one Member of Parliament under the Redistribution of Seats Act 1885. For the 1997 general election, it was merged with part of the former Woolwich constituency to form the Greenwich and Woolwich seat.
Its history is dominated by the area's strong maritime tradition. Its most prominent claim to fame was as the seat of William Ewart Gladstone between 1868 and 1880, and it also achieved prominence in the 1987 Greenwich by-election, when the SDP won a surprise victory.
Boundaries
1918-1974: The Metropolitan Borough of Greenwich.
1974-1983: The London Borough of Greenwich wards of Blackheath, Charlton, Eastcombe, Hornfair, Kidbrooke, Marsh, Park, Trafalgar, Vanbrugh, and West.
1983-1997: The London Borough of Greenwich wards of Blackheath, Charlton, Ferrier, Hornfair, Kidbrooke, Rectory Field, St Alfege, Trafalgar, Vanbrugh, and West.
Between 1983 and 1997, the constituency formed the western part of the Royal Borough of Greenwich.
Members of Parliament
MPs 1832–1885
| Election | 1st Member | 1st Party | 2nd Member | 2nd Party | ||
|---|---|---|---|---|---|---|
| 1832 | constituency created with two members | |||||
| 1832 | James Whitley Deans Dundas | Liberal | Edward George Barnard | Liberal | ||
| 1835 | John Angerstein | Liberal | ||||
| 1837 | Matthias Wolverley Attwood | Conservative | ||||
| 1841 | James Whitley Deans Dundas | Liberal | ||||
| 1851 by-election | David Salomons | Liberal | ||||
| 1852 by-election | Houston Stewart | Liberal | ||||
| 1852 | Peter Rolt | Conservative | Montague Chambers | Liberal | ||
| Feb 1857 by-election | Sir William John Codrington | Liberal | ||||
| Mar. 1857 | John Townsend | Liberal | ||||
| Feb. 1859 by-election | David Salomons | Liberal | ||||
| 1859 | William Angerstein | Liberal | ||||
| 1865 | Sir Charles Tilston Bright | Liberal | ||||
| 1868 | William Ewart Gladstone | Liberal | ||||
| 1873 by-election | Sir Thomas William Boord | Conservative | ||||
| 1880 | Baron Henry de Worms | Conservative | ||||
| 1885 | Representation reduced to one member | |||||
MPs since 1885
| Election | Member | Party | |
|---|---|---|---|
| 1885 | Sir Thomas William Boord | Conservative | |
| 1895 | Lord Hugh Cecil | Conservative | |
| 1906 | Richard Stephens Jackson | Liberal | |
| Jan 1910 | Ion Hamilton Benn | Conservative | |
| 1922 | George Hopwood Hume | Conservative | |
| 1923 | Edward Timothy Palmer | Labour | |
| 1924 | Sir George Hopwood Hume | Conservative | |
| 1929 | Edward Timothy Palmer | Labour | |
| 1931 | Sir George Hopwood Hume | Conservative | |
| 1945 | Joseph Reeves | Labour | |
| 1959 | Richard Marsh | Labour | |
| 1971 by-election | Guy Barnett | Labour | |
| 1987 by-election | Rosie Barnes | Social Democratic | |
| 1992 | Nick Raynsford | Labour | |
| 1997 | constituency abolished | ||
Elections
Elections in the 1990s
The swing for Rosie Barnes below is shown relative to her own performance in 1987. This is reasonable as the Liberal Democrats did not put up their own candidate in 1992.
| General Election 1992: Greenwich[1] | |||||
|---|---|---|---|---|---|
| Party | Candidate | Votes | % | ±% | |
| Labour | Nick Raynsford | 14,630 | 41.0 | +6.2 | |
| Independent Social Democrat | Rosie Barnes | 13,273 | 37.2 | −3.4 | |
| Conservative | Alison McNair | 6,960 | 19.5 | −3.8 | |
| Green | Robert McCracken | 483 | 1.4 | +0.4 | |
| Fellowship | Ronald Mallone | 147 | 0.4 | +0.3 | |
| Independent | Malcolm Hardee | 103 | 0.3 | +0.3 | |
| Natural Law | John Small | 70 | 0.2 | +0.2 | |
| Majority | 1,357 | 3.8 | −1.9 | ||
| Turnout | 35,666 | 74.6 | +1.2 | ||
| Labour gain from Social Democratic | Swing | +4.8 | |||
Elections in the 1980s
The 1987 election swings are relative to the 1983 election, not the 1987 by-election.
| General Election 1987: Greenwich | |||||
|---|---|---|---|---|---|
| Party | Candidate | Votes | % | ±% | |
| Social Democratic | Rosie Barnes | 15,149 | 40.6 | +15.5 | |
| Labour | Deirdre Frances Mary Wood | 13,008 | 34.9 | −3.3 | |
| Conservative | John Gordon Antcliffe | 8,695 | 23.3 | −11.5 | |
| Green | J. Thomas | 346 | 0.9 | +0.9 | |
| Fellowship | Ronald Mallone | 59 | 0.2 | −0.5 | |
| Communist | Patricia Clinton | 58 | 0.2 | −0.2 | |
| Majority | 2,141 | 5.7 | +2.3 | ||
| Turnout | 37315 | 73.4 | +5.7 | ||
| Social Democratic gain from Labour | Swing | +9.4 | |||
| Greenwich by-election, 1987 | |||||
|---|---|---|---|---|---|
| Party | Candidate | Votes | % | ±% | |
| Social Democratic | Rosie Barnes | 18,287 | 53.0 | +27.9 | |
| Labour | Deirdre Frances Mary Wood | 11,676 | 33.8 | −4.4 | |
| Conservative | John Gordon Antcliffe | 3,852 | 11.2 | −23.6 | |
| Green | Graham Bell | 264 | 0.8 | N/A | |
| Rainbow Dream Ticket | Malcolm Hardee | 124 | 0.3 | N/A | |
| BNP | Ian Dell | 116 | 0.3 | −0.4 | |
| National Front | Joe Pearce | 103 | 0.3 | N/A | |
| Revolutionary Communist | Kate Marshall | 91 | 0.3 | N/A | |
| Majority | 6,611 | 19.2 | +15.7 | ||
| Turnout | 68.2 | ||||
| Social Democratic gain from Labour | Swing | +16.2 | |||
| General Election 1983: Greenwich | |||||
|---|---|---|---|---|---|
| Party | Candidate | Votes | % | ±% | |
| Labour | Guy Barnett | 13,361 | 38.2 | −13.9 | |
| Conservative | Arthur Rolfe | 12,150 | 34.8 | +1.5 | |
| Social Democratic | T. Ford | 8,783 | 25.1 | N/A | |
| BNP | Ian Dell | 259 | 0.7 | N/A | |
| Fellowship | Ronald Mallone | 242 | 0.7 | −0.6 | |
| Communist | F. Hooks | 149 | 0.4 | N/A | |
| Majority | 1,211 | 3.5 | −15.3 | ||
| Turnout | 67.7 | −2.9 | |||
| Labour hold | Swing | ||||
Elections in the 1970s
| General Election 3 May 1979: constituency of | |||||
|---|---|---|---|---|---|
| Party | Candidate | Votes | % | ±% | |
| Labour | |||||
| Conservative | |||||
| Liberal | |||||
| Majority | |||||
| Turnout | |||||
| General Election 10 October 1974: constituency of | |||||
|---|---|---|---|---|---|
| Party | Candidate | Votes | % | ±% | |
| Labour | |||||
| Conservative | |||||
| Liberal | |||||
| Majority | |||||
| Turnout | |||||
| General Election 28 February 1974: constituency of | |||||
|---|---|---|---|---|---|
| Party | Candidate | Votes | % | ±% | |
| Labour | |||||
| Conservative | |||||
| Liberal | |||||
| Majority | |||||
| Turnout | |||||
| Greenwich by-election, 1971 | |||||
|---|---|---|---|---|---|
| Party | Candidate | Votes | % | ±% | |
| Labour | Guy Barnett | 14,671 | 66.73 | +10.98 | |
| Conservative | J Stuart Thom | 6,150 | 27.97 | -7.39 | |
| Fellowship | Ronald Mallone | 792 | 3.60 | N/A | |
| Independent Conservative | Reginald Simmerson | 285 | 1.30 | N/A | |
| Independent | David Davies | 89 | 0.40 | N/A | |
| Turnout | 21,987 | ||||
| Labour hold | Swing | ||||
| General Election 1970: Greenwich | |||||
|---|---|---|---|---|---|
| Party | Candidate | Votes | % | ±% | |
| Labour | Richard Marsh | 20,804 | 55.75 | ||
| Conservative | J Stuart Thom | 13,195 | 35.36 | ||
| Liberal | P. Wylan | 3,319 | 8.89 | ||
| Majority | 7,609 | 20.39 | |||
| Turnout | 37,318 | 65.66 | |||
| Labour hold | Swing | ||||
Elections in the 1960s
| General Election 31 March 1966: constituency of | |||||
|---|---|---|---|---|---|
| Party | Candidate | Votes | % | ±% | |
| Labour | Richard William Marsh | ||||
| Conservative | John Selwyn Gummer | ||||
| Majority | |||||
| Turnout | |||||
| General Election 15 October 1964: constituency of | |||||
|---|---|---|---|---|---|
| Party | Candidate | Votes | % | ±% | |
| Labour | Richard William Marsh | ||||
| Conservative | John Selwyn Gummer | ||||
| Liberal | |||||
| Majority | |||||
| Turnout | |||||
Elections in the 1950s
| General Election 8 October 1959: constituency of | |||||
|---|---|---|---|---|---|
| Party | Candidate | Votes | % | ±% | |
| Conservative | |||||
| Labour | |||||
| Liberal | |||||
| Majority | |||||
| Turnout | |||||
| General Election 26 May 1955: constituency of | |||||
|---|---|---|---|---|---|
| Party | Candidate | Votes | % | ±% | |
| Labour | Joseph Reeves | 26,423 | |||
| Conservative | WF Rhodes | 18,484 | |||
| Majority | |||||
| Turnout | |||||
| General Election 25 October 1951: constituency of | |||||
|---|---|---|---|---|---|
| Party | Candidate | Votes | % | ±% | |
| Labour | |||||
| Conservative | |||||
| Majority | |||||
| Turnout | |||||
| General Election 23 February 1950: Borough Constituency of Greenwich | |||||
|---|---|---|---|---|---|
| Party | Candidate | Votes | % | ±% | |
| Labour | Joseph Reeves | 29,379 | 57.9 | ||
| Conservative | Alfred Ronald Dashwood Gilbey | 18,255 | 36.0 | ||
| Liberal | Leslie Maurice Dale | 3,148 | 6.2 | ||
| Majority | 11,124 | 21.9 | |||
| Turnout | |||||
Elections in the 1940s
| General Election 5 to 19 July 1945: constituency of | |||||
|---|---|---|---|---|---|
| Party | Candidate | Votes | % | ±% | |
| Labour | |||||
| Conservative | |||||
| Liberal | |||||
| Majority | |||||
| Turnout | |||||
Elections in the 1930s
| General Election 14 November 1935: constituency of Greenwich | |||||
|---|---|---|---|---|---|
| Party | Candidate | Votes | % | ±% | |
| Conservative | Sir George Hopwood Hume | 22,526 | |||
| Labour | Edward Timothy Palmer | 20,436 | |||
| Majority | |||||
| Turnout | |||||
| General Election 27 October 1931:[2] Parliamentary Borough of Greenwich | ||||||
|---|---|---|---|---|---|---|
| Party | Candidate | Votes | % | ±% | ||
| Conservative | Sir George Hopwood Hume | 29,278 | 65.0 | +26.9 | ||
| Labour | Edward Timothy Palmer | 13,722 | 30.5 | -15.8 | ||
| Communist | Mrs K Duncan | 2,024 | 4.5 | N/A | ||
| Majority | 15,556 | 34.6 | ||||
| Turnout | 45,024 | 71.0 | ||||
| Conservative gain from Labour | ||||||
Elections in the 1920s
| General Election 30 May 1929:[3] Parliamentary Borough of Greenwich | ||||||
|---|---|---|---|---|---|---|
| Party | Candidate | Votes | % | ±% | ||
| Labour | Edward Timothy Palmer | 20,328 | 46.3 | -2.2 | ||
| Conservative | Sir George Hopwood Hume | 16,710 | 38.1 | -13.4 | ||
| Liberal | W P Campbell | 6,870 | 15.6 | N/A | ||
| Majority | 3,618 | 8.2 | ||||
| Turnout | 43,908 | 70.4 | ||||
| Labour gain from Conservative | ||||||
| General Election 29 October 1924:[4] Parliamentary Borough of Greenwich | ||||||
|---|---|---|---|---|---|---|
| Party | Candidate | Votes | % | ±% | ||
| Conservative | Sir George Hopwood Hume | 18,473 | 51.5 | |||
| Labour | Edward Timothy Palmer | 17,409 | 48.5 | |||
| Majority | 1,064 | 3.0 | ||||
| Turnout | 35,882 | 75.2 | ||||
| Conservative gain from Labour | ||||||
| General Election 6 December 1923: constituency of | |||||
|---|---|---|---|---|---|
| Party | Candidate | Votes | % | ±% | |
| Labour | Edward Timothy Palmer | 12,314 | |||
| Conservative | George Hopwood Hume | 10,746 | |||
| Liberal | Charles Garfield Lott Du Cann | 5,806 | |||
| Majority | |||||
| Turnout | |||||

| General Election 15 November 1922:[5] constituency of Greenwich | |||||
|---|---|---|---|---|---|
| Party | Candidate | Votes | % | ±% | |
| Conservative | George Hopwood Hume | 16,933 | 61 | -8.3 | |
| Labour | Edward Timothy Palmer | 10,861 | 39.0 | +8.3 | |
| Majority | 6,072 | 21.8 | -16.7 | ||
| Turnout | 27,794 | 60.4 | |||
Elections in the 1910s
| General Election 14 December 1918: Parliamentary Borough of Greenwich | |||||
|---|---|---|---|---|---|
| Party | Candidate | Votes | % | ±% | |
| Conservative | Ion Hamilton Benn | 14,576 | |||
| Labour | James Bermingham | 6,471 | |||
| Majority | 8,105 | ||||
| Turnout | |||||
| Conservative hold | Swing | ||||
| December 1910 General Election: Greenwich | |||||
|---|---|---|---|---|---|
| Party | Candidate | Votes | % | ±% | |
| Conservative | Ion Hamilton Benn | 5697 | 57.9 | 2.6 | |
| Liberal | Hon. John William Harris | 4146 | 42.1 | -2.6 | |
| Majority | 1,551 | ||||
| Turnout | 13,153 | 74.8 | |||
| Conservative hold | Swing | ||||
| January 1910 General Election: Greenwich | |||||
|---|---|---|---|---|---|
| Party | Candidate | Votes | % | ±% | |
| Conservative | Ion Hamilton Benn | 6,284 | 55.3 | 33.5 | |
| Liberal | Richard Stephens Jackson | 5,083 | 44.7 | -0.6 | |
| Majority | 1,201 | ||||
| Turnout | 13,153 | 86.4 | |||
| Conservative gain from Liberal | Swing | ||||
Elections in the 1900s

| 1906 General Election: Greenwich | |||||
|---|---|---|---|---|---|
| Party | Candidate | Votes | % | ±% | |
| Liberal | Richard Stephens Jackson | 4,906 | 45.3 | 6.3 | |
| Independent Conservative | Ion Hamilton Benn | 3,565 | 32.9 | ||
| Conservative | Lord Hugh Cecil | 2,356 | 21.8 | -39.2 | |
| Majority | 1,341 | ||||
| Turnout | 13,049 | 83.0 | |||
| Liberal gain from Conservative | Swing | ||||
| 1900 General Election: Greenwich | |||||
|---|---|---|---|---|---|
| Party | Candidate | Votes | % | ±% | |
| Conservative | Lord Hugh Cecil | 5,454 | 61.0 | 3.6 | |
| Liberal | Richard Stephens Jackson | 3,484 | 39.0 | -3.6 | |
| Majority | 1,970 | ||||
| Turnout | 12,247 | 73.0 | |||
| Conservative hold | Swing | ||||
Elections in the 1890s
| 1895 General Election: Greenwich | |||||
|---|---|---|---|---|---|
| Party | Candidate | Votes | % | ±% | |
| Conservative | Lord Hugh Cecil | 4,802 | 57.4 | 5.4 | |
| Liberal | George Crispe Whiteley | 3,564 | 42.6 | -5.4 | |
| Majority | 1,238 | ||||
| Turnout | 10,899 | 76.8 | |||
| Conservative hold | Swing | ||||
| 1892 General Election: Greenwich | |||||
|---|---|---|---|---|---|
| Party | Candidate | Votes | % | ±% | |
| Conservative | Thomas William Boord | 4,200 | 52.0 | -3.9 | |
| Liberal | George Crispe Whiteley | 3,877 | 48.0 | 3.9 | |
| Majority | 323 | ||||
| Turnout | 10,256 | 78.8 | |||
| Conservative hold | Swing | ||||
Elections in the 1880s
| 1886 General Election: Greenwich | |||||
|---|---|---|---|---|---|
| Party | Candidate | Votes | % | ±% | |
| Conservative | Thomas William Boord | 3240 | 55.9 | 3.1 | |
| Liberal | George Crispe Whiteley | 2551 | 44.1 | -3.1 | |
| Majority | 689 | ||||
| Turnout | 8,632 | 67.1 | |||
| Conservative hold | Swing | ||||
| 1885 General Election: Greenwich | |||||
|---|---|---|---|---|---|
| Party | Candidate | Votes | % | ±% | |
| Conservative | Thomas William Boord | 3,317 | 52.8 | ||
| Liberal | Dr. Herbert Watney | 2,961 | 47.2 | ||
| Majority | 356 | ||||
| Turnout | 8,632 | 72.7 | |||
| Conservative gain from new seat | Swing | ||||
References
- ↑ "Politics Resources". Election 1992. Politics Resources. 9 April 1992. Retrieved 6 December 2010.
- ↑ "General Election Results 1931". The Times. 29 October 1931. p. i.
- ↑ "General Election 1929, Results in Detail". The Times. 1 June 1929. p. i.
- ↑ "General Election 1924, Results in Detail". The Times. 31 October 1924. p. i.
- ↑ "The General Election. First Returns., Polls In The Boroughs., Heavy Voting". The Times. 16 November 1922. p. 7.
- Leigh Rayment's Historical List of MPs – Constituencies beginning with "G" (part 2)
- British Parliamentary Election Results 1885-1918, compiled and edited by F.W.S. Craig (Macmillan Press 1974)
- Debrett’s Illustrated Heraldic and Biographical House of Commons and the Judicial Bench 1886
- Debrett’s House of Commons and the Judicial Bench 1901
- Debrett’s House of Commons and the Judicial Bench 1918
| Parliament of the United Kingdom | ||
|---|---|---|
| Preceded by Buckinghamshire |
Constituency represented by the Prime Minister 1868–1874 |
Succeeded by Buckinghamshire |