Greater Boston
| Boston Combined Statistical Area Boston–Worcester–Providence | |
|---|---|
| Metropolitan region | |
|
| |
 | |
| Country |
|
| State(s) | |
| Principal cities | |
| Population (2014) | |
| • Total | 4,732,161 (MSA) or 8,099,575 (CSA) |
| • Rank | Ranked 6th in the US for Combined Statistical Areas |
| Time zone | EST |
| Area code(s) | 617, 781, 857 339, 978, 508, 603, 401, |

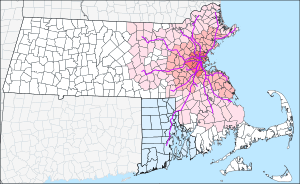
Greater Boston is the area of the Commonwealth of Massachusetts surrounding the city of Boston, consisting most of the eastern third of Massachusetts, excluding the South Coast, Cape Cod & The Islands. The area can be characterized as the metropolitan statistical area (MSA) or the combined statistical area (CSA), the latter which includes the metro areas of Manchester, New Hampshire; Providence, Rhode Island and Worcester, Massachusetts.
By contrast, Metro Boston is usually reserved to signify the "inner core" surrounding the City of Boston, while "Greater Boston" usually at least overlaps the North and South Shores, as well as MetroWest and the Merrimack Valley.
Greater Boston is tenth in population among U.S. metropolitan statistical areas in the United States, home to 4,732,161 people as of the 2014 estimate by the U.S. Census Bureau and is ranked sixth among CSAs, having 8,099,575.[1]
Greater Boston has many sites and people significant to American history and culture, particularly the American Revolution, civil rights, literature, and politics, and is one of the nation's centers of education, finance, industry, and tourism, with the ninth largest GDP in the country and fifteenth-largest in the world.
Definitions

Metropolitan Area Planning Council
The most restrictive definition of the Greater Boston area is the region administered by the Metropolitan Area Planning Council (MAPC).[2] The MAPC is a regional planning organization created by the Massachusetts legislature to oversee transportation infrastructure and economic development concerns in the Boston area. The MAPC includes 101 cities and towns that are grouped into eight subregions. These include most of the area within the region's outer circumferential highway, I-495. The population of the MAPC district is 3,066,394 (as of 2000), in an area of 1,422 square miles (3,680 km2),[2] of which 39% is forested and an additional 11% is water, wetland, or other open space.[3]
The eight subregions and their principal towns are: Inner Core (Boston), Minuteman (Route 2 corridor), MetroWest (Framingham), North Shore (Lynn), North Suburban (Woburn), South Shore (Route 3 corridor), SouthWest (Franklin), and Three Rivers (Norwood).
Notably excluded from the MAPC and its partner planning body, the Boston Region Metropolitan Planning Organization, are the Merrimack Valley cities of Lowell, Lawrence, and Haverhill, much of Plymouth County, and all of Bristol County; these areas have their own regional planning bodies. Northern Bristol County is part of Greater Boston, even though it is part of the Providence MSA.
New England City and Town Area
The urbanized area surrounding Boston serves as the core of a definition used by the U.S. Census Bureau known as the New England city and town area (NECTA). The set of towns containing the core urbanized area plus surrounding towns with strong social and economic ties to the core area is defined as the Boston-Cambridge-Nashua, MA-NH Metropolitan NECTA.[4] The Boston NECTA is further subdivided into several NECTA divisions, which are listed below. The Boston, Framingham, and Peabody NECTA divisions together correspond roughly to the MAPC area. The total population of the Boston NECTA was 4,540,941 (as of 2000).
- Boston-Cambridge-Newton, MA NECTA Division (92 towns)
- Framingham, MA NECTA Division (12 towns)
- Peabody-Salem-Beverly, MA NECTA Division (4 towns)
- Brockton-Bridgewater-Easton, MA NECTA Division (Old Colony region) (8 towns)
- Haverhill-Newburyport-Amesbury, MA-NH NECTA Division (Merrimack Valley region) (21 towns)
- Lawrence-Methuen-Salem, MA-NH NECTA Division (part of Merrimack Valley region) (4 towns)
- Lowell-Billerica-Chelmsford, MA-NH NECTA Division (Northern Middlesex region) (15 towns)
- Nashua, NH-MA NECTA Division (21 towns)
- Taunton-Middleborough-Norton, MA NECTA Division (part of Southeastern region) (9 towns)
- Lynn-Saugus-Marblehead, MA NECTA Division (5 towns)
Metropolitan Statistical Area
| Historical population | |||
|---|---|---|---|
| Census | Pop. | %± | |
| 1850 | 650,357 | — | |
| 1860 | 830,998 | 27.8% | |
| 1870 | 978,346 | 17.7% | |
| 1880 | 1,205,439 | 23.2% | |
| 1890 | 1,515,684 | 25.7% | |
| 1900 | 1,890,122 | 24.7% | |
| 1910 | 2,260,762 | 19.6% | |
| 1920 | 2,563,123 | 13.4% | |
| 1930 | 2,866,567 | 11.8% | |
| 1940 | 2,926,650 | 2.1% | |
| 1950 | 3,186,970 | 8.9% | |
| 1960 | 3,516,435 | 10.3% | |
| 1970 | 3,918,092 | 11.4% | |
| 1980 | 3,938,585 | 0.5% | |
| 1990 | 4,133,895 | 5.0% | |
| 2000 | 4,391,344 | 6.2% | |
| 2010 | 4,552,402 | 3.7% | |
| Est. 2014 | 4,732,161 | 3.9% | |
| U.S. Decennial Census | |||
An alternative definition defined by the United States Office of Management and Budget, using counties as building blocks instead of towns, is the Boston-Cambridge-Newton, MA-NH Metropolitan Statistical Area, which is further subdivided into four metropolitan divisions. The metropolitan statistical area has a total population of approximately 4,640,802 and is the tenth-largest in the United States. The components of the metropolitan area with their estimated 2012 populations are listed below.
- Boston-Cambridge-Newton, MA-NH Metropolitan Statistical Area (4,640,802)
- Boston, MA Metropolitan Division (1,926,030)
- Norfolk County, Massachusetts (681,845)
- Plymouth County, Massachusetts (499,759)
- Suffolk County, Massachusetts (744,426)
- Cambridge-Newton-Framingham, MA Metropolitan Division (2,292,833)
- Middlesex County, Massachusetts (1,537,215)
- Essex County, Massachusetts (755,618)
- Rockingham County-Strafford County, NH Metropolitan Division (421,939)
- Rockingham County, New Hampshire (297,820)
- Strafford County, New Hampshire (124,119)
- Boston, MA Metropolitan Division (1,926,030)
Combined Statistical Area
A wider functional metropolitan area based on commuting patterns is also defined by the Office of Management and Budget as the Boston-Worcester-Providence, MA-RI-NH-CT Combined Statistical Area. This area consists of the metropolitan areas of Manchester, Worcester, Providence, as well as Cape Cod, in addition to Greater Boston. The total population (as of 2013) for the extended region is 8,041,303. The following areas, along with the above MSA, are included in the Combined Statistical Area:
- Worcester, MA-CT Metropolitan Statistical Area (923,762)
- Worcester County, Massachusetts (806,163)
- Windham County, Connecticut (117,599)
- Providence-Warwick, RI-MA Metropolitan Statistical Area (1,601,374)
- Bristol County, Massachusetts (551,082)
- Bristol County, Rhode Island (49,144)
- Kent County, Rhode Island (164,843)
- Newport County, Rhode Island (82,036)
- Providence County, Rhode Island (628,323)
- Washington County, Rhode Island (125,946)
- Concord, NH Micropolitan Statistical Area (146,761)
- Merrimack County, New Hampshire (146,761)
- Laconia, NH Micropolitan Statistical Area (60,327)
- Belknap County, New Hampshire (60,327)
- Manchester-Nashua, NH Metropolitan Statistical Area (402,922)
- Hillsborough County, New Hampshire (402,922)
- Barnstable Town, MA Metropolitan Statistical Area (215,423)
- Barnstable County, Massachusetts (215,423)
Principal cities and towns
Boston metropolitan area
The Census Bureau defines the following as principal cities in the Boston NECTA[4] using criteria developed for what the Office of Management and Budget calls a Core Based Statistical Area:[5]
Largest cities and towns
Cities and towns in the Boston CSA with at least 40,000 residents:
| Rank | City | 2000 population |
2010 population |
2013 population[6] |
% change (2010 to 2013) |
|---|---|---|---|---|---|
| 1 | Boston | 589,141 | 617,594 | 645,966 | +4.59% |
| 2 | Providence | 173,618 | 178,042 | 182,911 | +2.73% |
| 3 | Worcester | 172,648 | 181,045 | 182,544 | +0.83% |
| 4 | Manchester | 107,006 | 109,565 | 110,378 | +0.74% |
| 5 | Lowell | 105,167 | 106,519 | 108,861 | +2.20% |
| 6 | Cambridge | 101,355 | 105,162 | 107,289 | +2.02% |
| 7 | New Bedford | 93,768 | 95,072 | 95,078 | +0.01% |
| 8 | Brockton | 94,304 | 93,810 | 94,089 | +0.30% |
| 9 | Quincy | 88,025 | 92,271 | 93,494 | +1.33% |
| 10 | Lynn | 89,050 | 90,329 | 91,589 | +1.39% |
| 11 | Fall River | 91,938 | 88,857 | 88,697 | −0.18% |
| 12 | Newton | 83,829 | 85,146 | 87,971 | +3.32% |
| 13 | Nashua | 86,605 | 86,494 | 87,137 | +0.74% |
| 14 | Warwick | 85,808 | 82,672 | 81,971 | −0.85% |
| 15 | Cranston | 79,269 | 80,387 | 80,566 | +0.22% |
| 16 | Somerville | 77,478 | 75,754 | 78,804 | +4.03% |
| 17 | Lawrence | 72,043 | 76,377 | 77,657 | +1.68% |
| 18 | Pawtucket | 72,958 | 71,148 | 71,172 | +0.03% |
| 19 | Framingham | 66,910 | 68,318 | 70,068 | +2.56% |
| 20 | Waltham | 59,226 | 60,632 | 62,227 | +2.63% |
| 21 | Haverhill | 58,969 | 60,879 | 62,088 | +1.99% |
| 22 | Malden | 56,340 | 59,450 | 60,509 | +1.78% |
| 23 | Brookline | 57,107 | 58,732 | 59,115 | +0.65% |
| 24 | Plymouth | 51,701 | 56,468 | 57,463 | +1.76% |
| 25 | Medford | 55,765 | 56,173 | 57,170 | +1.77% |
| 26 | Taunton | 55,976 | 55,874 | 56,069 | +0.35% |
| 27 | Weymouth | 53,988 | 53,743 | 55,419 | +3.12% |
| 28 | Revere | 47,283 | 51,755 | 53,756 | +3.87% |
| 29 | Methuen | 43,789 | 47,255 | 52,044 | +10.13% |
| 30 | Peabody | 48,129 | 51,251 | 52,044 | +1.55% |
| 31 | East Providence | 48,722 | 47,037 | 47,149 | +0.24% |
| 32 | Barnstable | 47,821 | 45,193 | 44,641 | −1.22% |
| 33 | Attleboro | 42,068 | 43,954 | 43,886 | −0.15% |
| 34 | Arlington | 42,389 | 42,844 | 42,844 | 0.00% |
| 35 | Everett | 38,037 | 41,667 | 42,935 | +3.04% |
| 36 | Salem | 40,407 | 41,340 | 42,544 | +2.91% |
| 37 | Concord | 40,687 | 42,695 | 42,419 | −0.65% |
| 38 | Woonsocket | 43,224 | 41,186 | 41,026 | −0.39% |
| 39 | Beverly | 39,862 | 39,502 | 40,664 | +2.94% |
Demographics
Population density
The most densely populated census tracts in the Boston CSA (2010):[7]
| Rank | City or Neighborhood | Census Tract | Population | Population density | |
|---|---|---|---|---|---|
| /sq mi | /km2 | ||||
| 1 | Fenway–Kenmore | 10404 | 5,817 | 110,108 | 285,180 |
| 2 | Fenway–Kenmore | 10403 | 3,003 | 87,828 | 227,470 |
| 3 | Fenway–Kenmore | 10408 | 1,426 | 85,137 | 220,500 |
| 4 | Beacon Hill | 202 | 3,649 | 80,851 | 209,400 |
| 5 | North End | 301 | 1,954 | 66,288 | 171,690 |
| 6 | North End | 302 | 1,665 | 64,642 | 167,420 |
| 7 | North End | 304 | 2,451 | 58,435 | 151,350 |
| 8 | Cambridge | 3539 | 7,090 | 56,819 | 147,160 |
| 9 | Back Bay | 10801 | 2,783 | 56,534 | 146,420 |
| 10 | East Boston | 502 | 5,231 | 55,692 | 144,240 |
Race and ethnicity
The 40 most diverse Census tracts in the Boston CSA.[7]
| Rank | City or Neighborhood | Census Tract | Population | % White | % Black | % Hispanic | % Asian | % multiracial or other |
|---|---|---|---|---|---|---|---|---|
| 1 | Dorchester | 916 | 3,138 | 12 | 32 | 15 | 26 | 14 |
| 2 | Pawtucket | 161 | 4,607 | 28 | 24 | 28 | 1 | 18 |
| 3 | Pawtucket | 151 | 4,472 | 24 | 24 | 29 | 1 | 23 |
| 4 | Pawtucket | 164 | 4,938 | 29 | 26 | 21 | 2 | 20 |
| 5 | Dorchester | 912 | 3,234 | 30 | 24 | 22 | 6 | 18 |
| 6 | Dorchester | 92101 | 6,451 | 30 | 22 | 11 | 31 | 6 |
| 7 | Brockton | 5115 | 4,308 | 21 | 32 | 13 | 2 | 32 |
| 8 | Brockton | 511 | 3,040 | 28 | 33 | 15 | 1 | 24 |
| 9 | New Bedford | 6519 | 1,942 | 26 | 11 | 33 | 1 | 29 |
| 10 | Mission Hill | 80801 | 3,885 | 32 | 20 | 35 | 10 | 2 |
| 11 | Pawtucket | 154 | 2,258 | 35 | 20 | 35 | 0 | 11 |
| 12 | Brockton | 5114 | 3,716 | 24 | 36 | 14 | 2 | 23 |
| 13 | Brockton | 5109 | 2,531 | 24 | 36 | 16 | 1 | 24 |
| 14 | Brockton | 5103 | 3,798 | 23 | 38 | 15 | 2 | 24 |
| 15 | Brockton | 5104 | 3,706 | 19 | 38 | 15 | 2 | 25 |
| 16 | Dorchester | 90901 | 3,730 | 38 | 18 | 21 | 20 | 4 |
| 17 | Worcester | 733 | 3,762 | 38 | 10 | 37 | 12 | 4 |
| 18 | Providence | 26 | 3,098 | 23 | 22 | 39 | 10 | 6 |
| 19 | Malden | 3415 | 4,780 | 39 | 23 | 14 | 19 | 5 |
| 20 | Cambridge | 3524 | 2,126 | 27 | 39 | 16 | 12 | 5 |
| 21 | South End | 71202 | 3,131 | 39 | 19 | 24 | 15 | 3 |
| 22 | Brockton | 511301 | 5,334 | 39 | 31 | 11 | 2 | 17 |
| 23 | Providence | 15 | 2,994 | 28 | 13 | 41 | 14 | 4 |
| 24 | South Boston | 61 | 3,098 | 41 | 15 | 29 | 11 | 4 |
| 25 | Lynn | 2072 | 2,939 | 30 | 12 | 42 | 13 | 2 |
| 26 | Cambridge | 3549 | 6,058 | 35 | 30 | 9 | 20 | 5 |
| 27 | South Boston | 61101 | 2,232 | 20 | 21 | 42 | 14 | 2 |
| 28 | Brockton | 5116 | 7,211 | 42 | 29 | 10 | 2 | 16 |
| 29 | Roxbury | 801 | 3,350 | 15 | 43 | 28 | 1 | 11 |
| 30 | Lowell | 3114 | 5,986 | 44 | 11 | 14 | 26 | 5 |
| 31 | Brockton | 5108 | 6,339 | 18 | 44 | 12 | 2 | 22 |
| 32 | Mission Hill | 81001 | 4,890 | 45 | 14 | 19 | 19 | 2 |
| 33 | Malden | 3418 | 6,554 | 46 | 20 | 13 | 16 | 5 |
| 34 | South Boston | 607 | 1,893 | 19 | 20 | 46 | 10 | 5 |
| 35 | Brockton | 5107 | 5,656 | 46 | 31 | 8 | 4 | 11 |
| 36 | Brockton | 5112 | 4,849 | 47 | 26 | 11 | 1 | 13 |
| 37 | Somerville | 351404 | 4,289 | 47 | 7 | 22 | 13 | 11 |
| 38 | Lynn | 2071 | 3,513 | 18 | 11 | 48 | 19 | 3 |
| 39 | Framingham | 383101 | 4,923 | 23 | 10 | 48 | 1 | 18 |
| 40 | Mission Hill | 811 | 4,091 | 48 | 21 | 15 | 13 | 2 |
The 40 census tracts in the Boston CSA with the highest percentage of residents who identify as Hispanic or Latino.[7]
| Rank | City or Neighborhood | Census Tract | Population | % Hispanic or Latino |
|---|---|---|---|---|
| 1 | Lawrence | 2525 | 3,810 | 94 |
| 2 | Lawrence | 2509 | 2,193 | 93 |
| 3 | Lawrence | 2504 | 3,858 | 90 |
| 4 | Lawrence | 2503 | 2,101 | 89 |
| 5 | Lawrence | 2513 | 3,721 | 89 |
| 6 | Lawrence | 2512 | 1,356 | 86 |
| 7 | Lawrence | 2507 | 4,756 | 86 |
| 8 | Lawrence | 251 | 1,782 | 85 |
| 9 | Chelsea | 1602 | 4,043 | 83 |
| 10 | Lawrence | 2506 | 5,599 | 83 |
| 11 | Lawrence | 2514 | 5,053 | 77 |
| 12 | Chelsea | 160101 | 7,551 | 76 |
| 13 | Lawrence | 2501 | 2,329 | 75 |
| 14 | Lawrence | 2516 | 5,977 | 74 |
| 15 | Lawrence | 2511 | 2,937 | 73 |
| 16 | Lawrence | 2502 | 5,524 | 72 |
| 17 | Chelsea | 1604 | 2,716 | 71 |
| 18 | Chelsea | 160501 | 5,604 | 71 |
| 19 | Providence | 16 | 8,540 | 70 |
| 20 | Lawrence | 2515 | 6,149 | 70 |
| 21 | Worcester | 732001 | 3,327 | 67 |
| 22 | East Boston | 506 | 2,063 | 67 |
| 23 | East Boston | 502 | 5,231 | 66 |
| 24 | East Boston | 507 | 4,504 | 65 |
| 25 | East Boston | 50901 | 4,165 | 65 |
| 26 | Providence | 2 | 6,452 | 64 |
| 27 | Providence | 4 | 3,761 | 64 |
| 28 | Providence | 14 | 6,693 | 63 |
| 29 | Providence | 5 | 3,040 | 63 |
| 30 | Central Falls | 11 | 5,534 | 63 |
| 31 | Lawrence | 2508 | 6,932 | 63 |
| 32 | Chelsea | 160502 | 4,460 | 62 |
| 33 | Methuen | 2524 | 4,175 | 62 |
| 34 | Providence | 17 | 3,744 | 62 |
| 35 | Providence | 18 | 7,114 | 61 |
| 36 | Central Falls | 111 | 4,176 | 61 |
| 37 | East Boston | 50101 | 5,115 | 61 |
| 38 | Lawrence | 2517 | 5,145 | 61 |
| 39 | Providence | 3 | 7,714 | 60 |
| 40 | Central Falls | 108 | 4,763 | 59 |
Census tracts in the Boston CSA with the highest percentage of residents who identify as Black American.[7]
| Rank | City or Neighborhood | Census Tract | Population | % Black |
|---|---|---|---|---|
| 1 | Mattapan | 101101 | 3,115 | 84 |
| 2 | Mattapan | 101102 | 4,396 | 84 |
| 3 | Mattapan | 101001 | 5,480 | 83 |
| 4 | Mattapan | 1003 | 3,303 | 80 |
| 5 | Mattapan | 1002 | 2,787 | 78 |
| 6 | Mattapan | 101002 | 4,979 | 77 |
| 7 | Dorchester | 923 | 2,893 | 77 |
| 8 | Roxbury | 82 | 2,815 | 74 |
| 9 | Roxbury | 817 | 3,820 | 71 |
| 10 | Hyde Park | 1404 | 7,650 | 71 |
| 11 | Roxbury | 901 | 4,571 | 71 |
| 12 | Dorchester | 919 | 3,860 | 70 |
| 13 | Dorchester | 1004 | 4,865 | 68 |
| 14 | Roxbury | 819 | 3,115 | 66 |
| 15 | Roxbury | 924 | 5,277 | 66 |
| 16 | Roxbury | 818 | 2,898 | 65 |
| 17 | Mattapan | 1001 | 5,510 | 64 |
| 18 | Roxbury | 815 | 2,134 | 62 |
| 19 | Roxbury | 821 | 5,025 | 62 |
| 20 | Roxbury | 803 | 1,769 | 60 |
| 21 | Roxbury | 903 | 3,179 | 58 |
| 22 | Dorchester | 1009 | 4,072 | 58 |
| 23 | Dorchester | 1005 | 5,909 | 55 |
| 24 | Hyde Park | 1403 | 6,382 | 54 |
| 25 | Dorchester | 92 | 4,945 | 54 |
| 26 | Roxbury | 902 | 2,233 | 53 |
| 27 | Dorchester | 918 | 3,452 | 52 |
| 28 | Roxbury | 904 | 3,659 | 52 |
| 29 | Roxbury | 814 | 3,003 | 50 |
| 30 | Roxbury | 80401 | 2,710 | 50 |
| 31 | Roslindale | 140106 | 1,901 | 49 |
| 32 | Dorchester | 917 | 3,069 | 47 |
| 33 | Dorchester | 914 | 2,741 | 46 |
| 34 | Brockton | 5108 | 6,339 | 44 |
| 35 | Roxbury | 805 | 3,096 | 44 |
| 36 | Roxbury | 801 | 3,350 | 43 |
| 37 | Randolph | 420302 | 7,703 | 42 |
| 38 | Roxbury | 813 | 4,760 | 42 |
| 39 | Dorchester | 922 | 3,349 | 42 |
| 40 | Randolph | 420202 | 6,303 | 40 |
Census tracts in the Boston CSA with the highest percentage of residents who identify as Asian American.[7]
| Rank | City or Neighborhood | Census Tract | Population | % Asian |
|---|---|---|---|---|
| 1 | South End | 70402 | 1,723 | 70 |
| 2 | Chinatown | 702 | 5,218 | 58 |
| 3 | Lowell | 3112 | 3,267 | 55 |
| 4 | Lowell | 3118 | 3,513 | 54 |
| 5 | Lowell | 3117 | 5,098 | 47 |
| 6 | Quincy | 417502 | 4,639 | 45 |
| 7 | Quincy | 4172 | 8,182 | 44 |
| 8 | Malden | 3413 | 5,439 | 39 |
| 9 | Lowell | 3113 | 4,057 | 38 |
| 10 | Westborough | 742402 | 3,026 | 38 |
| 11 | Quincy | 417501 | 5,004 | 37 |
| 12 | Cambridge | 353102 | 5,040 | 36 |
| 13 | Quincy | 417802 | 3,150 | 35 |
| 14 | Lowell | 3111 | 2,410 | 34 |
| 15 | Lowell | 3115 | 2,974 | 33 |
| 16 | Dorchester | 92101 | 6,451 | 31 |
| 17 | Quincy | 417601 | 5,196 | 30 |
| 18 | Fenway–Kenmore | 10103 | 4,569 | 29 |
| 19 | Quincy | 4180002 | 7,020 | 28 |
| 20 | Quincy | 417602 | 5,155 | 28 |
| 21 | Chinatown/Leather District/Downtown | 70101 | 5,902 | 27 |
| 22 | Cambridge | 3539 | 7,090 | 27 |
| 23 | Lowell | 3114 | 5,986 | 26 |
| 24 | Lowell | 3116 | 5,295 | 26 |
| 25 | Lowell | 3107 | 4,441 | 26 |
| 26 | Quincy | 4171 | 4,264 | 26 |
| 27 | Dorchester | 916 | 3,138 | 26 |
| 28 | Malden | 3412 | 6,857 | 25 |
| 29 | Malden | 341102 | 4,564 | 25 |
| 30 | Malden | 341101 | 3,675 | 25 |
| 31 | Acton | 363102 | 5,909 | 25 |
| 32 | Dorchester | 911 | 4,861 | 25 |
| 33 | Allston-Brighton | 703 | 2,791 | 24 |
| 34 | Lexington | 3583 | 5,526 | 24 |
| 35 | Quincy | 418004 | 4,280 | 23 |
| 36 | Brookline | 4009 | 3,865 | 22 |
| 37 | Cambridge | 3532 | 4,897 | 22 |
| 38 | Cambridge | 352101 | 1,654 | 22 |
| 39 | Shrewsbury | 7391 | 9,557 | 22 |
| 40 | Westborough | 7612 | 5,780 | 22 |
Census tracts in the Boston CSA with the highest percentage of residents who identify as Irish American.[8]
| City or Neighborhood | Census Tract | Population | % Irish |
|---|---|---|---|
| South Boston | 60101 | 3,106 | 68 |
| Milton | 416400 | 6,069 | 63 |
| Charlestown | 040401 | 2,439 | 63 |
| Dorchester | 1007 | 4,322 | 63 |
| South Boston | 608 | 3,964 | 62 |
| South Boston | 604 | 4,904 | 61 |
| Milton | 416101 | 5,724 | 58 |
| Marshfield | 506204 | 4,886 | 57 |
| Weymouth | 422100 | 5,293 | 57 |
| Quincy | 417801 | 5,443 | 55 |
| Hull | 500101 | 3,702 | 55 |
| Scituate | 505101 | 3,860 | 55 |
| West Roxbury | 130402 | 4,637 | 54 |
| Quincy | 417400 | 2,566 | 53 |
| South Boston | 60301 | 3,076 | 52 |
| Abington | 520100 | 6,458 | 52 |
| Braintree | 419200 | 5,002 | 52 |
| Braintree | 419600 | 6,766 | 52 |
| Abington | 520201 | 3,952 | 52 |
| Pembroke | 508200 | 6,031 | 52 |
Census tracts in the Boston CSA with the highest percentage of residents who identify as Italian American.[9]
| City or Neighborhood | Census Tract | Population | % Italian |
|---|---|---|---|
| Johnston | 012402 | 2,486 | 63 |
| Cranston | 014501 | 5,179 | 58 |
| Johnston | 012500 | 5,490 | 57 |
| Johnston | 012200 | 7,187 | 57 |
| Providence | 011902 | 4,780 | 55 |
| Cranston | 014800 | 5,591 | 55 |
| Saugus | 208102 | 3,343 | 51 |
| Cranston | 014300 | 4,716 | 49 |
| Cranston | 014600 | 6,991 | 49 |
| Cranston | 014502 | 4,096 | 48 |
| Johnston | 012300 | 6,656 | 48 |
| Johnston | 012401 | 6,950 | 48 |
| Stoneham | 337102 | 5,042 | 45 |
| Stoneham | 337202 | 4,849 | 45 |
| Revere | 170200 | 4,564 | 45 |
| Revere | 170502 | 2,818 | 43 |
| Cranston | 013900 | 2,992 | 43 |
| Revere | 170300 | 9,040 | 43 |
| North Providence | 012103 | 2,965 | 43 |
Census tracts in the Boston CSA with the highest percentage of residents who identify as Portuguese American.[10]
| City or Neighborhood | Census Tract | Population | % Portuguese |
|---|---|---|---|
| New Bedford | 652800 | 3,277 | 72 |
| Fall River | 640600 | 4,450 | 69 |
| Dartmouth | 653203 | 5,005 | 65 |
| New Bedford | 652400 | 2,664 | 64 |
| New Bedford | 652000 | 2,676 | 62 |
| Fall River | 640500 | 5,165 | 60 |
| Fall River | 641200 | 2,803 | 59 |
| New Bedford | 650500 | 3,141 | 58 |
| Fall River | 640901 | 5,071 | 58 |
| New Bedford | 650400 | 3,773 | 57 |
| New Bedford | 652500 | 2,589 | 56 |
| East Providence | 010400 | 6,661 | 55 |
| New Bedford | 652300 | 2,870 | 54 |
| Fall River | 641000 | 2,419 | 54 |
| Fall River | 640300 | 3,693 | 53 |
| Westport | 646101 | 7,356 | 53 |
| Fall River | 640700 | 2,900 | 53 |
| Fall River | 640400 | 2,682 | 53 |
| New Bedford | 650101 | 5,753 | 53 |
| Fall River | 640100 | 5,358 | 52 |
Census tracts in the Boston CSA with French or French Canadian listed as first ancestry.[11]
| City or Neighborhood | Census Tract | Population | % French |
|---|---|---|---|
| Woonsocket | 018500 | 2,831 | 66 |
| Woonsocket | 017700 | 3,518 | 61 |
| Woonsocket | 017500 | 3,128 | 59 |
| Woonsocket | 017800 | 2,514 | 58 |
| Burrillville | 013001 | 3,479 | 56 |
| North Smithfield | 012802 | 2,391 | 54 |
| North Smithfield | 012803 | 4,776 | 53 |
| Burrillville | 013002 | 7,539 | 53 |
| North Smithfield | 012801 | 4,800 | 52 |
| Manchester | 002300 | 3,758 | 52 |
| Woonsocket | 017900 | 3,049 | 51 |
| Burrillville | 012900 | 4,937 | 50 |
| Manchester | 000202 | 2,297 | 49 |
| Manchester | 002100 | 4,782 | 49 |
| Woonsocket | 017600 | 2,560 | 49 |
| Manchester | 002600 | 5,746 | 48 |
| Manchester | 002200 | 3,232 | 47 |
| Woonsocket | 018400 | 6,527 | 47 |
| Blackstone | 747101 | 5,110 | 47 |
| Woonsocket | 018000 | 2,680 | 46 |
Other
Greater Boston has a sizable Jewish community, estimated at between 210,000 people,[12][13] and 261,000[14] or 5–6% of the Greater Boston metro population, compared with about 2% for the nation as a whole. Contrary to national trends, the number of Jews in Greater Boston has been growing, fueled by the fact that 60% of children in Jewish mixed-faith families are raised Jewish, compared with roughly one in three nationally.[12]
The City of Boston also has one of the largest LGBT populations per capita. It ranks fifth of all major cities in the country (behind San Francisco, and slightly behind Seattle, Atlanta, and Minneapolis respectively), with 12.3% of the city recognizing themselves as gay, lesbian, or bisexual.[15]
Selected statistics
Changes in house prices for the Greater Boston area are publicly tracked on a regular basis using the Case–Shiller index; the statistic is published by Standard & Poor's and is also a component of S&P's 10-city composite index of the value of the residential real estate market.
Major companies
- Companies along, inside or outside I-495:
- Abbott Laboratories, in Worcester (Pharmaceutical laboratory)
- Advanced Cell Technology, in Worcester (Research laboratory)
- AMD, in Boxborough
- Analog Devices, in Norwood
- Avid Technology, Inc, in Burlington (Headquarters)
- Azimuth Systems, in Acton
- Bain & Company, in Boston (Headquarters)
- Bain Capital, in Boston (Headquarters)
- Bertucci's Corporation, in Northborough (Headquarters)
- BJ's Wholesale Club, Inc., in Westborough (Headquarters)
- Bose Corporation, in Framingham (Headquarters)
- Boston Properties, Inc., in Boston (Headquarters)
- Boston Scientific Corporation, in Natick (Headquarters)
- Boston Scientific Corporation, in Marlborough
- Charles River Laboratories, in Wilmington (Headquarters)
- Cisco Systems, in Boxborough
- Converse, in North Andover (Headquarters)
- David Clark Company, in Worcester (manufacturer of space suits)
- Diebold, in Marlborough (Regional Headquarters)
- EMC Corporation, in Hopkinton (Headquarters)
- Evergreen Solar, in Marlborough (Headquarters)
- Genzyme Corporation, in Framingham
- Hewlett-Packard, in Marlborough (Regional Headquarters)
- HourlyNerd, in Boston
- Innerscope Research, in Boston (Headquarters)
- Intel Corporation, in Hudson
- Marshalls, Inc, in Framingham (Headquarters)
- The MathWorks, in Natick
- MITRE Corporation, in Bedford (Headquarters)
- Monster.com, in Maynard (Headquarters)
- Morgan Construction Company, in Worcester, rolling steel mill technology
- Novartis, Headquartered in Cambridge (Massachusetts), with locations worldwide - a Swiss multinational pharmaceutical company based in Basel, Switzerland
- Philips Electronics North America, in Andover (Regional Headquarters)
- Philips Healthcare, in Andover (Global Headquarters) and Framingham
- Red Hat, in Westford (Engineering Headquarters)
- Reed & Barton in Taunton (Factory & Headquarters)
- Saint-Gobain, in Worcester
- Sepracor, Inc., in Marlborough (Headquarters)
- Staples, Inc., in Framingham (Headquarters)
- Stop & Shop, in Quincy (Headquarters)
- TJX Corporation, in Framingham (Headquarters)
- Vertex Pharmaceuticals Inc., in Boston (Headquarters)
- UniFirst, in Wilmington (Headquarters)
- WB Mason, in Brockton (Headquarters)
- Wyman-Gordon, in Grafton, complex metal components and products
- Companies along or inside I-95 (Route 128), not including Boston:
- Akamai Technologies, in Cambridge (Headquarters)
- AstraZeneca, in Waltham (R&D)
- BBN Technologies, in Cambridge (Headquarters)
- Biocell Center, in Medford (North American Headquarters)
- Biogen Idec, in Weston (North American Headquarters)
- Carl Zeiss SMT, in Peabody (North American Headquarters)
- Constant Contact, in Walthem
- Dunkin' Brands, in Canton (Headquarters)
- Facebook, in Cambridge
- Genzyme Corporation, in Cambridge (Headquarters)
- Genzyme Corporation, in Waltham (R&D)
- General Electric Aviation, in Lynn
- Google Inc., in Cambridge
- Haemonetics, in Braintree
- IBM, in Waltham, Cambridge and Littleton
- InterSystems Corporation, in Cambridge (Headquarters)
- iRobot Corporation, in Burlington (Headquarters)
- Keurig, in Reading (Headquarters)
- Meditech, in Westwood (Headquarters)
- Microsoft Corporation, in Cambridge
- Millennium Pharmaceuticals, in Cambridge
- National Amusements (Parent company of CBS and Viacom), in Dedham (Headquarters)
- National Grid, in Waltham (US Headquarters)
- NetApp Inc, in Waltham
- Nokia, in Burlington
- Novartis AG, Inc, in Cambridge (Research Headquarters)
- Novell, Inc., in Waltham
- Nuance Communications, in Burlington
- Oracle Corporation in Burlington
- Osram Sylvania in Danvers (Headquarters)
- Parametric Technology Corporation in Needham (Headquarters)
- Philips Lighting in Burlington
- Progress Software in Bedford (Headquarters)
- Raytheon, in Waltham (Headquarters)
- Reebok, in Canton (U.S. Headquarters)
- SunSetter Products, LP, in Malden (Headquarters)
- Teradyne, in North Reading (Headquarters)
- Thermo Fisher Scientific, in Waltham (Headquarters)
- TripAdvisor, LLC, in Newton (Headquarters)
- Twitter, in Cambridge
- Vistaprint, in Lexington (North American Headquarters)[20]
- Major companies inside Boston proper:
- American Tower (headquarters)
- Au Bon Pain (headquarters)
- Bain & Company (headquarters)
- Bentley Motors (U.S. headquarters)
- Blue Cross Blue Shield of Massachusetts (headquarters)
- Boston Consulting Group (headquarters)
- Fidelity Investments (headquarters)
- The Gillette Company, now owned by Procter & Gamble (headquarters)
- Houghton Mifflin Harcourt (headquarters)
- John Hancock Financial Services, Inc, now the United States division of Canada's Manulife Financial
- Liberty Mutual (headquarters)
- LogMeIn (headquarters)
- LPL Financial (headquarters)
- New Balance Athletic Shoe, Inc. (headquarters)
- Putnam Investments (headquarters)
- Sapient Corporation (headquarters)
- Sonesta International Hotels Corp. (headquarters)
- State Street Corporation (headquarters)
- Steward Health Care System (headquarters)
- Vertex Pharmaceuticals (headquarters)
- Wayfair (headquarters)
- Wellington Management Company (headquarters)
- Zipcar (headquarters)
Sports
| Club | Sport | League | Stadium | Established | League Titles |
|---|---|---|---|---|---|
| Boston Bruins | Ice hockey | National Hockey League | TD Garden (Boston) | 1924 | 6 Stanley Cups 7 Eastern Conference Titles |
| Boston Cannons | Lacrosse | Major League Lacrosse | Harvard Stadium (Boston) | 2001 | 1 MLL Championship |
| Boston Celtics | Basketball | National Basketball Association | TD Garden (Boston) | 1946 | 17 NBA Championships 21 Eastern Conference Titles |
| Boston Red Sox | Baseball | Major League Baseball (American League) | Fenway Park (Boston) | 1901 | 8-time MLB World Series Champions 13 American League Pennants |
| New England Patriots | Football | National Football League (American Football Conference) | Gillette Stadium (Foxboro) | 1960 (as Boston Patriots) |
4-time Super Bowl Champions 8-time AFC Champions |
| New England Revolution | Soccer | Major League Soccer | Gillette Stadium (Foxboro) | 1995 | 1 US Open Cup 1 SuperLiga |
Annual sporting events include:
- The Boston Marathon, which follows a course from Hopkinton to Boston
- The Head of the Charles Regatta
- The Lenox Industrial Tools 301, Sylvania 300 and New Hampshire Indy 225 auto races at the New Hampshire Motor Speedway oval track.
Higher education
A long time center of higher education, the area includes many community colleges, two-year schools, and internationally prominent undergraduate and graduate institutions. The graduate schools include highly regarded schools of law, medicine, business, technology, international relations, public health, education, and religion.
Transportation
Highways
- Central Artery/Tunnel Project (Interstate 93 within Boston)
- Interstate 95: North to New Hampshire and Maine; south to Providence, Rhode Island and beyond. Largely concurrent with MA-128
- U.S. 1
- Interstate 93: North to New Hampshire; south to Canton
- U.S. Route 3
- Massachusetts Route 2: Northwest and west
- The Massachusetts Turnpike (Interstate 90): West to Framingham, Massachusetts and beyond
- Massachusetts Route 9: Western suburbs, to Framingham and Pittsfield
- Massachusetts Route 24: South toward Newport, Rhode Island
- Massachusetts Route 3: Southeast through South Shore to Cape Cod
- Massachusetts Route 128 (I-95/I-93): Circumferential Highway (close to Boston)
- Interstate 495: Circumferential (farther from Boston)
- Route 128 is sometimes regarded as the unofficial boundary of the Greater Boston region, especially to the north and south. When the name Greater Boston is used in a more inclusive sense, I-495 is sometimes regarded as the boundary.
Bridges and tunnels
- Callahan Tunnel, carrying Route 1A Northbound
- Sumner Tunnel, carrying Route 1A Southbound
- Ted Williams Tunnel, carrying I-90
- Thomas P. O'Neill Jr. Tunnel, carrying I-93 and Routes 1 and 3 concurrently.
- Tobin Bridge, carrying Route 1
- Zakim Bunker Hill Bridge, carrying Interstate 93, Route 1 and Route 3 concurrently.
- Fore River Bridge, carrying Massachusetts Route 3A concurrently.
Airports
- Logan International Airport in Boston, 3 miles (4.8 km) northeast of downtown Boston, New England's largest transportation center.
- Manchester-Boston Regional Airport in Manchester, New Hampshire
- T. F. Green Airport in Providence, Rhode Island
- Hanscom Field in Bedford
- Norwood Memorial Airport
- Worcester Regional Airport
- Beverly Airport
Rail and bus
- Massachusetts Bay Transportation Authority (MBTA, generally known as the "T".)
- Red Line: Cambridge–Braintree and Boston (Mattapan)
- Orange Line: Boston (Jamaica Plain)–Malden
- Green Line: Cambridge–Brookline and Newton
- Blue Line: Boston–Revere
- Silver Line South Station–Logan Airport and Downtown–Dudley Square
- MBTA Commuter Rail
- Old Colony Lines serving Plymouth County
- Providence/Stoughton Line serving northern Bristol County and western Norfolk County, connecting to Providence, Rhode Island
- Fairmount Line shuttle service from South Station
- Franklin Line serving western Norfolk County
- Greenbush Line serving Boston's South Shore
- Needham Line serving Boston suburbs and Needham
- Framingham/Worcester Line serving southwestern Middlesex County, connecting to Worcester
- Fitchburg Line serving northwestern Middlesex County, connecting to Fitchburg
- Lowell Line serving northern Middlesex County
- Haverhill/Reading Line and Newburyport/Rockport Line serving Essex County & Boston's North Shore
- Amtrak service to New York City and Washington, D.C.
- Amtrak Downeaster service to Maine from North Station
The first railway line in the United States was in Quincy. See Neponset River.
The following Regional Transit Authorities have bus service that connects with MBTA commuter rail stations:
- Brockton Area Transit Authority
- Cape Ann Transportation Authority
- Greater Attleboro Taunton Regional Transit Authority
- Lowell Regional Transit Authority
- Merrimack Valley Regional Transit Authority
- MetroWest Regional Transit Authority
- Montachusett Regional Transit Authority
- Worcester Regional Transit Authority
Ocean transportation

- Port of Boston (Massport)
- Cape Cod Canal
Geography
- Rivers
- Charles River
- Ipswich River
- Mystic River
- Neponset River
- Weymouth Fore River
- Concord River
- Merrimack River
- Taunton River
- Sudbury River
- Hills
See also
- Greater Boston League, a high school athletic conference in Massachusetts
References
- ↑ Data Access and Dissemination Systems (DADS). "American FactFinder - Results". Factfinder2.census.gov. Retrieved 4 January 2015.
- ↑ 2.0 2.1 "About MAPC". Metropolitan Area Planning Council. Archived from the original on 2007-02-21. Retrieved 2007-05-14.
- ↑ "Transportation Plan – Overview". Boston Region Metropolitan Planning Organization. 2009. Retrieved 2009-09-27.
- ↑ 4.0 4.1 "Principal cities of New England city and town areas (NECTAs)" (XLS SPREADSHEET). U.S. Census Bureau. Retrieved April 26, 2015.
- ↑ "Standards for Defining Metropolitan and Micropolitan Statistical Areas" (PDF). Office of Management and Budget. December 27, 2000. Retrieved September 14, 2009.
- ↑ "City and Town Population for 2013". U.S. Census Bureau. Retrieved September 19, 2014.
- ↑ 7.0 7.1 7.2 7.3 7.4 "Mapping the 2010 U.S. Census". U.S. Census Bureau.
- ↑ "Irish as First Ancestry Population Percentage Rank of Census Tract within 100 miles of Zip Code 02176". Usa.com. Retrieved 4 January 2015.
- ↑ "Italian as First Ancestry Population Percentage Rank of Census Tract within 100 miles of Zip Code 02176". Usa.com. Retrieved 4 January 2015.
- ↑
- ↑ "French as First Ancestry Population Percentage Rank of Census Tract within 100 miles of Zip Code 02176". Usa.com. Retrieved 4 January 2015.
- ↑ 12.0 12.1 Michael Paulson (2006-11-10). "Jewish population in region rises". The Boston Globe. Retrieved 2009-11-29.
- ↑ "Cities with the Largest Jewish Population in the Diaspora". adherents.com. Retrieved 2009-11-29.
- ↑ "Metro Area Membership Report". The Association of Religion Data Archives. Retrieved 2009-11-29.
- ↑ "12.9% in Seattle are gay or bisexual, second only to S.F., study says". The Seattle Times (The Seattle Times Company). 2006. Retrieved 2009-05-01.
- ↑ "2009 Globe 100 – Top Massachusetts-based employers". The Boston Globe. 2010-01-19.
- ↑
- ↑ "Top Companies in Massachusetts on the Inc. 5000 - Inc.com". Inc.com. Retrieved 4 January 2015.
- ↑
- ↑ "Who We Are & About Us - Vistaprint". News.vistaprint.com. Retrieved 4 January 2015.
Further reading
| Wikivoyage has a travel guide for Greater Boston. |
- Wilson, Susan (2005). The Literary Trail of Greater Boston: A Tour of Sites in Boston, Cambridge, and Concord, Revised Edition. Commonwealth Editions. ISBN 1-889833-67-3. An informative guidebook, with facts and data about literary figures, publishers, bookstores, libraries, and other historic sites on the newly designated Literary Trail of Greater Boston.
- Warner, Sam, Jr. (2001). Greater Boston: Adapting Regional Traditions to the Present. University of Pennsylvania Press. ISBN 0-8122-1769-1.
| ||||||||||||||||||||||||||
| ||||||||||||||||||||||||||
| ||||||||||||||||||||||||||||||||||
| ||||||||||||||||||||||||||
| ||||||||||||||||
| ||||||||||
Coordinates: 42°21′29″N 71°03′49″W / 42.35817°N 71.06369°W