Great Yarmouth Borough Council election, 2007
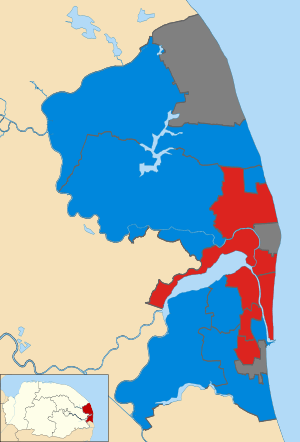
Map of the results of the 2007 Great Yarmouth council election.
Conservatives in blue and
Labour in red. Wards in grey were not contested in 2007.
The 2007 Great Yarmouth Borough Council election took place on 3 May 2007 to elect members of Great Yarmouth Borough Council in Norfolk, England. One third of the council was up for election and the Conservative party stayed in overall control of the council.[1]
After the election, the composition of the council was
Background
Before the election the Conservatives ran the council with 22 seats, compared to 16 for Labour.[3] There was also a former Conservative, John Hudson in West Flegg, who stood down at the election.[3]
Among the candidates at the election were the wives of the Conservative and Labour leaders on the council, Mary Coleman and Hilary Wainwright, standing against each other in West Flegg, and the wife of Labour Member of Parliament Tony Wright, Barbara Wright contesting Fleggburgh.[3] The election was mainly contested between the Conservative and Labour parties, but there were also candidates from the Green Party, United Kingdom Independence Party, Liberal Democrats and National Front.[3]
Election result
Overall turnout at the election was 31.58%.[4]
| Great Yarmouth Local Election Result 2007[4][2] |
| Party |
Seats |
Gains |
Losses |
Net gain/loss |
Seats % |
Votes % |
Votes |
+/− |
| |
Conservative |
8 |
1 |
1 |
0 |
57.1 |
53.0 |
9,919 |
+1.1% |
| |
Labour |
6 |
1 |
0 |
+1 |
42.9 |
36.0 |
6,736 |
-2.0% |
| |
Green |
0 |
0 |
0 |
0 |
0 |
3.5 |
649 |
+3.0% |
| |
UKIP |
0 |
0 |
0 |
0 |
0 |
3.3 |
617 |
+2.0% |
| |
Liberal Democrat |
0 |
0 |
0 |
0 |
0 |
2.6 |
492 |
-3.6% |
| |
National Front |
0 |
0 |
0 |
0 |
0 |
1.6 |
298 |
-0.4% |
| |
Independent |
0 |
0 |
1 |
-1 |
0 |
0 |
0 |
0 |
Ward results
| Bradwell South[4] |
| Party |
Candidate |
Votes |
% |
±% |
|
Conservative |
Brian Howard |
874 |
53.2 |
-12.6 |
|
Labour |
Peter Alexander |
459 |
27.9 |
-6.3 |
|
UKIP |
Colin Aldred |
310 |
18.9 |
+18.9 |
| Majority |
415 |
25.3 |
-6.3 |
| Turnout |
1,643 |
31.9 |
+1.0 |
|
Conservative hold |
Swing |
|
|
| Caister North[4] |
| Party |
Candidate |
Votes |
% |
±% |
|
Conservative |
Barry Cunniffe |
655 |
55.3 |
+0.3 |
|
Labour |
Nicholas Dack |
356 |
30.1 |
-1.0 |
|
Liberal Democrat |
Nicholas Dyer |
173 |
14.6 |
+0.7 |
| Majority |
299 |
25.3 |
+1.3 |
| Turnout |
1,184 |
32.0 |
-0.1 |
|
Conservative hold |
Swing |
|
|
| Central and Northgate[4] |
| Party |
Candidate |
Votes |
% |
±% |
|
Labour |
Terence Easter |
659 |
42.4 |
-1.2 |
|
Conservative |
Gerald Jarvis |
492 |
31.6 |
-1.5 |
|
UKIP |
Gabriele Baugh |
155 |
10.0 |
+2.3 |
|
Liberal Democrat |
Anthony Harris |
150 |
9.6 |
+0.1 |
|
Green |
Giles Robins |
99 |
6.4 |
+0.3 |
| Majority |
167 |
10.7 |
+0.2 |
| Turnout |
1,555 |
28.4 |
-0.8 |
|
Labour hold |
Swing |
|
|
| Nelson[4] |
| Party |
Candidate |
Votes |
% |
±% |
|
Labour |
Susan Robinson |
553 |
42.4 |
+2.8 |
|
Conservative |
Joy Cosaitis |
356 |
27.3 |
-7.2 |
|
National Front |
Thomas Holmes |
298 |
22.9 |
-3.0 |
|
Green |
Filipe Dos Santos |
97 |
7.4 |
+7.4 |
| Majority |
197 |
15.1 |
+10.0 |
| Turnout |
1,304 |
23.6 |
-1.5 |
|
Labour hold |
Swing |
|
|
| Southtown and Cobholm[4] |
| Party |
Candidate |
Votes |
% |
±% |
|
Labour |
John Holmes |
348 |
44.2 |
+1.8 |
|
Conservative |
Elizabeth Giles |
232 |
29.5 |
+4.2 |
|
UKIP |
Paul Baugh |
152 |
19.3 |
+4.4 |
|
Green |
Peter Offord |
55 |
7.0 |
+7.0 |
| Majority |
116 |
14.7 |
-2.4 |
| Turnout |
787 |
22.9 |
-1.5 |
|
Labour hold |
Swing |
|
|
References