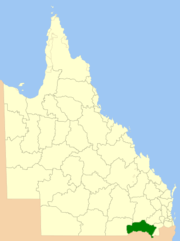
Goondiwindi Region
| Goondiwindi Region Queensland | |||||||||||||
|---|---|---|---|---|---|---|---|---|---|---|---|---|---|
|
Location within Queensland | |||||||||||||
| Population | 11,413 (2010)[1] | ||||||||||||
| • Density | 0.591589/km2 (1.53221/sq mi) | ||||||||||||
| Established | 2008 | ||||||||||||
| Area | 19,292.1 km2 (7,448.7 sq mi) | ||||||||||||
| Mayor | Graeme Scheu[2] | ||||||||||||
| Council seat | Goondiwindi | ||||||||||||
| Region | Darling Downs | ||||||||||||
| State electorate(s) | Southern Downs | ||||||||||||
| Federal Division(s) | Maranoa | ||||||||||||
| Website | Goondiwindi Region | ||||||||||||
| |||||||||||||
The Goondiwindi Region is a local government area located in the Darling Downs region of Queensland, Australia along the state's border with New South Wales. Established in 2008, it was preceded by three previous local government areas which dated back to the 19th century.
It has an estimated operating budget of A$26.1 million.
History
The Goondiwindi Region began as three separate entities: the Town of Goondiwindi, the Shire of Waggamba and the Shire of Inglewood.
Inglewood and Waggamba began as two of Queensland's 74 divisions created under the Divisional Boards Act 1879 on 11 November 1879. The Municipality of Goondiwindi was proclaimed under the Local Government Act 1878 on 20 October 1888. They became shires, and a town, respectively on 31 March 1903 under the Local Authorities Act 1902.
In July 2007, the Local Government Reform Commission released its report and recommended that the three areas amalgamate.[3] On 15 March 2008, the Town and Shires formally ceased to exist, and elections were held on the same day to elect councillors and a mayor to the Regional Council.
Wards
The council remains undivided and its elected body consists of six councillors and a mayor.
Towns and localities
- Boggabilla
- Bonshaw
- Boomi
- Bungunya
- Callandoon
- Coolmunda
- Daymar
- Glenarbon
- Kurumbul
- Limevale
- Riverton
- Talwood
- Toobeah
- Weengallon
- Yelarbon
Population
The populations given relate to the component entities prior to 2008. The next census, due in 2011, will be the first for the new Region.
| Year | Region total | Goondiwindi | Waggamba | Inglewood |
|---|---|---|---|---|
| 1933 | 8,696 | 1,931 | 2,468 | 4,297 |
| 1947 | 9,114 | 2,467 | 2,590 | 4,057 |
| 1954 | 10,359 | 2,950 | 2,968 | 4,441 |
| 1961 | 11,265 | 3,274 | 3,123 | 4,868 |
| 1966 | 10,608 | 3,529 | 2,895 | 4,184 |
| 1971 | 10,253 | 3,695 | 2,913 | 3,645 |
| 1976 | 9,509 | 3,741 | 2,539 | 3,229 |
| 1981 | 9,334 | 3,576 | 2,732 | 3,026 |
| 1986 | 9,859 | 4,103 | 2,757 | 2,999 |
| 1991 | 10,181 | 4,331 | 2,898 | 2,952 |
| 1996 | 9,857 | 4,374 | 2,712 | 2,771 |
| 2001 | 10,348 | 4,760 | 2,975 | 2,613 |
| 2006 | 10,399 | 4,873 | 2,951 | 2,575 |
| 2011[4] | 10,628 | 4,821 | 3,221 | 2,586 |
References
- ↑ Australian Bureau of Statistics (31 March 2011). "Regional Population Growth, Australia, 2009–10". Retrieved 11 June 2011.
- ↑ Election summary (ECQ)
- ↑ Queensland Local Government Reform Commission (July 2007). Report of the Local Government Reform Commission (PDF) 2. pp. 146–150. ISBN 1-921057-11-4. Retrieved 3 June 2010.
- ↑ ABS, Census. "Census".
| ||||||||||||||||||||||
| ||||||||||||||||||||||||||||||||||||||
Coordinates: 28°32′49.7″S 150°18′25.74″E / 28.547139°S 150.3071500°E
