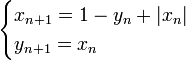
Gingerbreadman map
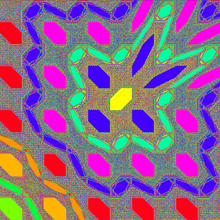
Gingerbreadman map for subset ![Q^2, [-10..10,-10..10]](../I/m/46d5567b0d2e486c53bf9703565174bc.png) :
the color of each point is related to the relative orbit period.
To view the gingerbread man, you must rotate the image 135 degrees clockwise.
:
the color of each point is related to the relative orbit period.
To view the gingerbread man, you must rotate the image 135 degrees clockwise.
:
the color of each point is related to the relative orbit period.
To view the gingerbread man, you must rotate the image 135 degrees clockwise.In dynamical systems theory, the Gingerbreadman map is a chaotic 2D map. It is given by the transformation: