Galician parliamentary election, 1985
Galician parliamentary election, 1985

|
|
|
|
All 71 seats in the Parliament of Galicia
38 seats needed for a majority |
| Turnout |
1,277,897 (57.4%)
 11.1 pp 11.1 pp |
| |
First party |
Second party |
Third party |
| |
 |
 |
 |
| Leader |
Xerardo Fernández Albor |
Fernando González Laxe |
Pablo González Mariñas |
| Party |
CP |
PSdeG |
Galician Coalition |
| Leader's seat |
Pontevedra |
Ourense |
Ourense |
| Last election |
26 seats, 30.5% |
16 seats, 19.6% |
new |
| Seats won |
34 |
22 |
11 |
| Seat change |
 8 8 |
 6 6 |
 11 11 |
| Popular vote |
516,218 |
361,946 |
163,425 |
| Percentage |
40.9 |
28.7% |
12.9% |
| Swing |
 10.4 pp 10.4 pp |
 9.1 pp 9.1 pp |
 12.9 pp 12.9 pp |
|
| |
Fourth party |
Fifth party |
|
| |
-4.jpg) |
 |
|
| Leader |
Camilo Nogueira |
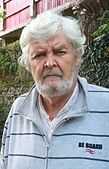
Xosé Manuel Beiras |
|
| Party |
PSG-EG |
BNG |
|
| Leader's seat |
A Coruña |
A Coruña |
|
| Last election |
1 seats, 3.4% |
3 seats, 6.3 |
|
| Seats won |
3 |
|
|
| Seat change |
 2 2 |
 2 2 |
|
| Popular vote |
71,599 |
53,072 |
|
| Percentage |
5.7% |
4.2% |
|
| Swing |
 2.3 pp 2.3 pp |
 2.1 pp 2.1 pp |
|
|
|
Parliamentary elections were held in Galicia on 24 December 1985. The result was a victory for the People's Alliance , which won 34 of the 75 seats in the Parliament of Galicia. Xerardo Fernández Albor was elected President of the Xunta with the votes of AP and Galician Coalition.
Results
Overall
← Summary of the 24 December 1985 Galician Parliament election results →
|
| Party |
Vote |
Seats |
| Votes |
% |
±pp |
Won |
+/− |
|
People's Coalition (CP) |
516,218 | 40.89 |  10.37 10.37 |
34 |  8 8 |
|
Socialist Party of Galicia (PSdeG-PSOE) |
361,946 | 28.67 |  9.05 9.05 |
22 |  6 6 |
|
Galician Coalition (CG) |
163,425 | 12.94 | New |
11 |  11 11 |
|
Galician Socialist Party-Galician Left (PSG-EG) |
71,599 | 5.67 |  2.27 2.27 |
3 |  2 2 |
|
Galician Nationalist Bloc (BNG) |
53,072 | 4.20 |  2.07 2.07 |
1 |  2 2 |
|
Democratic and Social Centre (CDS) |
41,411 | 3.28 | New |
0 | ±0 |
|
Communist Party of Galicia (PCG-PCE) |
10,625 | 0.84 |  2.09 2.09 |
0 |  1 1 |
|
Workers' Socialist Party (PST) |
9,689 | 0.77 |  1.08 1.08 |
0 | ±0 |
|
Workers’ Party of Spain – Communist Unity (PCG-MR) |
8,318 | 0.66 | New |
0 | ±0 |
|
Humanist Party (PH) |
7,280 | 0.58 | New |
0 | ±0 |
|
Galician Rural Party (PGC) |
3,172 | 0.25 | New |
0 | ±0 |
|
Spanish Falange of the JONS (FE-JONS) |
2,922 | 0.23 |  0.08 0.08 |
0 | ±0 |
|
Communist Party of Spain (Marxist–Leninist) (PCE (m-l)) |
1,554 | 0.12 | ±0.00 |
0 | ±0 |
|
Galician Socialist Unity (USG) |
1,379 | 0.11 | New |
0 | ±0 |
|
Communist Movement (MCG) |
1,327 | 0.11 |  0.38 0.38 |
0 | ±0 |
|
Blank ballots |
8,627 | 0.68 |  0.68 0.68 |
|
| |
| Total |
1,262,564 | 100.00 | |
71 | ±0 |
| |
| Valid votes |
1,262,564 | 98.80 |  0.79 0.79 |
|
| Invalid votes |
15,333 | 1.20 |  0.79 0.79 |
| Votes cast / turnout |
1,277,897 | 57.40 |  11.12 11.12 |
| Abstentions |
948,552 | 42.60 |  11.12 11.12 |
| Registered voters |
2,226,449 | |
| |
| Source: Argos Information Portal |
| Vote share |
|---|
|
|
|
|
|
| CP |
|
40.89% |
| PSdeG-PSOE |
|
28.67% |
| CG |
|
12.94% |
| PSG-EG |
|
5.67% |
| BNG |
|
4.20% |
| CDS |
|
3.28% |
| PCG-PCE |
|
0.84% |
| PST |
|
0.77% |
| Others |
|
2.06% |
| Blank ballots |
|
0.68% |
| Parliamentary seats |
|---|
|
|
|
|
|
| CP |
|
47.89% |
| PSdeG-PSOE |
|
30.99% |
| CG |
|
15.49% |
| PSG-EG |
|
4.23% |
| BNG |
|
1.41% |
Notes
External links
- Results Electoral History (Spanish)

-4.jpg)
