GGobi
| Developer | Deborah Swayne, Michael Lawrence, Hadley Wickham, Duncan Temple Lang, Di Cook, Heike Hofmann and Andreas Buja |
|---|---|
| 2.1.8 / August 12, 2008 | |
| OS | Windows, Macintosh, Linux |
| License | GNU GPL, BSD, CPL[1] |
| Website | http://www.ggobi.org/ |
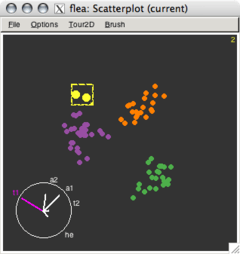
GGobi is a free statistical software tool used for graphing various types of data. GGobi allows extensive exploration of the data with Interactive dynamic graphics. It is also a tool for looking at multivariate data. R can be used in sync with GGobi (through rggobi). GGobi prides itself on its ability to link multiple graphs together.[2]
Overview
GGobi was created to look at data matrices. The designers were interested in exploring multi-dimensional data. The program developers went through many name changes before settling on GGobi (A combination of the words GTK+ and the Gobi Desert). The original concept, Dataviewer, began in the mid-80s, and a predecessor, XGobi, began in 1989. Work began on the current version of GGobi in 1999. The main reason for the different versions was the change in technology.[3]
Released under a combination of three free software licenses, GGobi is free software.[1]
GGobi Topics


Importance of graphics
Looking at data through various graphs can reveal more information about the distribution than just looking at the numbers or a summary of them. Using the different tools within GGobi, clusters, non-linear distributions, outliers, and other important variations in the data can be discovered. GGobi is a program which allows exploratory data analysis to occur for multi-dimensional data.
Supported data sources
GGobi can read CSV and XML file types.[4]
Types of graphics
- 1D: Average shifted histogram, textured dot plot, barchart, spineplot
- 2D: Scatterplot
- High-D:
- Scatterplot matrix
- Parallel coordinates
- Grand tour, projection pursuit guided tour, manual tour
- Time series plot
Interactions
These tools can be used to pick out special points or clusters of data.
- As the brush moves over a point, the point will be highlighted.
- If "persistent" is selected, the points the brush has moved over will remain "painted".
- Identify
- As the cursor moves over a point, a label, or variable value will appear at the top of the graphic screen.
- Linking
- Multiple plots are linked so identifying one point in one plot will identify the same point on all other graphs, and brushing a group of points in one plot will highlight the same points in other plots. The linking can be one-to-one, or according to the values of a categorical variable in the data set.
- Moving points
- Points in a plot can be moved interactively, e.g. to gauge results from multidimensional scaling.
- Add/remove points or edges.
See also
- Data visualization
- Mondrian data analysis
References
- ↑ 1.0 1.1 "GGobi licences page".
- ↑ XGobi is listed on Michael Friendly's Milestones of Statistical Graphics webpage.
- ↑ The history of GGobi
- ↑ XML - XML format for ggobi
Further reading
- Buja, A., D. Cook, and D.F. Swayne (March 1998). "XGobi: Interactive Dynamic Data Visualization in the X Window System". in: Journal of Computational and Graphical Statistics 7 (1): 113–130.
- Buja, A., D.T. Lang, and D.F. Swayne (August 28, 2003). "GGobi: Evolving From XGobi into an Extensible Framework for Interactive Data Visualization". In: Journal of Computational Statistics and Data Analysis 43 (4): 423–444.
- Cook, D. and D.F. Swayne (2007). Interactive and Dynamic Graphics for Data Analysis. Springer.
External links
- GGobi Data Visualization System
- rggobi is an R package that interfaces R and GGobi.
- GGobi blog