Fulham (UK Parliament constituency)
| Fulham | |
|---|---|
|
Former Borough constituency for the House of Commons | |
| 1885–1918 | |
| Number of members | One |
| Replaced by | Fulham East and Fulham West |
| Created from | Chelsea |
| 1955–1997 | |
| Replaced by | Hammersmith and Fulham |
| Created from | Fulham East and Fulham West |
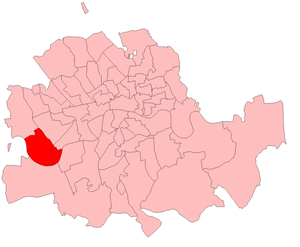
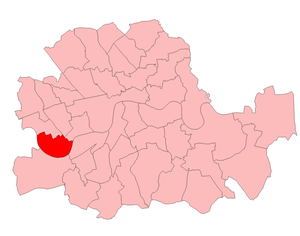
Fulham was a borough constituency centred on the London district of Fulham. It was represented in the House of Commons of the Parliament of the United Kingdom from 1885 until 1918 and from 1955 to 1997.
Between 1918 and 1955 it was divided into two constituencies, Fulham East and Fulham West. At the 1997 general election it was replaced by Hammersmith and Fulham.
Boundaries
1955-1974: The Metropolitan Borough of Fulham wards of Hurlingham, Munster, Sands End, Town, and Walham.
1974-1983: The London Borough of Hammersmith wards of Avonmore, Colehill, Crabtree, Gibbs Green, Helford, Margravine, Parsons Green, Sandford, Sherbrooke, Sulivan, and Town.
1983-1997: The London Borough of Hammersmith wards of Avonmore, Colehill, Crabtree, Eel Brook, Gibbs Green, Margravine, Normand, Palace, Sands End, Sherbrooke, Sulivan, Town, and Walham.
Members of Parliament
MPs 1885-1918
| Election | Member | Party | |
|---|---|---|---|
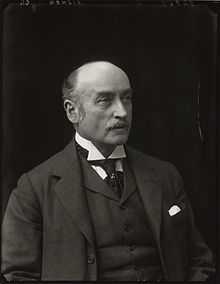
| 1885 | William Hayes Fisher | Conservative | |
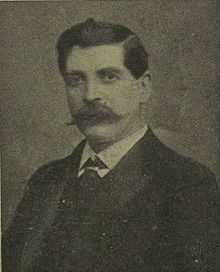
| 1906 | Timothy Davies | Liberal | |
| 1910 | William Hayes Fisher | Conservative | |
| 1918 | constituency abolished: see Fulham East and Fulham West | ||
MPs 1955-1997
| Election | Member | Party | |
|---|---|---|---|
| 1955 | Michael Stewart, later Baron Stewart of Fulham | Labour | |
| 1979 | Martin Stevens | Conservative | |
| 1986 by-election | Nick Raynsford | Labour | |
| 1987 | Matthew Carrington | Conservative | |
| 1997 | constituency abolished: see Hammersmith & Fulham | ||
Elections
Elections in the 1880s
| 1885 General Election: Fulham | |||||
|---|---|---|---|---|---|
| Party | Candidate | Votes | % | ±% | |
| Conservative | William Hayes Fisher | 2,642 | 50.5 | ||
| Liberal | George William Erskine Russell | 2,590 | 49.5 | ||
| Majority | 52 | ||||
| Turnout | 6,499 | 80.5 | |||
| Conservative gain from new seat | Swing | ||||

| 1886 General Election: Fulham | |||||
|---|---|---|---|---|---|
| Party | Candidate | Votes | % | ±% | |
| Conservative | William Hayes Fisher | 2,557 | 53.2 | 2.7 | |
| Liberal | George William Erskine Russell | 2,247 | 46.8 | -2.7 | |
| Majority | 310 | ||||
| Turnout | 6,499 | 73.9 | |||
| Conservative hold | Swing | ||||
Elections in the 1890s
| 1892 General Election: Fulham | |||||
|---|---|---|---|---|---|
| Party | Candidate | Votes | % | ±% | |
| Conservative | William Hayes Fisher | 4,365 | 51.2 | -2.0 | |
| Liberal | W.D. Barnett | 4,154 | 48.8 | 2.0 | |
| Majority | 211 | ||||
| Turnout | 11,266 | 75.6 | |||
| Conservative hold | Swing | ||||

| 1895 General Election: Fulham | |||||
|---|---|---|---|---|---|
| Party | Candidate | Votes | % | ±% | |
| Conservative | William Hayes Fisher | 5,378 | 56.7 | 5.5 | |
| Liberal | Edwin Andrew Cornwall | 3,915 | 41.3 | -7.5 | |
| Ind. Labour Party | William Parnell | 191 | 2.0 | n/a | |
| Majority | 1,463 | ||||
| Turnout | 12,716 | 74.6 | |||
| Conservative hold | Swing | ||||
Elections in the 1900s
| 1900 General Election: Fulham | |||||
|---|---|---|---|---|---|
| Party | Candidate | Votes | % | ±% | |
| Conservative | William Hayes Fisher | 6,541 | 60.6 | 3.9 | |
| Liberal | Edwin Andrew Cornwall | 4,247 | 39.4 | -1.9 | |
| Majority | 2,294 | ||||
| Turnout | 16,600 | 65.0 | |||
| Conservative hold | Swing | ||||
| 1906 General Election: Fulham | |||||
|---|---|---|---|---|---|
| Party | Candidate | Votes | % | ±% | |
| Liberal | Timothy Davies | 8,037 | 52.0 | 12.6 | |
| Conservative | William Hayes Fisher | 7,407 | 48.0 | -12.6 | |
| Majority | 630 | ||||
| Turnout | 20,620 | 74.9 | |||
| Liberal gain from Conservative | Swing | ||||
Elections in the 1910s
| January 1910 General Election: Fulham | |||||
|---|---|---|---|---|---|
| Party | Candidate | Votes | % | ±% | |
| Conservative | William Hayes Fisher | 9,690 | 55.5 | 7.5 | |
| Liberal | Hon. Fitzroy Hemphill | 7,761 | 44.5 | -7.5 | |
| Majority | 1,929 | 11.0 | |||
| Turnout | 21,009 | 83.1 | |||
| Conservative gain from Liberal | Swing | ||||
| December 1910 General Election: Fulham | |||||
|---|---|---|---|---|---|
| Party | Candidate | Votes | % | ±% | |
| Conservative | William Hayes Fisher | 8,252 | 55.8 | 0.3 | |
| Liberal | Sylvain Mayer | 6,526 | 44.2 | -0.3 | |
| Majority | 1,726 | 11.6 | |||
| Turnout | 21,009 | 70.3 | |||
| Conservative hold | Swing | ||||
| Fulham by-election, 1917 | |||||
|---|---|---|---|---|---|
| Party | Candidate | Votes | % | ±% | |
| Conservative | William Hayes Fisher | unopposed | n/a | n/a | |
| Conservative hold | Swing | n/a | |||
Elections in the 1990s
| General Election 1992: Fulham[1] | |||||
|---|---|---|---|---|---|
| Party | Candidate | Votes | % | ±% | |
| Conservative | Matthew Carrington | 21,438 | 53.4 | +1.6 | |
| Labour | NP Moore | 14,859 | 37.0 | +0.3 | |
| Liberal Democrat | PM Crystal | 3,339 | 8.3 | -2.1 | |
| Green | Mrs EGA Streeter | 443 | 1.1 | 0.0 | |
| Natural Law | JV Darby | 91 | 0.2 | +0.2 | |
| Majority | 6,579 | 16.4 | +1.3 | ||
| Turnout | 40,170 | 75.9 | -1.2 | ||
| Conservative hold | Swing | +0.7 | |||
References
- ↑ "Politics Resources". Election 1992. Politics Resources. 9 April 1992. Retrieved 6 Dec 2010.
- Leigh Rayment's Historical List of MPs – Constituencies beginning with "F"
- British Parliamentary Election Results 1885-1918, compiled and edited by F.W.S. Craig (Macmillan Press 1974)
- Debrett’s Illustrated Heraldic and Biographical House of Commons and the Judicial Bench 1886
- Debrett’s House of Commons and the Judicial Bench 1901
- Debrett’s House of Commons and the Judicial Bench 1918