Finnish parliamentary election, 2015

|
|
|
|
All 200 seats to the Parliament
101 seats needed for a majority |
| Turnout |
70.1% |
| |
First party |
Second party |
Third party |
| |
 |
 |
 |
| Leader |
Juha Sipilä |
Timo Soini |
Alexander Stubb |
| Party |
Centre |
Finns |
National Coalition |
| Leader since |
2012 |
1997 |
2014 |
| Last election |
35 seats, 15.8% |
39 seats, 19.1% |
44 seats, 20.4% |
| Seats won |
49 |
38 |
37 |
| Seat change |
 14 14 |
 1 1 |
7 |
| Popular vote |
626,218 |
524,054 |
540,212 |
| Percentage |
21.1% |
17.7% |
18.2% |
| Swing |
5.3% |
1.4% |
2.2% |
|
| |
Fourth party |
Fifth party |
Sixth party |
| |
 |
 |
 |
| Leader |
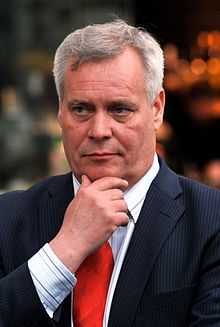
Antti Rinne |
Ville Niinistö |
Paavo Arhinmäki |
| Party |
Social Democratic |
Green League |
Left Alliance |
| Leader since |
2014 |
2011 |
2009 |
| Last election |
42 seats, 19.1% |
10 seats, 7.3% |
14 seats, 8.1% |
| Seats won |
34 |
15 |
12 |
| Seat change |
8 |
5 |
2 |
| Popular vote |
490,102 |
253,102 |
211,702 |
| Percentage |
16.5% |
8.5% |
7.1% |
| Swing |
2.6% |
1.3% |
1.0% |
|
| |
Seventh party |
Eighth party |
|
| |
 |
 |
|
| Leader |
Carl Haglund |
Päivi Räsänen |
|
| Party |
Swedish People's |
Christian Democrat |
|
| Leader since |
2012 |
2004 |
|
| Last election |
9 seats, 4.3% |
6 seats, 4.0% |
|
| Seats won |
9 |
5 |
|
| Seat change |
 0 0 |
1 |
|
| Popular vote |
144,802 |
105,134 |
|
| Percentage |
4.9% |
3.5% |
|
| Swing |
0.6% |
0.5% |
|
|
|
The 2015 Finnish parliamentary election was held on 19 April 2015,[1] with advance voting from 8 to 14 April.[2] The 200 members of the Finnish Parliament were elected with the proportional D'Hondt method.
There were 4,463,333 people entitled to vote in Finland and abroad.[3]
Background
Previous government parties
The incumbent government was formed by a four party coalition, composed of the National Coalition Party, Social Democratic Party, Swedish People's Party and the Christian Democrats as well as the MP for Åland. Left Alliance and the Green League were initially also part of the governing coalition, but both left in 2014.
On 22 June 2011, the parliament elected Jyrki Katainen as prime minister by a vote of 118–72; two Left Alliance MPs voted against Katainen, for which they were formally reprimanded by the Left Alliance parliamentary group. They were subsequently expelled from the group, reducing the government majority from 126 MPs to 124. In March 2014 the Left Alliance announced that it was leaving the cabinet, citing the party's opposition to budget cuts in social welfare programs, which had been agreed to by the other five parties.[4] This reduced the government's majority to 112 MPs.
In April 2014 Jyrki Katainen announced that he would not seek another term as the chairman of the National Coalition Party. The NCP chose Alexander Stubb as its new chairman in June, and he subsequently became the new Prime Minister. In September 2014 the Green League announced that it was leaving the cabinet. The Greens were opposed to the other governing parties' decision to grant Fennovoima a licence for building a nuclear power plant in Pyhäjoki.[5] The Greens' departure cut the government's majority to 102 MPs (including the Speaker of the Parliament, who does not vote).[6]
Changes to the electoral districts

Electoral districts in the 2015 election
In 2013 the parliament decided to merge certain electoral districts to create larger districts: the electoral districts of Northern Savonia and North Karelia have been merged into a new district called Savonia-Karelia, while the electoral districts of Kymi and Southern Savonia have been merged into a new district called South-Eastern Finland.[7]
Opinion polling

Taloustutkimus opinion polling since 2011 election.
Poll results are listed in the table below in reverse chronological order, showing the most recent first. The highest percentage figure in each poll is displayed in bold, and the background shaded in the leading party's colour. In the instance that there is a tie, then no figure is shaded. The table uses the date the survey's fieldwork was done, as opposed to the date of publication. However, if that date is unknown, the date of publication will be given instead.
| Date |
Polling Firm |
KOK |
SDP |
PS |
KESK |
VAS |
VIHR |
SFP |
KD |
Others |
Lead |
|
|
|
|
|
|
|
|
| 23 Mar–15 Apr |
Taloustutkimus |
16.9 |
15.1 |
16.7 |
24.0 |
8.3 |
8.8 |
4.6 |
3.5 |
2.0 |
7.1 |
| 8 Apr–12 Apr |
TNS Gallup |
17.0 |
17.0 |
16.2 |
23.0 |
8.5 |
8.1 |
4.6 |
3.7 |
1.9 |
6.0 |
| 27 Mar–1 Apr |
Tietoykkönen |
16.2 |
17.0 |
16.6 |
23.5 |
8.4 |
8.1 |
4.3 |
4.1 |
1.8 |
6.5 |
| 25 Feb–19 Mar |
Taloustutkimus |
16.1 |
16.2 |
14.6 |
24.9 |
8.5 |
8.9 |
4.5 |
3.9 |
2.4 |
8.7 |
| 16 Feb–12 Mar |
TNS Gallup |
16.8 |
16.9 |
15.2 |
24.7 |
8.4 |
8.6 |
4.2 |
3.3 |
1.9 |
7.8 |
| 5–11 Mar |
Tietoykkönen |
17.3 |
16.4 |
16.8 |
23.5 |
8.3 |
8.2 |
4.1 |
3.6 |
1.7 |
6.2 |
| 2–24 Feb |
Taloustutkimus |
16.2 |
16.8 |
15.4 |
24.9 |
8.8 |
8.8 |
4.0 |
3.3 |
1.8 |
8.1 |
| 19 Jan–12 Feb |
TNS Gallup |
16.9 |
17.1 |
14.1 |
26.2 |
8.5 |
8.3 |
4.2 |
3.2 |
1.5 |
9.3 |
| 28 Jan-3 Feb |
Tietoykkönen |
17.8 |
16.5 |
15.3 |
25.4 |
8.2 |
7.8 |
4.0 |
3.6 |
1.4 |
7.6 |
| 29 Dec–27 Jan |
Taloustutkimus |
16.3 |
17.2 |
14.8 |
26.0 |
8.2 |
8.3 |
4.2 |
3.5 |
1.5 |
8.8 |
| 15 Dec–15 Jan |
TNS Gallup |
17.2 |
16.5 |
14.5 |
25.9 |
8.8 |
8.4 |
4.1 |
3.3 |
1.3 |
8.7 |
| 2014 |
| 3–27 Dec |
Taloustutkimus |
17.1 |
15.3 |
13.3 |
26.8 |
8.9 |
9.4 |
3.7 |
3.9 |
1.7 |
9.7 |
| 17 Nov-12 Dec |
TNS Gallup |
16.7 |
16.9 |
14.2 |
26.1 |
8.1 |
8.9 |
4.2 |
3.5 |
1.4 |
9.2 |
| 3 Nov-2 Dec |
Taloustutkimus |
17.3 |
16.1 |
14.3 |
26.7 |
8.9 |
8.3 |
4.0 |
3.3 |
1.1 |
9.4 |
| 23 Nov-26 Nov |
Tietoykkönen |
17.7 |
15.8 |
15.7 |
26.6 |
8.4 |
8.1 |
3.1 |
2.9 |
1.7 |
8.9 |
| 21 Nov |
TNS Gallup |
17.4 |
16.4 |
16.2 |
24.5 |
8.0 |
8.3 |
4.3 |
3.6 |
1.3 |
7.1 |
| 30 Sep-28 Oct |
Taloustutkimus |
19.4 |
15.2 |
15.1 |
25.5 |
7.9 |
9.1 |
3.6 |
2.7 |
1.5 |
6.1 |
| 22 Sep-16 Oct |
TNS Gallup |
19.4 |
16.2 |
16.1 |
22.3 |
8.7 |
8.2 |
4.2 |
3.6 |
1.3 |
2.9 |
| 10 Oct-16 Oct |
Tietoykkönen |
18.5 |
15.1 |
16.5 |
23.4 |
8.0 |
8.9 |
4.2 |
3.8 |
1.6 |
4.9 |
| 2 Sep-25 Sep |
Taloustutkimus |
20.4 |
15.2 |
16.6 |
23.3 |
8.3 |
7.8 |
4.6 |
3.0 |
0.8 |
2.9 |
| 21 Aug-26 Aug |
Tietoykkönen |
20.8 |
14.7 |
16.0 |
21.3 |
9.9 |
8.4 |
4.1 |
3.1 |
1.7 |
0.5 |
| 5 Aug-28 Aug |
Taloustutkimus |
21.2 |
15.8 |
17.1 |
21.3 |
8.2 |
8.1 |
3.7 |
3.4 |
1.2 |
0.1 |
| 15 Jul–12 Aug |
TNS Gallup |
22.1 |
14.9 |
15.9 |
19.9 |
9.3 |
8.7 |
4.5 |
3.4 |
1.3 |
2.2 |
| 1 Jul-30 Jul |
Taloustutkimus |
21.8 |
13.8 |
16.4 |
20.9 |
9.3 |
8.8 |
3.9 |
3.4 |
1.7 |
0.9 |
| 2 Jun–25 Jun |
Taloustutkimus |
20.3 |
14.8 |
17.9 |
19.5 |
9.3 |
9.0 |
4.2 |
3.8 |
1.2 |
0.8 |
| 26 May–11 Jun |
TNS Gallup |
20.5 |
14.9 |
17.2 |
20.3 |
9.0 |
8.5 |
4.4 |
3.9 |
1.3 |
0.2 |
| 5–27 May |
Taloustutkimus |
20.1 |
15.0 |
18.9 |
19.5 |
8.5 |
9.3 |
4.4 |
3.2 |
1.1 |
0.6 |
| 2–29 Apr |
Taloustutkimus |
20.2 |
15.8 |
17.6 |
21.0 |
8.8 |
8.2 |
4.1 |
3.7 |
0.6 |
0.8 |
| 5 Mar–1 Apr |
Taloustutkimus |
20.3 |
15.5 |
17.8 |
20.9 |
7.7 |
8.7 |
4.3 |
3.5 |
1.3 |
0.6 |
| 25 Feb–22 Mar |
TNS Gallup |
19.5 |
16.3 |
17.2 |
21.5 |
7.5 |
8.9 |
4.3 |
3.5 |
1.3 |
2.0 |
| 3 Feb–4 Mar |
Taloustutkimus |
19.4 |
15.5 |
16.9 |
22.8 |
7.7 |
9.0 |
4.2 |
3.4 |
1.1 |
3.4 |
| 13 Jan–8 Feb |
TNS Gallup |
19.2 |
16.2 |
17.0 |
22.4 |
7.6 |
8.5 |
4.2 |
3.5 |
1.4 |
3.2 |
| 1–28 Jan |
Taloustutkimus |
18.7 |
15.5 |
17.8 |
23.6 |
7.5 |
8.1 |
3.8 |
3.7 |
1.3 |
4.9 |
| 2013 |
| 27 Nov–23 Dec |
Taloustutkimus |
19.1 |
15.9 |
17.4 |
23.9 |
7.0 |
8.2 |
3.8 |
3.1 |
1.6 |
4.8 |
| 19 Dec |
TNS Gallup |
18.0 |
16.7 |
17.5 |
23.0 |
7.9 |
7.9 |
4.4 |
3.3 |
1.3 |
5.0 |
| 30 Oct–26 Nov |
Taloustutkimus |
18.3 |
15.4 |
17.2 |
24.1 |
7.4 |
9.0 |
4.1 |
3.2 |
1.3 |
5.8 |
| 7–29 Oct |
Taloustutkimus |
18.1 |
16.9 |
17.4 |
23.2 |
7.6 |
8.4 |
3.9 |
3.5 |
1.0 |
5.1 |
| 23 Oct |
TNS Gallup |
18.2 |
16.2 |
18.9 |
21.8 |
7.7 |
8.3 |
4.4 |
3.4 |
1.1 |
2.9 |
| 9 Sep–2 Oct |
Taloustutkimus |
18.4 |
15.3 |
18.8 |
22.6 |
7.2 |
9.3 |
3.9 |
3.3 |
1.2 |
3.8 |
| 6 Aug–4 Sep |
Taloustutkimus |
18.3 |
15.0 |
19.3 |
23.8 |
7.7 |
8.4 |
3.8 |
2.8 |
0.9 |
4.5 |
| 15 Aug |
TNS Gallup |
18.7 |
16.3 |
18.7 |
21.9 |
7.3 |
8.2 |
4.2 |
3.5 |
1.2 |
3.2 |
| 2–31 Jul |
Taloustutkimus |
18.8 |
15.6 |
18.0 |
22.8 |
7.2 |
8.4 |
4.4 |
3.6 |
1.2 |
4.0 |
| 29 May–26 Jun |
Taloustutkimus |
18.4 |
16.1 |
18.6 |
21.5 |
7.5 |
9.3 |
4.0 |
3.5 |
1.1 |
2.9 |
| 29 Apr–28 May |
Taloustutkimus |
19.2 |
16.5 |
17.4 |
21.7 |
8.0 |
8.0 |
4.1 |
3.8 |
1.3 |
2.5 |
| 4–25 Apr |
Taloustutkimus |
19.2 |
16.2 |
18.6 |
19.4 |
9.0 |
9.1 |
4.2 |
3.2 |
1.1 |
0.2 |
| 11–27 Mar |
Taloustutkimus |
19.8 |
18.0 |
18.4 |
18.3 |
8.5 |
9.0 |
4.1 |
3.1 |
0.8 |
1.4 |
| 11 Feb–7 Mar |
Taloustutkimus |
20.8 |
18.2 |
18.1 |
17.2 |
8.2 |
8.7 |
4.3 |
3.2 |
1.3 |
2.6 |
| 7–29 Jan |
Taloustutkimus |
21.9 |
18.7 |
17.7 |
17.1 |
7.9 |
8.9 |
3.9 |
3.1 |
0.8 |
3.2 |
| 2012 |
| 3–27 Dec |
Taloustutkimus |
21.0 |
17.9 |
18.0 |
17.8 |
7.9 |
8.7 |
4.3 |
3.4 |
1.0 |
3.0 |
| 1–24 Oct |
Taloustutkimus |
20.9 |
18.5 |
15.3 |
17.3 |
8.5 |
9.1 |
3.9 |
4.0 |
2.5 |
2.4 |
| 3–19 Sep |
Taloustutkimus |
21.5 |
19.9 |
17.2 |
15.9 |
7.8 |
8.9 |
4.3 |
3.2 |
1.3 |
1.6 |
| 7–29 Aug |
Taloustutkimus |
22.7 |
18.7 |
15.8 |
16.6 |
8.2 |
9.4 |
4.3 |
3.2 |
1.1 |
4.0 |
| 3 Jul–1 Aug |
Taloustutkimus |
20.8 |
20.3 |
17.5 |
15.5 |
8.0 |
8.5 |
4.4 |
3.7 |
1.3 |
0.5 |
| 4–27 Jun |
Taloustutkimus |
21.6 |
20.8 |
15.6 |
16.5 |
7.5 |
8.2 |
3.9 |
3.7 |
2.2 |
0.8 |
| 7–31 May |
Taloustutkimus |
21.7 |
20.5 |
15.9 |
16.7 |
7.7 |
8.8 |
3.7 |
3.6 |
1.4 |
1.2 |
| 3–26 Apr |
Taloustutkimus |
22.6 |
19.1 |
14.1 |
16.4 |
8.9 |
10.4 |
3.7 |
3.2 |
1.6 |
3.5 |
| 5–29 Mar |
Taloustutkimus |
22.6 |
17.3 |
15.8 |
16.7 |
8.1 |
11.0 |
3.5 |
3.7 |
1.3 |
5.3 |
| 30 Jan–23 Feb |
Taloustutkimus |
22.1 |
16.0 |
16.1 |
17.7 |
7.9 |
11.4 |
4.1 |
3.5 |
1.3 |
4.4 |
| 2–26 Jan |
Taloustutkimus |
23.1 |
16.3 |
17.4 |
15.6 |
9.0 |
9.6 |
3.8 |
4.1 |
1.1 |
5.8 |
| 2011 |
| 7–28 Dec |
Taloustutkimus |
22.7 |
16.4 |
19.9 |
16.2 |
8.5 |
7.6 |
3.9 |
3.6 |
1.2 |
2.8 |
| 9–17 Nov |
Taloustutkimus |
24.3 |
17.6 |
19.9 |
13.9 |
7.0 |
7.9 |
4.1 |
3.9 |
1.4 |
4.4 |
| 10 Oct–3 Nov |
Taloustutkimus |
24.4 |
17.1 |
21.4 |
13.1 |
7.4 |
7.7 |
4.1 |
3.7 |
1.1 |
3.0 |
| 15 Aug–13 Sep |
Taloustutkimus |
23.7 |
18.6 |
21.1 |
12.6 |
8.0 |
7.4 |
3.8 |
3.6 |
1.3 |
2.6 |
| 5 Jul–10 Aug |
Taloustutkimus |
21.4 |
19.8 |
22.0 |
13.2 |
7.6 |
7.4 |
3.9 |
3.4 |
1.3 |
0.6 |
| 6–29 Jun |
Taloustutkimus |
21.1 |
18.1 |
23.0 |
13.8 |
8.0 |
7.2 |
4.1 |
3.1 |
1.6 |
1.9 |
| 9–31 May |
Taloustutkimus |
21.5 |
18.8 |
20.6 |
14.3 |
7.7 |
7.6 |
4.3 |
3.8 |
1.4 |
0.9 |
| 17 Apr 2011 |
Election Results |
20.4 |
19.1 |
19.1 |
15.8 |
8.1 |
7.3 |
4.3 |
4.0 |
2.3 |
1.3 |
Seats
Opinion polls showing seat projections are displayed in the table below. The highest seat figures in each polling survey have their background shaded in the leading party's colour. In the instance that there is a tie, then no figure is shaded. 101 seats are required for an absolute majority in the Finnish Parliament.
Results
| Party |
Votes |
% |
Seats |
+/– |
|---|
| Centre Party | 626,218 | 21.10 | 49 | +14 |
| Finns Party | 524,054 | 17.65 | 38 | –1 |
| National Coalition Party | 540,212 | 18.20 | 37 | –7 |
| Social Democratic Party | 490,102 | 16.51 | 34 | –8 |
| Green League | 253,102 | 8.53 | 15 | +5 |
| Left Alliance | 211,702 | 7.13 | 12 | –2 |
| Swedish People's Party of Finland | 144,802 | 4.88 | 9 | 0 |
| Christian Democrats | 105,134 | 3.54 | 5 | –1 |
| Åland Coalition | 10,910 | 0.37 | 1 | 0 |
| Pirate Party | 25,086 | 0.85 | 0 | 0 |
| Independence Party | 13,638 | 0.46 | 0 | 0 |
| Communist Party | 7,529 | 0.25 | 0 | 0 |
| Change 2011 | 7,442 | 0.25 | 0 | 0 |
| Pirkanmaa Joint List | 2,469 | 0.08 | 0 | New |
| Liberals for Åland | 1,277 | 0.04 | 0 | 0 |
| Communist Workers' Party – For Peace and Socialism | 1,100 | 0.04 | 0 | 0 |
| Workers Party | 984 | 0.03 | 0 | 0 |
| For the Poor | 623 | 0.02 | 0 | 0 |
| Independents | 2,075 | 0.07 | 0 | 0 |
| Total | 2,968,459 | 100 | 200 | 0 |
|
| Valid votes | 2,968,459 | 99.48 | |
| Invalid/blank votes | 15,397 | 0.52 |
| Total votes cast | 2,983,856 | 100 |
| Registered voters in Finland/turnout in Finland | 4,221,237 | 70.1 |
| Registered voters overall/turnout overall | 4,463,333 | 66.9 |
| Source: Ministry of Justice, YLE |
Notes
- ↑ Counted by ScenariPolitici, but based on various polls by different polling firms. Åland's MP is the other.
- ↑ Counted by Accuscore, but based on various polls by different polling firms. Åland's MP is the other.
- ↑ Not a single poll, but based on five separate Taloustutkimus polls. Åland's MP is the other.
References
External links
 Media related to Parliamentary elections in Finland, 2015 at Wikimedia Commons