F1 score
In statistical analysis of binary classification, the F1 score (also F-score or F-measure) is a measure of a test's accuracy. It considers both the precision p and the recall r of the test to compute the score: p is the number of correct positive results divided by the number of all positive results, and r is the number of correct positive results divided by the number of positive results that should have been returned. The F1 score can be interpreted as a weighted average of the precision and recall, where an F1 score reaches its best value at 1 and worst score at 0.
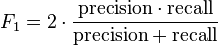
The traditional F-measure or balanced F-score (F1 score) is the harmonic mean of precision and recall:
 .
.
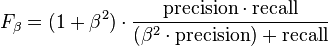
The general formula for positive real β is:
 .
.
The formula in terms of Type I and type II errors:
 .
.
Two other commonly used F measures are the  measure, which weights recall higher than precision, and the
  measure, which puts more emphasis on precision than recall.
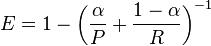
The F-measure was derived so that  "measures the effectiveness of retrieval with respect to a user who attaches β times as much importance to recall as precision".[1] It is based on Van Rijsbergen's effectiveness measure
 .
.
Their relationship is  where
where  .
.
Diagnostic Testing
This is related to the field of binary classification where recall is often termed as Sensitivity. There are several reasons that the F1 score can be criticized in particular circumstances.[2]
| Condition (as determined by "Gold standard") | |||||
| Total population | Condition positive | Condition negative | Prevalence = Σ Condition positive/Σ Total population | ||
| Test outcome |
Test outcome positive |
True positive | False positive (Type I error) |
Positive predictive value (PPV), Precision = Σ True positive/Σ Test outcome positive | False discovery rate (FDR) = Σ False positive/Σ Test outcome positive |
| Test outcome negative |
False negative (Type II error) |
True negative | False omission rate (FOR) = Σ False negative/Σ Test outcome negative | Negative predictive value (NPV) = Σ True negative/Σ Test outcome negative | |
| Accuracy (ACC) = Σ True positive + Σ True negative/Σ Total population | True positive rate (TPR), Sensitivity, Recall = Σ True positive/Σ Condition positive | False positive rate (FPR), Fall-out = Σ False positive/Σ Condition negative | Positive likelihood ratio (LR+) = TPR/FPR | Diagnostic odds ratio (DOR) = LR+/LR− | |
| False negative rate (FNR) = Σ False negative/Σ Condition positive | True negative rate (TNR), Specificity (SPC) = Σ True negative/Σ Condition negative | Negative likelihood ratio (LR−) = FNR/TNR | |||
Applications
The F-score is often used in the field of information retrieval for measuring search, document classification, and query classification performance.[3] Earlier works focused primarily on the F1 score, but with the proliferation of large scale search engines, performance goals changed to place more emphasis on either precision or recall[4] and so is seen in wide application.
The F-score is also used in machine learning.[5] Note, however, that the F-measures do not take the true negatives into account, and that measures such as the Phi coefficient, Matthews correlation coefficient, Informedness or Cohen's kappa may be preferable to assess the performance of a binary classifier.[2]
The F-score has been widely used in the natural language processing literature, such as the evaluation of named entity recognition and word segmentation.
G-measure
While the F-measure is the harmonic mean of Recall and Precision, the G-measure is the geometric mean.[2]
 .
.
See also
- Precision and recall
- BLEU
- NIST (metric)
- METEOR
- ROUGE (metric)
- Word Error Rate (WER)
- Receiver operating characteristic
- Matthews correlation coefficient
- Uncertainty coefficient, aka Proficiency
References
- ↑ Van Rijsbergen, C. J. (1979). Information Retrieval (2nd ed.). Butterworth.
- ↑ 2.0 2.1 2.2 Powers, David M W (2011). "Evaluation: From Precision, Recall and F-Measure to ROC, Informedness, Markedness & Correlation" (PDF). Journal of Machine Learning Technologies 2 (1): 37–63.
- ↑ Beitzel., Steven M. (2006). On Understanding and Classifying Web Queries (Ph.D. thesis). IIT. CiteSeerX: 10
.1 ..1 .127 .634 - ↑ X. Li, Y.-Y. Wang, and A. Acero (July 2008). Learning query intent from regularized click graphs. Proceedings of the 31st SIGIR Conference.
- ↑ See, e.g., the evaluation of the CoNLL 2002 shared task.