European diaspora
| Total population | |
|---|---|
|
480,000,000 + 7% of the total world population Americas - approximately 446,394,000 Oceania - 23,185,000 | |
| Regions with significant populations | |
| European descended population | |
| 223,553,265[1] | |
| 91,051,646[2] | |
| 36,200,000[3] | |
| 25,186,890[4] | |
| 20,982,665 | |
| 20,100,000+[5][6] | |
| 17,519,500[7][8] | |
| [11] | |
| 7,160,399[12] | |
| 4,472,100[13] | |
| 3,5M-5,128,000[14][15] | |
| 3,500,000[5] | |
| 3,381,076[16] | |
| 3,064,862[17] | |
| 2,851,095[18] | |
| 2,000,000+[11] | |
| 2,000,000+[11] | |
| 1,4M-4,4M+[11][19] | |
| 1,400,000+[20] | |
| 1,300,000+[5] | |
| 1,000,000+[11] | |
| Languages | |
| Languages of Europe | |
| Religion | |
|
| |
| Related ethnic groups | |
| Europeans | |
The European diaspora refers to the communities throughout the world that are descended from the historic movement of Europeans, predominantly to the Americas, Africa, and Australasia, among other areas around the globe.
Emigration from Europe began on a large scale during the European colonial empires of the 17th to 19th centuries and continues to the present day. This concerns especially the Spanish Empire in the 16th to 17th centuries (expansion of the Hispanosphere), the British Empire in the 18th to 19th centuries (expansion of the Anglosphere), the Portuguese Empire and the Russian Empire in the 19th century (expansion to Central Asia and the Russian Far East).
From 1815 to 1932, 60 million people left Europe (with many returning home), primarily to "areas of European settlement" in the Americas (especially to the United States, Canada, Argentina and Brazil), Australia, New Zealand and Siberia.[21] These populations also multiplied rapidly in their new habitat; much more so than the populations of Africa and Asia. As a result, on the eve of World War One, 38% of the world’s total population was of European ancestry.[21]
In Asia, European-derived populations (specifically Russians) predominate in Northern Asia, which is part of the Russian Federation. Africa has no countries with European-derived majorities, but there are significant minorities in South Africa and Namibia.
The countries in the Americas that received a major wave of European immigrants from 1871 to 1960 were: the United States (27 million), Argentina (6.5 million), Brazil (4.5 million), Canada (4 million), Venezuela (more than 1 million),[22] Cuba (610,000), Uruguay (600,000); other countries received a more modest immigration flow (accounting for less than 10% of total European emigration to Latin America) were: Chile (183,000),[23] Peru (150,000),[24] and Mexico (25,000).[25][26][27]
Early emigration
- Egypt (Greeks in Egypt)[30]
- Hindukush and Northern India (Indo-Greeks)[31]
- Middle Ages
- Asia Minor (Slavs)[32]
- Greenland (Greenland Vikings)[33]
- Kingdom of Jerusalem (Franks) - 25-35% of the population[34][35]
Colonial period
The discovery of the Americas in 1492 stimulated a steady stream of voluntary migration from Europe. About 200,000 Spaniards settled in their American colonies prior to 1600, a small settlement compared to the 3 to 4 million Amerindians who lived in Spanish territory in the Americas. In Brazil the European emigration remained very small in the first two centuries of colonization: between 1500 and 1700, only 100,000 Portuguese settled there. However, the development of the mining economy in the 18th century raised the wages and employment opportunities in the Portuguese colony and the emigration grew: in the 18th century alone, about 600,000 Portuguese settled in Brazil, a mass emigration given that Portugal had a population of only 2 million people. In North America the immigration was dominated by British, Irish and other Northern Europeans.[36]
Post-independence emigration
Mass European emigration to the Americas happened in the 19th and 20th centuries. After the end of the Napoleonic Wars until 1920, some 60 million Europeans (and 10 million Asians) emigrated. Of these, 71% went to North America, 21% to Latin America (mainly Argentina and Brazil) and 7% to Australia. About 11 million of these people went to Latin America, of whom 38% were Italians, 28% were Spaniards and 11% were Portuguese.[37]
Between 1821 and 1880, 9.5 million Europeans settled in the United States, mainly Germans and Irish. Other waves included British and Scandinavian people. Despite the large number of immigrants arriving, people born outside of the United States formed a relatively small number of U.S. population: in 1910, foreigners were 14.7% of the country's population. Nothing similar to what happened in Argentina, which was the American country where immigrants had a larger impact in the ethnic composition. By 1914, 30% of Argentina's population was foreign-born, with 12% of its population born in Italy, the largest immigrant group. Next was Canada: by 1881, 14% of Canada's population was foreign-born, and the proportion increased to 22% in 1921. In Brazil the proportion of immigrants in the national population was much smaller, and immigrants tended to be concentrated in the central and Southern parts of the country. The proportion of foreigners in Brazil peaked in 1920, with just 7%, mostly Italians, Portuguese, and Spaniards.[36] In 1901–1920 immigration was responsible for only 7 percent of Brazilian population growth but in the years of high immigration, 1891–1900, the share was as high as 30 percent (higher than Argentina's 26% in the 1880s).[38]
Immigration arrivals in the nineteenth and twentieth centuries
| Destination | Years | Arrivals | Reference |
|---|---|---|---|
| 1821–1932 | 32,244,000 | [39] | |
| 1856–1932 | 6,405,000 | [39] | |
| 1831–1932 | 5,206,000 | [39] | |
| 1821–1932 | 4,431,000 | [39] | |
| 1821–1932 | 2,913,000 | [39] | |
| 1901–1931 | 857,000 | [39] | |
| 1881–1932 | 852,000 | [39] | |
| 1882–1932 | 726,000* | *Incomplete series[39] | |
| 1836–1932 | 713,000 | [39] | |
| 1821–1932 | 594,000 | [39] | |
| 1911–1931 | 226,000 | [39] |
By populations
| Country | Percentage of the local population | Population in (millions) | Year | Ref |
|---|---|---|---|---|
| 90.7 | 2.8 | 2011 Census | [18] | |
| 90 | 20 | 2006 Census | [40] | |
| 44.0 | 19.0 | Lizcano | [5] | |
| 76.7 | 25.1 | 2011 Census | [4] | |
| 75.8 | 3.1 | 2010 Census | [41] | |
| 74.0 | 2.9 | 2013 Census | [42] | |
| 72.4 | 223.5 | 2010 Census | [1] | |
| 64.1 | 7.2 | 2012 Census | [43] | |
| 40 | 1.7 or 3.8 | 2011 Latinobarometro survey, Lizcano | [5][44] | |
| 47.7 | 91.0 | 2010 Census | [45] | |
| 42.2 | 11.9 | 2011 Census | [46] | |
| 37.0 | 17 | Library of Congress Country Studies & Colombia a country study, 2010 |
[47][48][49] | |
| 20 or 30 | 3.5 or 5.1 | britannica.com & E.Medina-and-A.M.Kaempffer | [14][15] | |
| 20.0 | 1.3 | Lizcano | [5] | |
| 17.0 | 1 | CIA World Factbook | [50] | |
| 13.6 or 16 | 2.0 | Fuente: Encuesta Latin American Public Opinion Project, LAPOP, (2006 survey) & CIA World Factbook |
[51][52] | |
| 20 or 40 | 25.1 or 35.8 or 45 | CIA World Factbook & Lizcano | [5][6] | |
| 15.0 | 2.0 | CIA World Factbook | [53] | |
| 12.7 | ?? | 2007 Census | [54] | |
| 8.9 | 4.5 | 2011 Census | [55] | |
| 6.1 | 1.3 | 2010 Census | [56] | |
| 4.9 or 15 | 1.4 or 4.4 | 2006 Survey & CIA World Factbook | [19][57] |
The number above refer to those who self-described as white in the census. Exclude those who self describe as mixed race with European descent such as mestizo and mulatto.
By region
Nations and regions outside of Europe with significant populations of European ancestry:[58]

Africa
- Africa
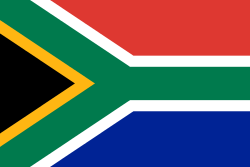 South Africa (White South African) - 9.6-13% of the population (mostly Afrikaners and British diaspora), Cape Coloureds have Afrikaner ancestry included with African and Asian ancestry from the 17th to 19th centuries.[59]
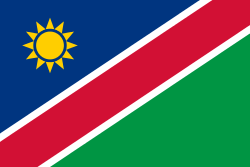 Namibia (White Namibians) - 6% of the population, of which most are Afrikaans-speaking, in addition to a German-speaking minority.[60]
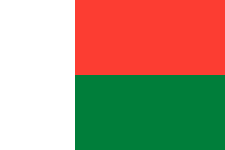 Madagascar (French people in Madagascar) - 113,000 people or 0.5% of the total population are white, mostly French. A further 76,000 are Réunionese Creole, bringing this total to 200,000 people and 1% of the total population.[61]
 Réunion (mostly of French descent) approx. 25% of the population.[62] Cafres usually have some degree of European descent.
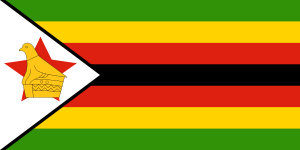 Zimbabwe - about 2% in the 2001 census. (Whites in Zimbabwe).
 Botswana - 5% European.[63]
 Kenya (Whites in Kenya).
 Algeria (Pied-noir).
 Mauritius (Franco-Mauritian).
 Senegal - French/European and Lebanese communities.[64]
 Canary Islands (Spaniards), known as Canarians.
 Seychelles (Franco-Seychellois).
 Saint Helena, Ascension and Tristan da Cunha (UK) - predominantly British.
 Swaziland - 3% of the population[65]
 Morocco - European expatriates, Spanish-descent Muslims (the Moorish era in Spain), Spanish Moroccan Roman Catholics from Spanish colonial time, and Franco-Moroccans from French colonial period.[66]
 Tunisia - Small community of Europeans.[67]
 Angola (Portuguese Angolans) - 1% are mostly Portuguese, with 2% are of mixed Portuguese and Angolan descent
 Mozambique (Portuguese Mozambicans) - 0.1% of the population is mostly Portuguese, with 0.2% of mixed Portuguese and native ancestry
About 0-1 percent of the populations in Côte d'Ivoire, Ghana, Guinea, Liberia, Nigeria and Sierra Leone, usually are in the professional business elites. Not limited to Europeans, the "white" population includes Arab peoples: Lebanese and Syrians.[64]
Asia
- Asia
 Vietnam - approximately 441,000 people or 0.5% of the total population are Vietnamese Eurasians, mainly of French and American ancestry from former French and American soldiers and settlers.[68]
 India (Anglo-Indian) - approximately 312,000 people or 0.02% of the total population are mixed White (mainly British) and Indian.[69]
 Bangladesh (Anglo-Indian, Firingis or Portuguese) approximately 113,000 people or 0.1% of the total population are the descendents of former British settlers who intermarried with local populations. People of Chittagong are mixture of Bengali, Portuguese and Arab descent.[70]
 Myanmar (Anglo-Burmese) - approximately 51,000 people or 0.1% of the total population are the descendents of former British settlers who intermarried with local populations.[71]
 Malaysia (Kristang people) - approximately 52,000 people or 0.2% of the total population are the descendents of former White settlers (including Portuguese, British, and Dutch) who intermaried with local populations.[72]
 Sri Lanka (Burghers)- often from settlers in former British, Dutch, French and Portuguese colonies.
 Siberia (Russians)[73] - most are Russians and Russified Ukrainians, with approximately 400,000 Russified ethnic Germans, a number are part-European.
 Kazakhstan (Russians in Kazakhstan, Tatars of Kazakhstan, Germans of Kazakhstan) - 31.5% of the population
 Uzbekistan - 7% of the population[74] (See Demographics of Uzbekistan).
 Kyrgyzstan - 13.5% of the population[75]
 Turkmenistan - 4% of the population[76]
 Tajikistan - Tajiks are ethnic relatives of both Turkic and Indo-Iranian peoples, but has a small European minority.
 Azerbaijan (Russians in Azerbaijan)[77]
 Georgia (Russians in Georgia)[78]
 Armenia - Armenia has a small minority of 21,000 Europeans, mostly of Russian and Ukrainian origin.[79]
 Mongolia - 0.5% of the population or approximately 12,000 people are European, mostly of Ukrainian or Russian descent.[80]
 China (Russians in China)
 Hong Kong (Britons in Hong Kong, Canadians in Hong Kong, Americans in Hong Kong, Russians in Hong Kong)[81]
 Macau (Macanese people) of Portuguese descent.
 Singapore (Eurasians in Singapore) - approximately 60,000 White people reside in Singapore, or 1.3% of the total population. An additional 46,000 Eurasians (or 1% of the total population) reside in Singapore, bringing this total to approximately 106,000 people or 2.3% of the total population.[82] Both these racial groups are mostly of British, Portuguese, and Dutch descent.
 Philippines (Filipino mestizo, Spanish settlement in the Philippines, American settlement in the Philippines) - Filipino-Eurasians, either of Spanish or U.S. American ancestry.
Today, the official percentage of Filipinos with Spanish ancestry is unknown. The Philippine Statistics Department does not account for the racial background or ancestry of an individual. The official population of all types of mestizos (Asian, American, Hispanic, etc.) that reside inside and outside of the Philippines remains unknown. Although a study provided by Stanford University[83] claimed that around 3.6% of the population have White or Caucasian ancestries from both Spanish and American colonization, it only genotyped 28 individuals from the Philippines, a sample size far too small to draw conclusions on a population of over 90 million people.
In addition there are different estimates of this mixed descent, either by the parent side, it is calculated that some 3,500,000 to 5,000,000. In other cases it is also estimated with a proximity of 17,000,000 to 36,550,197 (15-39% of the Philippine population) people of Hispanic descent. But none of these estimates are supported by genetic studies.[84]
 Indonesia (Indo people) - 14,000 people, mostly of mixed Indonesian and Dutch descent.[85]
 Cambodia - approximately 16,000 people or 0.1% of the total population are Cambodian Eurasians, mainly of French ancestry from former French settlers.[86]
 Pakistan (Anglo-Indian) (Anglo-Pakistani) - approximately 11,000 people or 0.005% of the total population are the descendents of former British settlers who intermarried with local populations.[87]
 East Timor - approximately 1,100 people or 0.08% of the total population are Portuguese, descended from former Portuguese settlers.[88]
 Laos - an unknown number of Eurasians with French ancestry who are the descendents of former French settlers reside in Laos.
 Christmas Island - approximately 13% of the total population are white, with a further 2% Eurasian, both are British Australian.[89]
_Islands.svg.png) Cocos (Keeling) Islands - 28.5% or one third of the total population are White, mostly British Australian.[90]
Cocos (Keeling) Islands - 28.5% or one third of the total population are White, mostly British Australian.[90]
Small communities of European and American expatriates live in East Asia, such as China, Japan, Korea and Thailand.
- The Middle East
 Lebanon (French Lebanese, Italian Lebanese, Greeks in Lebanon) - Small community of Europeans. (mainly from French, Italian, Greek and Americans from European origin) [91]
Small communities of European and American expatriates in the Persian Gulf countries like Bahrain, Kuwait, Qatar and the UAE; and in Aramco compounds in Saudi Arabia. Historically before 1970, small ethnic European (esp. Greek and Italian) enclaves were found in Egypt (Greeks in Egypt, Italian Egyptians) and Syria (Greeks in Syria).
Americas
Total European population in the Americas—approximately 446,394,000
Europeans in Northern America
- Northern America -- Total European population approximately 249,300,000
 Greenland - 12% of the population or about 7,000 people, however the Greenlandic people are of any Scandinavian (majority being Danes) or Inuit-Eskimo descent.[92]
 Canada (Euro-Canadian) - 80% of the population, or 28,000,000 people, mostly divided into Anglophone (18 million) and Francophone (10 million).[93]
 United States of America (European American) - 74% of the population, or 221,300,000 including Non-Hispanic Whites and White Hispanics.
Europeans in Latin America and the Caribbean
- Middle America (including Central America and the Caribbean) and South America (see White Latin American) -- Total European population approximately 197,094,000
 Argentina - 97% of the population or 38,913,000, may include a still unknown percentage of mestizos and mulattos.[94]
 Bahamas (European Bahamian) - 12% of the population or 39,600, the majority are African or other races.[95]
 Barbados (White Barbadian) - 4% of the population or 11,238, it's thought to be the highest of all British West Indies islands.[96]
 Bermuda - 34.1% of the population or 23,064, with a black or part-white/black majority.[97]
 Bolivia - 15% of the population or 1,636,000, the country except for Paraguay have the lowest white populations of South America.[98]
 Brazil (White Brazilian) - 49.7% of the population or 93,000,000. Another 42.6% are pardos of mixed White, African and/or Amerindian descent (showed by genetic research to be of predominant European ancestry). Afro-Brazilians by genetical research showed to be of about 37.1% European ancestry (the majority inherited by colonial or Imperial times and of Portuguese origin). Some people of claimed Asian and Indigenous origin can also have European descent.[99]
 Chile - 20% of population (4,500,000),[14] or 30% of the population (5,128,000) is from European descent;[15] Francisco Lizcano estimates whites Chilean in a cultural base (not ethnic) at 52.7% (9,100,000).[5]
 Colombia - 86% of the population are (white Colombian) or part white (mestizo or mulatto).[7][8]
 Costa Rica - up to 90% white and/or mestizo (European and Amerindian descent), or 3,827,000.[100]
 Cuba - 64.1% of the population or 7,160,399[101]
 Dominican Republic - 16% of the population or 1,655,959 is white and an additional 73% are mulatto or 7,555,311. In total, 89% of the Dominican population is either fully or partially of European ancestry.[102]
 Ecuador - 6% of the population or 940,000, while 72% are mestizos.[103]
 El Salvador - 9% of the population or 720,000, but the remainder 90% have some European ancestry.[104]
- French Guiana - 12% of the population or 26,000, but the French government insists all citizens of France regardless of race are "French".[105]
 Guatemala 18% of the population or 2,490,000 people.
 Haiti - 4% of the population in Haiti are white and mulatto (both African and European ancestry) and 1% European, or 97,000. White Haitians are chiefly of French, Italian, or German origin not including Middle Eastern & North American whites. This figure excludes the percentage of Haitians with less than noticeable European admixture.
 Jamaica - Approximately 2% of the population or 40,000 people are White, mainly British, American, and Portuguese (This number increases to 60,000 people and 3% of the total population when Arabs and Lebanese are included). However, the vast majority of the population in Jamaica have some degree of European Ancestry.[106]
- Martinique - 2% of the population or 8,000, with another 3% mulatto descent.[107]
 Mexico[108] (White Mexican) - About 18% of the population European or about 20,160,000, and an additional 72% of mixed European and Amerindian descent [109][110][111]
 Nicaragua - 17% of the population or 1,000,000 people, and 70% mestizo.[112]
 Panama 14.0% of the population is White of European origin or 352,000 people, 58.1% mestizo, 7% mulatto, 6.7% Amerindian, 5.5% Asian, and 7.1% other (2000 Census).
 Puerto Rico 75.8% of the population or 3,620,897 self identify as having European ancestry. 12.4% is of black or African-American ancestry and 8.5% are of other ancestry, including American Indian. 3.3% identify as mixed.[113]
 Peru (European Peruvian) - 15% of the population or 3,425,000, about 40% mestizo or partial European descent.[114]
 Trinidad and Tobago - 1.7% of European descent or 24,600, mainly British, Spanish, French, German, and Portuguese, with a number of Scandinavian descent, although 30-40% have East Indian or 5% are Lebanese/Syrian Arab backgrounds.[115]
 Venezuela (white Venezuelan) - 42,2% of the population or 11,490,018, about 49,9% are part white (mestizo or partial European descent.) making it 92,1% of the population white and/or mestizo (European and Amerindian descent) or 25,076,755.[116]
 Uruguay - 88% of the population or 3,074,000, the rest have various levels of European descent.[117]
- Saint Barthélemy—90% or 7,940; Saint Martin (Statistics not available).[118]
 Falkland Islands, 100% European of British descent—total population 3,140.
The Virgin Islands divided between U.S. Virgin Islands and the British Virgin Islands, each have a small European minority.
Oceania
- Oceania -- Total population of Europeans in Oceania is approximately 23,185,000 or approximately 22,818,000 excluding Hawaii.
 Australia (European Australian) - 93.2% of the population or 20,299,000 people. People of aboriginal extraction number about 548,400, of which approximately 60,000 can speak Australian languages or Kriol.[119]
 New Zealand (New Zealand European) - 59.1% of the population or 2,361,000, plus some Māori of mixed white-European descent.
 New Caledonia (Caldoche) - 44.6% of the population or about 112,050; the territory is under French rule.
 French Polynesia - 10% of the population (mostly French with some white Americans) or 26,700, and 6 to 8% are Euronesian (part white-Polynesian).[120]
 Hawaii - Europeans are 27.1% of the population (2008 survey) or 367,000 (called Haoles), although 65% of all Hawaiians have white-European descent.
 Guam - 10% of the population have Spanish and white American descent (2000 Census) or about 17,800 people. Guam has a history of Spanish settlement before 1900, now a U.S. territory.[121]
 Norfolk Island, about 50% British-Polynesian from Pitcairn Island (1,070 people) and 50% white-British descent mainly via Australia (1,070 people).
Contemporary European diasporas
- Albanian diaspora
- Armenian diaspora
- Basque diaspora
- Bosnian diaspora
- British diaspora
- Bulgarian diaspora
- Circassian diaspora
- Croatian diaspora
- Czech diaspora
- Dutch diaspora
- French diaspora
- German diaspora
- Greek diaspora
- Hungarian diaspora
- Icelandic diaspora
- Irish diaspora
- Italian diaspora
- European Jews (see also Jews in Europe)
- Kosovan diaspora
- Lithuanian diaspora
- Macedonian diaspora
- Maltese diaspora
- Polish diaspora
- Portuguese diaspora
- Romanian diaspora
- Russian diaspora
- Scottish diaspora
- Serbian diaspora
- Spanish diaspora
- Swedish diaspora
- Swiss diaspora
- Turkish diaspora
- Ukrainian diaspora
- Ruthenians or Rusyns
- Welsh diaspora
Potential emigrants
According to a 2010 Gallup study, an estimated 80 million adults in the European Union would prefer to emigrate if given free choice. About half of these would migrate to another country within the EU. The remaining 40 million have a desired destination outside of the EU, about 14 million would migrate to North America (USA or Canada), and 9 million to Australia or New Zealand.[122]
See also
- Emigration from Africa
- History of colonialism
- Immigration to Europe
- Indigenous people
- Western world
- Western culture
- White people
References
- ↑ 1.0 1.1 2010 United States Census statistics
- ↑ "Tabelas de resultados Branca Preta Amarela Parda Indígena Sem declaração" (PDF). 8 November 2011. Retrieved 2014-07-11.
- ↑ Francisco Lizcano Fernández (31 May 2005). "Composición Étnica de las Tres Áreas Culturales del Continente Americano al Comienzo del Siglo XXI" (PDF). Convergencia (México) (38): 185–232. ISSN 1405-1435. Retrieved 2014-07-11.
- ↑ 4.0 4.1 Ancestry in Canada
- ↑ 5.0 5.1 5.2 5.3 5.4 5.5 5.6 5.7 Fernández, Francisco Lizcano (2007). Composición Étnica de las Tres Áreas Culturales del Continente Americano al Comienzo del Siglo XXI. UAEM. ISBN 978-970-757-052-8.
- ↑ 6.0 6.1 "Mexico: People; Ethnic groups". CIA World Factbook. Retrieved 2007-11-26.
- ↑ 7.0 7.1 Bushnell, David & Rex A. Hudson (2010) "The Society and Its Environment"; Colombia: a country study: 87. Washingtion D.C.: Federal Research Division, Library of Congress.
- ↑ 8.0 8.1 "White Colombians" (PDF). Retrieved 2014-01-16.
- ↑ Resultado Basico del XIV Censo Nacional de Población y Vivienda 2011 Venezuela 2011 Census, (p. 14).
- ↑ http://www.ine.gob.ve/ INE : (adapted the % of 41,1% white people from the census with the actual new official census results
- ↑ 11.0 11.1 11.2 11.3 11.4 "Ethnic groups". The World Factbook. Central Intelligence Agency (CIA). Retrieved 2013-09-14.
- ↑ official 2012 Census
- ↑ /www.statssa.gov.za South Africa statistics.
- ↑ 14.0 14.1 14.2 "Chile". Encyclopædia Britannica. Retrieved 2012-09-15.
"Chile's ethnic makeup is largely a product of Spanish colonization. About three-fourths of Chileans are mestizo, a mixture of European and Amerindian ancestries. One fifth of Chileans are of white European (mainly Spanish) descent".
- ↑ 15.0 15.1 15.2 Ernesto Medina-Lois&Ana María Kaempffer Elementos de Salud Pública, Universidad de Chile. (See: Chapter 5.2.6 Estructura racial)
- ↑ Statistics New Zealand Highlights: Ethnic groups in New Zealand
- ↑ 2010 Census Data. "2010 Census Data". 2010.census.gov. Retrieved 2011-10-30.
- ↑ 18.0 18.1 "Atlas Sociodemografico y de la Desigualdad en Uruguay , 2011: Ancestry" (PDF) (in Spanish). National Institute of Statistics.
- ↑ 19.0 19.1 The Socioeconomic Advantages of Mestizos in Urban Peru. princeton.edu. pp. 4-5.
- ↑ Nacional de Estadística y Censo del Ecuador INEC.
- ↑ 21.0 21.1 "European Migration and Imperialism". Archived from the original on 2010-11-22. Retrieved 2013-09-14.
The population of Europe entered its third and decisive stage in the early eighteenth century. Birthrates declined, but death rates also declined as the standard of living and advances in medical science provided for longer life spans. The population of Europe including Russia more than doubled from 188 million in 1800 to 432 million in 1900. From 1815 through 1932, sixty million people left Europe, primarily to "areas of European settlement," in North and South America, Australia, New Zealand and Siberia. These populations also multiplied rapidly in their new habitat; much more so than the populations of Africa and Asia. As a result, on the eve of World War One (1914), 38 percent of the world’s total population was of European ancestry. This growth in population provided further impetus for European expansion, and became the driving force behind emigration. Rising populations put pressure on land, and land hunger and led to "land hunger." Millions of people went abroad in search of work or economic opportunity. The Irish, who left for America during the great Potato famine, were an extreme but not unique example. Ultimately, one third of all European migrants came from the British Isles between 1840 and 1920. Italians also migrated in large numbers because of poor economic conditions in their home country. German migration also was steady until industrial conditions in Germany improved when the wave of migration slowed. Less than one half of all migrants went to the United States, although it absorbed the largest number of European migrants. Others went to Asiatic Russia, Canada, Argentina, Brazil, Australia and New Zealand.
- ↑ http://www.asean-latin2012.com/venezuela.html "Between 1900 and 1958 more than one million Europeans immigrated to Venezuela."
- ↑ http://www.artehistoria.com/v2/contextos/2741.htm
- ↑ Giovanni Bonfiglio, Las migraciones internacionales como motor de desarrollo en el Perú, Museo Nacional Japonés Americano. Publicado el 1 de julio de 2008. Consultado el 30 de octubre de 2011.
- ↑ European Immigration into Latin America, 1870-1930
- ↑ La estructura social
- ↑ "Las migraciones internacionales como motor de desarrollo en el Perú ... | Articles | Discover Nikkei". discovernikkei.org. Retrieved 2014-07-11.
- ↑ Western North Africa, 1–500 A.D., The Metropolitan Museum of Art
- ↑ Archaeologists Find Celts In Unlikely Spot: Turkey, New York Times
- ↑ Diversity in the Desert: Daily Life in Greek and Roman Egypt, 332 B.C.E. - 641 C.E.
- ↑ Alexander the Great and precious stones in Afghanistan, The Toronto Times
- ↑ Cyril and Methodius of Thessalonica: The Acculturation of the Slavs
- ↑ The Fate of Greenland's Vikings
- ↑ Benjamin Z. Kedar, "The Subjected Muslims of the Frankish Levant", in The Crusades: The Essential Readings, ed. Thomas F. Madden, Blackwell, 2002, pg. 244. Originally published in Muslims Under Latin Rule, 1100–1300, ed. James M. Powell, Princeton University Press, 1990. Kedar quotes his numbers from Joshua Prawer, Histoire du royaume latin de Jérusalem, tr. G. Nahon, Paris, 1969, vol. 1, pp. 498, 568-72.
- ↑ Crusaders 'left genetic legacy', BBC News
- ↑ 36.0 36.1 Boris Fautos - Fazer a América: a imigração em massa para a América Latina."
- ↑ A GRANDE IMIGRAÇÃO EUROPÉIA PARA O BRASIL E O IMIGRANTE ESPANHOL NO CENÁRIO DA CAFEICULTURA PAULISTA: ASPECTOS DE UMA (IN)VISIBILIDADE
- ↑ EUROPEAN IMMIGRATION INTO LATIN AMERICA, 1870-1930*
- ↑ 39.0 39.1 39.2 39.3 39.4 39.5 39.6 39.7 39.8 39.9 39.10 Mass Migration to Modern Latin America
- ↑ 2006 Census Tables : Australia
- ↑ "Puerto Rico: People; Ethnic groups". 2010.census.gov. Retrieved 2011-04-14.
- ↑ 2013 New Zealand Census
- ↑ official 2012 Census |
- ↑ Informe Latinobarómetro 2011, Latinobarómetro (p. 58).
- ↑ 2010 Brazilian Census.
- ↑ Resultado Basico del XIV Censo Nacional de Población y Vivienda 2011, (p. 14).
- ↑ Library of Congress Country Studies. "Colombia: Race and Ethnicity". Retrieved on April 12, 2011.
- ↑ Colombia a country study, 2010 (pag 86,87) (English)
- ↑ Simon Schwartzman (25 July 2008). "Étnia, condiciones de vida y discriminación" (PDF). Retrieved 2014-07-11.
- ↑ "Nicaragua: People; Ethnic groups". CIA World Factbook. Retrieved 2007-11-26.
- ↑ "La variable étnico racial en los censos de población en la República Dominicana" (in Spanish). Oficina Nacional de Estadística.
- ↑ "D.R.: People; Ethnic groups". CIA World Factbook. Retrieved 2007-11-26.
- ↑ "Bolivia: People; Ethnic groups". CIA World Factbook. Retrieved 2007-11-26.
- ↑ www.digestyc.gob.sv Ethnic Groups -2007 official Census. Page 13.
- ↑ Census 2011: Census in brief (PDF). Pretoria: Statistics South Africa. 2012. ISBN 9780621413885.
- ↑ 2010 Ecuador Census
- ↑ "Peru: People; Ethnic groups". CIA World Factbook. Retrieved 2007-11-26.
- ↑ Ethnic groups by country. Statistics (where available) from CIA Factbook.
- ↑ South Africa: People: Ethnic Groups. World Factbook of CIA
- ↑ Namibia: People: Ethnic Groups. World Factbook of CIA
- ↑ "Country - Madagascar :: Joshua Project". joshuaproject.net. Retrieved 2014-07-11.
- ↑ La Reunion's population
- ↑ Botswana: People: Ethnic Groups. World Factbook of CIA
- ↑ 64.0 64.1 Senegal, About 50,000 Europeans (mostly French) and Lebanese reside in Senegal, mainly in the cities.
- ↑ Swaziland: People: Ethnic Groups. World Factbook of CIA
- ↑ Morocco: People: Ethnic Groups. World Factbook of CIA
- ↑ Tunisia: People: Ethnic Groups. World Factbook of CIA
- ↑ "Country - Vietnam :: Joshua Project". joshuaproject.net. Retrieved 2014-07-11.
- ↑ "Country - India :: Joshua Project". joshuaproject.net. Retrieved 2014-07-11.
- ↑ "Country - Bangladesh :: Joshua Project". joshuaproject.net. Retrieved 2014-07-11.
- ↑ "Country - Myanmar (Burma) :: Joshua Project". joshuaproject.net. Retrieved 2014-07-11.
- ↑ "Country - Malaysia :: Joshua Project". joshuaproject.net. Retrieved 2014-07-11.
- ↑ Fiona Hill, Russia — Coming In From the Cold?, The Globalist, 23 February 2004
- ↑ Robert Greenall, Russians left behind in Central Asia, BBC News, 23 November 2005.
- ↑ Kyrgyzstan: People: Ethnic Groups. World Factbook of CIA
- ↑ Turkmenistan: People: Ethnic Groups. World Factbook of CIA
- ↑ Southern Caucasus: Facing Integration Problems, Ethnic Russians Long For Better Life
- ↑ Georgia: Ethnic Russians Feel Insulated From Tensions, Radio Free Europe
- ↑ "Country - Armenia :: Joshua Project". joshuaproject.net. Retrieved 2014-07-11.
- ↑ "Country - Mongolia :: Joshua Project". joshuaproject.net. Retrieved 2014-07-11.
- ↑ HK Census. "HK Census." Statistical Table. Retrieved on 2007-03-08.
- ↑ "Country - Singapore :: Joshua Project". joshuaproject.net. Retrieved 2014-07-11.
- ↑ "A predominantly Indigenous Paternal Heritage for the Austronesian-Speaking Peoples of Insular Southeast Asia and Oceania" (PDF). Stanford University. Retrieved 2001.
- ↑ "Inmigración española en Filipinas". Wikipedia - en Español. Retrieved 2011.
- ↑ "Country - Indonesia :: Joshua Project". joshuaproject.net. Retrieved 2014-07-11.
- ↑ "Country - Cambodia :: Joshua Project". joshuaproject.net. Retrieved 2014-07-11.
- ↑ "Country - Pakistan :: Joshua Project". joshuaproject.net. Retrieved 2014-07-11.
- ↑ "Country - East Timor :: Joshua Project". joshuaproject.net. Retrieved 2014-07-11.
- ↑ "Country - Christmas Island :: Joshua Project". joshuaproject.net. Retrieved 2014-07-11.
- ↑ "Country - Cocos (Keeling) Islands :: Joshua Project". joshuaproject.net. Retrieved 2014-07-11.
- ↑ "The World Factbook". cia.gov. Retrieved 2014-07-11.
- ↑ Greenland
- ↑ Canadian Census 2006
- ↑ Argentina: People: Ethnic Groups. World Factbook of CIA
- ↑ Bahamas: People: Ethnic Groups. World Factbook of CIA
- ↑ Barbados: People: Ethnic Groups. World Factbook of CIA
- ↑ Bermuda: People: Ethnic Groups. World Factbook of CIA
- ↑ Bolivia: People: Ethnic Groups. World Factbook of CIA
- ↑ http://www.ibge.gov.br/home/estatistica/populacao/condicaodevida/indicadoresminimos/sinteseindicsociais2006/indic_sociais2006.pdf Tabela 9.1, Accessed: 18 August 2009
- ↑ "Costa Rica; People; Ethnic groups". CIA World Factbook. Retrieved 2007-11-21.
white (including mestizo) 94%
= 3.9 million whites and mestizos. - ↑ official 2012 Census
- ↑ Dominican Republic: People: Ethnic groups. World Factbook of CIA
- ↑ "Ecuador: People; Ethnic groups". CIA World Factbook. Retrieved 2014-03-19.
- ↑ El Salvador: People: Ethnic Groups. World Factbook of CIA
- ↑ French Guiana: People: Ethnic Groups. World Factbook of CIA
- ↑ "Country - Jamaica :: Joshua Project". joshuaproject.net. Retrieved 2014-07-11.
- ↑ Martinique: People: Ethnic Groups. World Factbook of CIA
- ↑ North America - Britannica Concise Encyclopedia
- ↑ Mexico :: Ethnic groups - Britannica Online Encyclopedia
- ↑ Mexico: People: Ethnic Groups. World Factbook of CIA
- ↑ "Mexico -- Encyclopedia Britannica". britannica.com. Retrieved 2014-07-11.
- ↑ "Nicaragua: People; Ethnic groups". CIA World Factbook. Retrieved 2007-11-15.
- ↑ "Puerto Rico: People: Ethnic Groups" (2014). CIA World Factbook, www.cia.gov. Retrieved May 23, 2014
- ↑ Peru: People: Ethnic Groups. World Factbook of CIA
- ↑ Trinidad French Creole
- ↑ Luis Ibarr (24 August 2012). "RESULTADOS BÁSICOS Censo 2011, Caracas, 09/08/2012" (PDF). Retrieved 2014-07-11.
- ↑ Uruguay: People: Ethnic Groups. World Factbook of CIA
- ↑ Fact Sheet on St. Barthélemy
- ↑ "Census of Population and Housing: Characteristics of Aboriginal and Torres Strait Islander Australians, 2011". Australian Bureau of Statistics. 27 November 2012. Retrieved 21 December 2014.
- ↑ French Polynesia: People: Ethnic Groups. World Factbook of CIA
- ↑ Brazil: People: Ethnic Groups. World Factbook of CIA
- ↑ Neli Esipova, Julie Ray, and Rajesh Srinivasan, The World’s Potential Migrants, Gallup, 2010., p. 8.
| ||||||||||||||||||||||||||||||||||