European Parliament election, 2004 (France)
European Parliament election, 2004 (France)

|
|
|
|
| 74 seats to the European Parliament |
| |
First party |
Second party |
Third party |
| |
 |
 |
 |
| Leader |
François Hollande |
Jean-Pierre Raffarin |
François Bayrou |
| Party |
PS |
UMP |
UDF |
| Last election |
22 seats |
13 seats |
9 seats |
| Seats won |
31 |
17 |
11 |
| Seat change |
+9 |
+5 |
+2 |
| Popular vote |
4,960,756 |
2,856,368 |
2,053,446 |
| Percentage |
28.9% |
16.6% |
11.9% |
| Swing |
+6.9 |
+3.82 |
+2.7 |
|
Elections to the European Parliament were held in France on 13 June 2004. The opposition Socialist Party made substantial gains, although this was mainly at the expense of minor parties. The governing Union for a Popular Movement and Union for French Democracy also made gains.
Seats
The elections were conducted in seven regional constituencies in metropolitan France, plus an eighth consisting of all overseas departments and territories. Allocation of seats was by proportional representation, with closed lists and no preferential voting, using the rule of the highest average, with a threshold of 5% of the votes in each.

French districts for European Parliamentary Elections. Multiple
MEPs are elected by proportional representation from each district. The outre-mer district is not shown.
| Constituency | Departements | Seats |
|---|
| Nord-Ouest | Lower Normandy, Upper Normandy, Nord-Pas-de-Calais, Picardy | 12 |
| Ouest | Brittany, Pays de la Loire, Poitou-Charentes | 10 |
| Est | Alsace, Burgundy, Champagne-Ardenne, Franche-Comté, Lorraine | 10 |
| Sud-Ouest | Aquitaine, Languedoc-Roussillon, Midi-Pyrénées | 10 |
| Sud-Est | Corsica, Provence-Alpes-Côte d'Azur, Rhône-Alpes | 13 |
| Massif-Central – Centre | Auvergne, Centre, Limousin |
6 |
| Île-de-France | Île-de-France | 14 |
Outre-Mer
(not shown) | French Polynesia, Guadeloupe, French Guiana, Martinique, Mayotte, New Caledonia, Réunion, Saint Pierre and Miquelon, Wallis and Futuna | 3 |
Results
Summary of the 13 June 2004 European Parliament election results in France
| Parties and coalitions |
Popular vote |
Seats |
| # |
% |
Change |
# |
Change |
|
Socialist Party (Parti socialiste) |
4,960,756 |
28.90 |
+6.95 |
31 |
+9 |
|
Union for a Popular Movement (Union pour un mouvement populaire) |
2,856,368 |
16.64 |
+3.82 |
17 |
+5 |
|
Union for French Democracy (Union pour la démocratie Française) |
2,053,446 |
11.96 |
+2.68 |
11 |
+2 |
|
National Front (Front national) |
1,684,947 |
9.81 |
+4.12 |
7 |
+2 |
|
The Greens (Les Verts) |
1,271,394 |
7.41 |
-2.31 |
6 |
-3 |
|
Movement for France (Mouvement pour la France) |
1,145,839 |
6.67 |
– |
3 |
– |
|
French Communist Party (Parti communiste français) – Alliance for the Overseas (Alliance pour l'Outre-mer) |
1,009,976 |
5.88 |
-0.9 |
3 |
-3 |
|
Workers' Struggle (Lutte ouvrière) – Revolutionary Communist League (Ligue communiste révolutionnaire) |
440,134 |
2.56 |
-2.62 |
0 |
-5 |
|
Hunting, Fishing, Nature, Traditions (Chasse, pêche, nature, traditions) |
297,273 |
1.73 |
-5.04 |
0 |
-6 |
|
Rally for France (Ralliement pour la France) |
291,234 |
1.70 |
-11.35 |
0 |
-13 |
|
Others |
1,155,991 |
6.74 |
|
0 |
±0 |
| |
| Total |
17,167,358 |
100 |
– |
78 |
-9 |
| |
| Valid votes | 17,167,358 | 96.70 |
|
| Spoilt and null votes | 585,245 | 3.30 |
| Votes cast / turnout | 17,752,603 | 42.76 |
| Abstentions | 23,765,992 | 57.24 |
| Registered voters | 41,518,595 |
|
| |
| Source: France-politique.fr |
Members elected
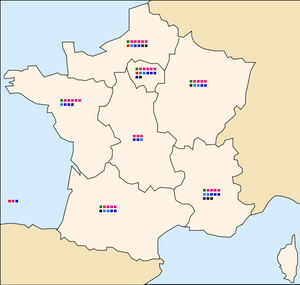
Map showing the number of MEPs and their parties by electoral district. One square represents one seat
See MEPs for France 2004 - 2009 for a national list in alphabetical order.
Ouest
Est
Sud-Ouest
Sud-Est
Massif-Central – Centre
Outre-mer
External links