European American
| |||||||||||||||||||||||||
| Total population | |||||||||||||||||||||||||
|---|---|---|---|---|---|---|---|---|---|---|---|---|---|---|---|---|---|---|---|---|---|---|---|---|---|
|
228,474,000[1] 74% of the total U.S. population in 2013 | |||||||||||||||||||||||||
| Regions with significant populations | |||||||||||||||||||||||||
| Continental United States, smaller populations in Alaska and Hawaii | |||||||||||||||||||||||||
| Languages | |||||||||||||||||||||||||
| English • German • Spanish • Italian • French • Polish • Dutch • Norwegian • Swedish • Danish • Portuguese • Russian • others | |||||||||||||||||||||||||
| Religion | |||||||||||||||||||||||||
|
Christianity: (Roman Catholicism · Orthodox Catholicism · Protestantism) Judaism · Islam Atheism · Agnosticism · Deism · Paganism | |||||||||||||||||||||||||
| Related ethnic groups | |||||||||||||||||||||||||
| European ethnic groups, White Americans | |||||||||||||||||||||||||


European Americans (also known as Euro-Americans) are Americans with ancestry from Europe.[2]
The Spanish were the first Europeans to establish a continuous presence in what is now the United States.[3] Martín de Argüelles born 1566, St. Augustine, Florida, was the first known person of European descent born in what is now the United States.[4] Twenty-one years later, Virginia Dare, born in 1587 on Roanoke Island in present-day North Carolina, was the first child born in the Thirteen Colonies to English parents.
In 2009, German Americans (16.7%), Irish Americans (11.8%), English Americans (9.0%) and Italian Americans (6.4%) were the four largest self-reported European ancestry groups in the United States forming 43.9% of the total population.[5] However, the English-Americans and British-Americans demography is considered a serious under-count as the stock tend to self-report and identify as simply 'Americans' due to the length of time they have inhabited America, subsequently they consider themselves indigenous.[6][7][8][9]
European Americans are not recognized as a group by the United States Census Bureau on their own, but are included in the category of "White". "White" is defined by the United States Census Bureau as "a person having origins in any of the original peoples of Europe, the Middle East, or North Africa".[10] According to the US Census, European Americans are merely a subset of white Americans, as the census still includes Latinos in the "white" category among other non-European "whites", despite Latinos often objecting to this classification by marking "Other" in the US Census form in the area for racial background.[11] In one study of self-classified European Americans, seventy percent, on average, had absolutely no African ancestry. The other thirty percent usually had just one African ancestor, amounting to an average of 0.7% African DNA for all European Americans.[12]
Terminology
Use
In 1995, as part of a review of the Office of Management and Budget's Statistical Policy Directive No. 15 (Race and Ethnic Standards for Federal Statistics and Administrative Reporting), a survey was conducted of census recipients to determine their preferred terminology for the racial/ethnic groups defined in the Directive. For the 'white' group, 'European American' came third, preferred by 2.35% of panel interviewees.[13] The term "European American" is not in popular use in the U.S. among the general public or in the mass media, and the terms "white" or "white American" are commonly used instead.
The term is used interchangeably with "Caucasian American", "White American", and "Anglo American" in many places around the United States.[14] "Anglo American" derives from the English speaking British colonists descended from the Angles tribes but refers to all English speaking White Americans/ While, European descended Americans (White Latinos) who have ancestors that spoke Spanish.[15] It is used in the southwestern United States in place of "White" or "European American". European American also has a more specific reference than either "White American" or "Caucasian American" since both of these terms include a larger group of people than what is acknowledged in Europe.[16][17] Also, whereas the terms "White American" and "Caucasian American" carry somewhat ambiguous definitions, depending on the speaker, European American has a more specific definition and scope. According to linguist Janet Bing, the term "European American" has increased a little in use, especially among scholars.[18]
Origin
| Year | Number |
|---|---|
| 1850[19][20] | 19,553,068 |
| 1900[19][20] | 66,809,196 |
| 1950[19][20] | 134,942,028 |
| 2010[21] | 223,553,265 |
The term was coined by some to emphasize the European cultural and geographical ancestral origins of Americans in the same way that is done for African Americans and Asian Americans. A European American awareness is still notable because 90% of the respondents classified as white on the U.S. Census knew their European ancestry.[22] Historically, the concept of an American was conceived in the U.S. as a person of European ancestry to the exclusion of African Americans and Native Americans.[23]
As a linguistic concern, the term is often meant to discourage a dichotomous view of the racial landscape between the normative white category and everyone else.[24] Margo Adair suggests that the recognition of specific European American ancestries allows certain Americans to become aware that they come from a variety of different cultures.[25]
History
| European-born population in the U.S 1850 - 2010[26][27][28] | ||||
|---|---|---|---|---|
| Year | Population | Share of total foreign-born population | ||
| 1850 | 2,031,867 | 92.2% | ||
| 1860 | 3,807,062 | 92.1% | ||
| 1870 | 4,941,049 | 88.8% | ||
| 1880 | 5,751,823 | 86.2% | ||
| 1890 | 8,030,347 | 86.9% | ||
| 1900 | 8,881,548 | 86.0% | ||
| 1910 | 11,810,115 | 87.4% | ||
| 1920 | 11,916,048 | 85.7% | ||
| 1930 | 11,784,010 | 83.0% | ||
| 1960 | 7,256,311 | 75.0% | ||
| 1970 | 5,740,891 | 61.7% | ||
| 1980 | 5,149,572 | 39.0% | ||
| 1990 | 4,350,403 | 22.9% | ||
| 2000 | 4,915,557 | 15.8% | ||
| 2010 | 4,817,437 | 12.1% | ||
| European Emigration 1820-1978[29][30] | |
|---|---|
| Country | Total |
| Germany1 | 6,978,000 |
| Italy | 5,294,000 |
| Great Britain | 4,898,000 |
| Ireland | 4,723,000 |
| Austria-Hungary1, 2 | 4,315,000 |
| Russia1, 2 | 3,374,000 |
| Sweden | 1,272,000 |
| Norway | 856,000 |
| France | 751,000 |
| Greece | 655,000 |
| Portugal | 446,000 |
| Denmark | 364,000 |
| Netherlands | 359,000 |
| Finland | 33,000 |
| Total | 34,318,000 |
| Note: Many returned to their country of origin
1 It may include Poles. See: Partitions of Poland | |
| U.S. Historical Populations [31] | ||
|---|---|---|
| Country | Immigrants Before 1790 |
Population (1790 est.)[32] |
| England* | 230,000 | 1,900,000 |
| Ulster Scot-Irish* | 135,000 | 320,000 |
| Germany[33]1 | 103,000 | 280,000 |
| Scotland* | 48,500 | 160,000 |
| Ireland | 8,000 | 200,000 |
| Netherlands | 6,000 | 100,000 |
| Wales* | 4,000 | 120,000 |
| France | 3,000 | 80,000 |
| Sweden and Other[34] | 500 | 20,000 |
| *British total | 417,500 | 2,500,000+ |
| Total[35] | 950,000 | 3,929,214 |
| African[36] immigrants before 1790:360,000, total ancestry in 1790:757,208. 1 It may include Poles. See: Partitions of Poland | ||
Since 1607, some 57 million immigrants have come to the United States from other lands. Approximately 10 million passed through on their way to some other place or returned to their original homelands, leaving a net gain of some 47 million people. Prior to 1960, the overwhelming majority came from Europe or European descent from Canada. In 1960 for example, 75.0% of foreign-born population in the U.S came from the region of Europe.[37]
Before 1881, the vast majority of immigrants, almost 86% of the total, arrived from northwest Europe, principally Great Britain, Ireland, Germany, and Scandinavia. The years between 1881 and 1893 the pattern shifted, in the sources of U.S. “New immigration”. Between 1894 and 1914, immigrants from southern, central, and eastern Europe accounted for 69% of the total.[38][39][40]
Colonial
Colonial stock, which mostly consists of people of English, Scottish, Scots-Irish or Welsh descent, may be found throughout the country but is especially dominant in New England and the the South. Some people of colonial stock, especially in the Mid-Atlantic states, are also of Dutch, German and Flemish descent. The vast majority of these are Protestants. The Pennsylvania Dutch (German American) population gave the state of Pennsylvania a high German cultural character. French descent, which can also be found throughout the country, is most concentrated in Louisiana, while Spanish descent is dominant in the Southwest and Florida. These are primarily Roman Catholic and were assimilated with the Louisiana Purchase and the aftermath of the Mexican-American War and Adams–Onís Treaty, respectively.
The first large wave of European migration after the Revolutionary War came from Northern and Central-Western Europe between about 1820 and 1890. Most of these immigrants were from Ireland, Germany, Sweden, Denmark, and Britain, and with large numbers of Irish and German Catholics immigrating, Roman Catholicism became an important minority religion. Polish Americans usually used to come as German or Austrian citizens, since Poland lost its independence in the period between 1772–1795. Descendants of the first wave are dominant in the Midwest and West, although German descent is extremely common in Pennsylvania, and Irish descent is also common in urban centers in the Northeast. The Irish and Germans held onto their ethnic identity throughout the 19th and early half of the 20th centuries, as well of other European ethnic groups. Most people of Polish origin live in the Northeast and the Midwest (See also White ethnic).
Second wave
| The top countries of origin for European immigrants (2010)[41] | ||||
|---|---|---|---|---|
| Country | Percent | |||
| 14.0% | ||||
| 13.0% | ||||
| 10.0% | ||||
| 8.0% | ||||
| 8.0% | ||||
| 7.0% | ||||
| 5.0% | ||||
| Rest of Europe | 35.0% | |||
The second wave of European Americans arrived from the mid-1890s to the 1920s, mainly from Southern, Central and Eastern Europe, as well as Ireland.[22] This wave included Irish, Italians, Greeks, Hungarians, Portuguese, Ukrainians, Russians, Poles and other Slavs. With large numbers of immigrants from Spain, Mexico, Spanish Caribbean, and South and Central America, White Hispanics have increased to 8% of the US population, and Texas, California, New York, and Florida are important centers for them.

Demographics
At the 2010 Census there were 223,553,265 "White Americans", which includes 26.7 million White Hispanic and Latino Americans. That is, there are 196.8 million "Non-Hispanic Whites" (63.7% of the total population) and 26,735,713 White Hispanic and Latino Americans (8.7% of the population). Non-Hispanic Whites together with White Hispanic and Latino Americans form the census category of "White Americans" - see Race and ethnicity.
The numbers below give numbers of European Americans as measured by the U.S. Census in 1980, 1990, and 2000. The numbers are measured according to declarations in census responses. This leads to uncertainty over the real meaning of the figures: For instance, as can be seen, according to these figures, the European American population dropped 40 million in ten years, but in fact this is a reflection of changing census responses. In particular, it reflects the increased popularity of the 'American' option following its inclusion as an example in the 2000 census forms.
It is important to note that breakdowns of the European American population into sub-components is a difficult and rather arbitrary exercise. Farley (1991) argues that "because of ethnic intermarriage, the numerous generations that separate respondents from their forbears and the apparent unimportance to many whites of European origin, responses appear quite inconsistent".[46]
In particular, a large majority of European Americans have ancestry from a number of different countries and the response to a single 'ancestry' gives little indication of the backgrounds of Americans today. When only prompted for a single response, the examples given on the census forms and a pride in identifying the more distinctive parts of one's heritage are important factors; these will likely adversely affect the numbers reporting ancestries from the British Isles. Multiple response ancestry data often greatly increase the numbers reporting for the main ancestry groups, although Farley goes as far to conclude that "no simple question will distinguish those who identify strongly with a specific European group from those who report symbolic or imagined ethnicity." He highlights responses in the Current Population Survey (1973) where for the main 'old' ancestry groups (e.g., German, Irish, English, and French), over 40% change their reported ancestry over the six-month period between survey waves (page 422).
An important example to note is that in 1980 23.75 million Americans claimed English ancestry and 25.85 claimed English ancestry together with one or more other. This represents 49.6 million people. The table below shows that in 1990 when only single and primary responses were allowed this fell to 32 million and in 2000 to 24 million.[47]
The largest self-reported ancestries in 2000, reporting over 5 million members, were in order: German, Irish, English, American, Italian, French, and Polish. They have different distributions within the United States; in general, the northern half of the United States from Pennsylvania westward is dominated by German ancestry, and the southern half by English and American. Irish may be found throughout the entire country.
Italian ancestry is most common in the Northeast, Polish in the Great Lakes Region, and French in New England and Louisiana. U.S. Census Bureau statisticians estimate that approximately 62 percent of European Americans today are either wholly or partly of English, Welsh, Irish, or Scottish ancestry. Approximately 86% of European Americans today are of northwestern and central European ancestry, and 14% are of southeastern European and White Hispanic and Latino American descent.
Culture
American cultural lineage
-3_new.jpg)
For the most part European American cultural lineage can be traced back to Western and Northern Europe and is institutionalized in the government, traditions, and civic education in the U.S.[49] The Solutrean hypothesis suggested that Europeans may have been among the first in the Americas.[50][51][52] More recent research has argued this not to be the case and that the founding Native American population came from Siberia through Beringia. An article in the American Journal of Human Genetics states "Here we show, by using 86 complete mitochondrial genomes, that all Native American haplogroups, including haplogroup X, were part of a single founding population, thereby refuting multiple-migration models."[53]
Since most later European Americans have assimilated into American culture, most European Americans now generally express their individual ethnic ties sporadically and symbolically and do not consider their specific ethnic origins to be essential to their identity; however, European American ethnic expression has been revived since the 1960s.[22] Southern Europeans, specifically Italian and Greeks (see Greek American), have maintained high levels of ethnic identity. Same applied to Polish Americans. In the 1960s, Mexican Americans, Jewish Americans, and African Americans started exploring their cultural traditions as the ideal of cultural pluralism took hold.[22] European Americans followed suit by exploring their individual cultural origins and having less shame of expressing their unique cultural heritage.[22]
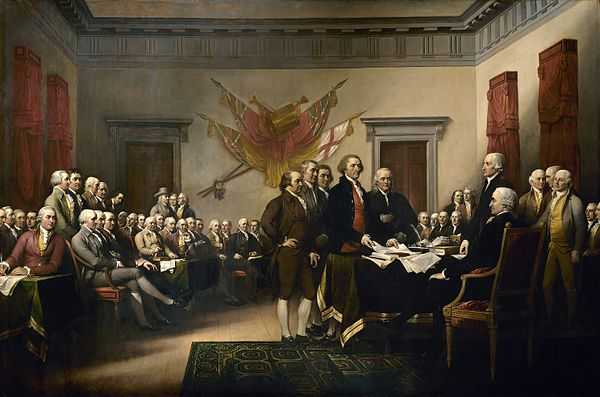
Much of American culture also shows influences from English culture. Icons are cultural symbols. American icons project who they are and what they believe as Americans. Icons can be persons, places, or objects that have been mythologized. American icons capture the American imagination.
American cultural icons
American flag
- Flag of the United States - Based on the British Grand Union Flag, which is considered to be the first national flag of the United States, and was first flown on December 2, 1775.
Cuisine
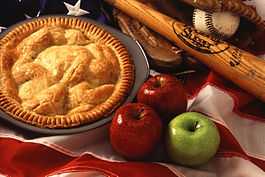
- Apple pie - New England was the first region to experience large-scale English colonization in the early 17th century, beginning in 1620, and it was dominated by East Anglian Calvinists, better known as the Puritans. Baking was a particular favorite of the New Englanders and was the origin of dishes seen today as quintessentially "American", such as apple pie and the oven-roasted Thanksgiving turkey.[54] "As American as apple pie" is a well-known phrase used to suggest that something is all-American.
- Roast Beef - In the middle of the 17th century a second wave of English immigrants began arriving in North America, settling mainly in the Chesapeake Bay region of Virginia and Maryland, expanding upon the Jamestown settlement. There roast beef was often served with Yorkshire puddings and horseradish sauce. (It was despised by the French.)
Thanksgiving
- Thanksgiving - In England, thanks have been given for successful harvests since pagan times. The celebrations on this day usually include singing hymns, praying, and decorating churches with baskets of fruit and food in the festival known as Harvest Festival, Harvest Home or Harvest Thanksgiving. In the U.S. it has become a national secular holiday (official since 1863) with religious origins, but in England it remains a Church festival giving thanks to God for the harvest. The first Thanksgiving was celebrated by English settlers to give thanks to God for helping the Pilgrims of Plymouth Colony survive the brutal winter.[55] The modern Thanksgiving holiday traces its origins from a 1621 celebration at the Plymouth Plantation, where the Plymouth settlers held a harvest feast after a successful growing season. William Bradford is credited as the first to proclaim the American cultural event which is generally referred to as the "First Thanksgiving".
Baseball
- Baseball - English lawyer William Bray recorded a game of baseball on Easter Monday 1755 in Guildford, Surrey; Bray's diary was verified as authentic in September 2008.[56][57] This early form of the game was apparently brought to North America by English immigrants. The first appearance of the term that exists in print was in "A Little Pretty Pocket-Book" in 1744, where it is called Base-Ball. Today, Rounders which has been played in England since Tudor times holds a similarity to Baseball. Although, literary references to early forms of "base-ball" in England pre-date use of the term "rounders".[58]
- American football - can be traced to early versions of rugby football, played in England and first developed in American universities in the mid-19th century.[59]
Music

Another area of cultural influence are American Patriotic songs:
- American national anthem - takes its melody from the 18th-century English song "To Anacreon in Heaven" written by John Stafford Smith from England for the Anacreontic Society, a men's social club in London and lyrics written by Francis Scott Key of English descent. This became a well-known and recognized patriotic song throughout the United States, which was officially designated as the U.S. national anthem in 1931.[60][61][62]
Before 1931, other songs served as the hymns of American officialdom.
- Amazing Grace - written by English poet and clergyman John Newton became such an icon in American culture that it has been used for a variety of secular purposes and marketing campaigns, placing it in danger of becoming a cliché.[63]
Motorcycle maker
- Harley-Davidson - co-founder was William S. Harley born to English parents, was one of the people who began the American motorcycle manufacturer.[64]
European ancestries table
| Ancestry | 1980 | % of U.S. 1980 | 1990 | % of U.S. 1990 | 2000 | % of U.S. 2000 | Change, 1990 to 2000 |
|---|---|---|---|---|---|---|---|
| 38,658 | 0.02% | 47,710 | 0.02% | 113,661 | 0.04% | +138.2% | |
| 214,362 | 0.09% | 296,672 | 0.1% | 385,488 | 0.1% | +29.3% | |
| no data | no data | 12,395,999 | 5.0% | 20,188,305 | 7.2% | +62.9% | |
| 948,558 | 0.42% | 864,783 | 0.3% | 730,336 | 0.3% | -15.5% | |
| 43,140 | 0.02% | 47,956 | 0.02% | 57,793 | 0.02% | +20.5% | |
| 25,639 | 0.2% | ||||||
| 360,277 | 0.16% | 380,403 | 0.2% | 348,531 | 0.1% | -08.4% | |
| 350,000 | 0.1% | ||||||
| ? | ? | 1,119,140 | 0.4% | 1,085,718 | 0.4% | -03.0% | |
| 42,504 | 0.02% | 29,595 | 0.01% | 55,489 | 0.02% | +87.5% | |
| 1,738 | |||||||
| 252,970 | 0.11% | 544,270 | 0.2% | 374,241 | 0.1% | -31.2% | |
| 4,897 | 7,643 | ||||||
| 1,892,456 | 0.84% | 1,296,369 | 0.5% | 1,258,452 | 0.4% | -02.9% | |
| 1,518,273 | 0.67% | 1,634,648 | 0.7% | 1,430,897 | 0.5% | -12.5% | |
| 6,304,499 | 2.78% | 6,226,339 | 2.5% | 4,541,770 | 1.6% | -27.1% | |
| 49,598,035 | 21.89% | 32,651,788 | 13.1% | 24,509,692 | 8.7% | -24.9% | |
| 25,994 | 0.01% | 26,762 | 0.01% | 25,034 | 0.01% | -06.5% | |
| 615,872 | 0.27% | 658,854 | 0.3% | 623,559 | 0.2% | -05.4% | |
| 12,892,246 | 5.69% | 10,320,656 | 4.1% | 13,172,178 | 4.0% | +27.6% | |
| 6,298 | |||||||
| 49,224,146 | 21.73% | 57,947,171 | 23.3% | 42,841,569 | 15.2% | -26.1% | |
| 959,856 | 0.42% | 1,110,292 | 0.4% | 1,153,295 | 0.4% | +03.9% | |
| 1,776,902 | 0.78% | 1,582,302 | 0.6% | 1,398,702 | 0.5% | -11.6% | |
| 32,586 | 0.01% | 40,529 | 0.02% | 42,716 | 0.01% | +05.4% | |
| 40,165,702 | 17.73% | 38,735,539 | 15.6% | 30,524,799 | 10.8% | -21.2% | |
| 12,183,692 | 5.38% | 14,664,189 | 5.9% | 15,638,348 | 5.6% | +06.6% | |
| 92,141 | 0.04% | 100,331 | 0.04% | 87,564 | 0.03% | -12.7% | |
| 1,244 | 0.0004 | ||||||
| 742,776 | 0.33% | 811,865 | 0.3% | 659,992 | 0.2% | -18.7% | |
| 45,139 | 0.01% | -/+ 0% | |||||
| 57,200 | 0.02% | -/+ -6,927% | |||||
| 31,645 | 0.01% | 39,600 | 0.02% | 40,159 | 0.01% | +01.4% | |
| 7,859 | 0.003 | ||||||
| 486 | |||||||
| 80,000 | 0.03% | ||||||
| 3,453,839 | 1.52% | 3,869,395 | 1.6% | 4,477,725 | 1.6% | +15.7% | |
| 255,807 | 0.1% | ||||||
| 8,228,037 | 3.63% | 9,366,051 | 3.8% | 8,977,235 | 3.2% | -04.2% | |
| 1,024,351 | 0.45% | 1,148,857 | 0.5% | 1,173,691 | 0.4% | +02.2% | |
| 315,258 | 0.14% | 365,531 | 0.1% | 367,278 | 0.1% | +0.5% | |
| 2,781,432 | 1.23% | 2,951,373 | 1.2% | 2,652,214 | 0.9% | -10.1% | |
| 16,418 | 0.007% | 5,617,773 | 2.3% | 4,319,232 | 1.5% | -23.1% | |
| 10,048,816 | 4.44% | 5,393,581 | 2.2% | 4,890,581 | 1.7% | -09.3% | |
| 100,941 | 0.04% | 116,795 | 0.05% | 51,679 | 0.05% | -50% | |
| 776,806 | 0.3% | 1,882,897 | 0.8% | 797,764 | 0.3% | -57.6% | |
| 126,463 | 0.06 | 124,437 | 0.1% | 176,691 | 0.1% | +42% | |
| 538 | |||||||
| 94,528 | 0.04% | 360,858 | 0.1% | 299,948 | 0.1% | -16.9% | |
| 4,345,392 | 1.92% | 4,680,863 | 1.9% | 3,998,310 | 1.4% | -14.6% | |
| 981,543 | 0.43% | 1,045,492 | 0.4% | 911,502 | 0.3% | -12.8% | |
| 75,988 | 0.03% | 86,427 | 0.17% | 117,575 | 0.1% | +36% | |
| 730,056 | 0.32% | 740,723 | 0.3% | 892,922 | 0.3% | +20.5% | |
| 1,664,598 | 0.73% | 2,033,893 | 0.82% | 1,753,794 | 0.6% | -13.8% | |
| 328,547 | 0.1% | ||||||
| 1,968,696 | 0.7% | ||||||
| 425,099 | 0.2% | ||||||
| Total | 214,726,269 | 94.78% | 223,371,445 | 89.81% | 201,290,597 | 71.53% | -18,28% |
Notes
- Jewish Americans, particularly those of Ashkenazi and Sephardi descent, are a diaspora population with origins in South Western Asia, but are often classified as White rather than Asian. In addition, all of the original peoples of the Middle East are classified as White by the US Census Bureau.[112][113]
- Gypsy Americans are a diaspora group with origins in the Indian Subcontinent, but are sometimes classified as European.
- Armenia is physiographically entirely in Western Asia, but it has strong historical and sociopolitical connections with Europe. The population and area figures include the entire state respectively.
- Azerbaijan is often considered a transcontinental country in the Caucasus (Europe) and Western Asia. However the population and area figures are for the entire state. This includes the exclave of Nakhchivan and the region Nagorno-Karabakh that has declared, and de facto achieved, independence. Nevertheless, it is not recognized de jure by sovereign states.
- Georgia is often considered a transcontinental country in the Caucasus (Europe) and Western Asia. It is placed in Europe by numerous European and international organizations.
- Turkey is physiographically considered a transcontinental country in Western Asia and south-eastern Europe. However the population and area figures include the entire state, both the 5% European and 95% Asian portions.
- The 1980 census had 188,302,438 people report at least one specific ancestry out of the then total 226,545,805 United States population. Numbers and percents by ancestry group do not add to totals because persons reporting a multiple ancestry are included in more than one group. Responses of total were: Single ancestry 63% and Multiple ancestry 37%. See 1980 U.S. Census for details.
- "American ethnicity" - (1990 Census) 12,395,999 (5.0% of total U.S. population); (2000 Census) 20,188,305 (7.2%). Mostly of English, Scottish, Scotch-Irish and/or Welsh ancestry that they cannot trace, given its predominance in the upper South (such as Kentucky). Also, two-thirds of white Americans have two or more different European nationalities, often four or more, and many "American" respondents may be cases where the person does not think any one ancestry is dominant enough to identify with (one typical example might be a person who is 1/4 Irish, 1/4 German, 1/4 Scottish, 1/8 Swedish, and 1/8 French).
- "White Hispanic and Latino Americans" - (2000 Census) 16,907,852 or 48% identified themselves as "White" of the then total Hispanic population.
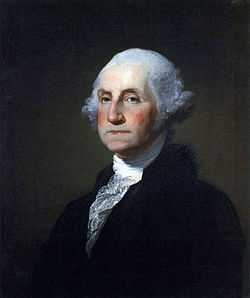
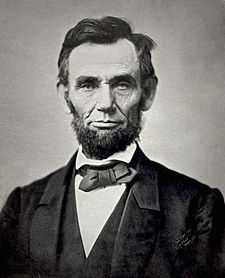
Presidents of European descent
Most of the heritage that all forty-four US presidents come from (or in some combination thereof): is British (English, Scottish, Scotch-Irish or Welsh) ancestry. Others include John F. Kennedy of Irish descent, Martin Van Buren of Dutch descent and two presidents whose fathers were of German descent: Dwight D. Eisenhower (whose original family name was Eisenhauer) and Herbert Hoover (Huber). Later U.S. Presidents' ancestry can often be traced to ancestors from multiple nations in Europe.[114]
|
|
Admixture
In a recent study, Gonçalves et al. 2007 reported Sub-Saharan and Amerindian mtDNA lineages at a frequency of 3.1% (respectively 0.90% and 2.2%) in white North Americans of European descent.[115]
Based on a study of U.S. Census Bureau figures from 1980, 1990, and 2000, Census Bureau statisticians determined that one out of three European Americans is descended from only one European ethnicity; one out of three is descended from two European nationalities; and one out of three is descended from three or more European ethnic origins.
Another study, Lao et al.2010 was done on a total of 664 Americans, among them, 246 were self-declared U.S. African Americans, 127 were self-declared U.S. Hispanic Americans, and 245 were self-declared U.S. European Americans from Temple and Killeen, TX, Louisville, KY, Baltimore, MD, Philadelphia, PA, Memphis, TN and Miami, FL and 46 were self-declared U.S. Asian Americans from the Fairfield, OH source. Self-declared U.S. Europeans showed on average 93.2% of European ancestry (95% CI from 73.23% to 98.09%).[116]
Chromosomal DNA, compared to mtDNA, tend to show a broader admixture in European Americans. DNA analysis of White Americans by geneticist Mark D. Shriver showed an average of 0.7% Sub-Saharan African admixture and 3.2% Native American admixture.[117] In another study, about 30% of all White Americans, approximately 66 million people, have a mean of 2.3% of Black African admixture.[118] Southern states with the highest African American populations, tended to have the highest percentages of hidden African ancestry.[119] Also, from the 23andMe database, about 5 to at least 13 percent of self-classified white American Southerners have greater than 1 percent African ancestry.[120]
See also
- European diaspora
- American Chamber of Commerce to the European Union
- Anglo
- Ethnic groups in Europe
- Hyphenated American
- Immigration to the United States
- Melting pot
- People of the United States
- White American
References
- ↑ Data Access and Dissemination Systems (DADS). "American FactFinder - Results". census.gov.
- ↑ "Euro-American". Merriam Webster Dictionary. Merriam-Webster, Incorporated. Retrieved March 13, 2014.
- ↑ "A Spanish Expedition Established St. Augustine in Florida". Library of Congress. Retrieved 2009-03-27.
- ↑ "Latino Chronology". google.co.uk. Retrieved 2015-02-04.
- ↑ 2009 American Community Survey 1-Year Estimates
- ↑ Sharing the Dream: White Males in a Multicultural America By Dominic J. Pulera.
- ↑ Reynolds Farley, 'The New Census Question about Ancestry: What Did It Tell Us?', Demography, Vol. 28, No. 3 (August 1991), pp. 414, 421.
- ↑ Stanley Lieberson and Lawrence Santi, 'The Use of Nativity Data to Estimate Ethnic Characteristics and Patterns', Social Science Research, Vol. 14, No. 1 (1985), pp. 44-6.
- ↑ Stanley Lieberson and Mary C. Waters, 'Ethnic Groups in Flux: The Changing Ethnic Responses of American Whites', Annals of the American Academy of Political and Social Science, Vol. 487, No. 79 (September 1986), pp. 82-86.
- ↑ Karen R. Humes, Nicholas A. Jones, and Roberto R. Ramirez, ed. (March 2011). "Definition of Race Categories Used in the 2010 Census" (PDF). United States Census Bureau. p. 3. Retrieved 17 May 2014.
- ↑ "The Census Can't Fit Latinos Into A Race Box And It's Causing More Confusion". The Huffington Post. 2014-05-22. Retrieved 2015-02-04.
- ↑ Steve Sailer (8 May 2002). "Race Now Part 2: How White Are Blacks? How Black Are Whites?". iSteve.com. UPI. Archived from the original on 2005-03-05. Retrieved 20 September 2014.
- ↑ "CPS Publications - A Test of Methods For Collecting Racial and Ethnic Information: May 1995 (Press Release)". Retrieved 24 March 2015.
- ↑ Lee, Sandra S. Mountain, Joanna. Barbara, Koenig A (2001). "The Meanings of Race in the New Genomics: Implications for Health Disparities Research" (PDF). Yale University. p. 54. Retrieved 2013-12-22.
- ↑ Thierry Devos; Kelly Gavin; Francisco J. Quintana (January 2010). "Say "Adios" to the American Dream? The Interplay Between Ethnic and National Identity Among Latino and Caucasian Americans". nih.com. pp. 37–49. Retrieved 2013-12-22.
- ↑ Mish, Frederic C., Editor in Chief Webster's Tenth New Collegiate Dictionary Springfield, Massachusetts, U.S.A.:1994--Merriam-Webster See original definition (definition #1) of Anglo in English: It is defined as a synonym for Anglo-American--Page 86
- ↑ "Anglo - Definitions from Dictionary.com; American Heritage Dictionary". Lexico Publishing Group, LLC. Archived from the original on 15 March 2008. Retrieved 2008-03-29.
Usage Note: In contemporary American usage, Anglo is used primarily in direct contrast to Hispanic or Latino. In this context it is not limited to persons of English or even British descent, but can be generally applied to any non-Hispanic white person, making mother tongue (in this case English) the primary factor. Thus in parts of the United States such as the Southwest United States with large Hispanic populations, an American of Polish, Irish, or German heritage might be termed an Anglo just as readily as a person of English descent. However, in parts of the country where the Hispanic community is smaller or nonexistent, or in areas where ethnic distinctions among European groups remain strong, Anglo has little currency as a catch-all term for non-Hispanic whites. Anglo is also used in non-Hispanic contexts. In Canada, where its usage dates at least to 1800, the distinction is between persons of English and French descent. And in American historical contexts Anglo is apt to be used more strictly to refer to persons of English heritage, as in this passage describing the politics of nation-building in pre-Revolutionary America: "The 'unity' of the American people derived ... from the ability and willingness of an Anglo elite to stamp its image on other peoples coming to this country" (Benjamin Schwarz).
- ↑ Bing, Janet (2001). "Wordmaster: September 2, 2001 - Race Terms". voanews.com. Retrieved 2013-12-22.
- ↑ 19.0 19.1 19.2 "Internet Archive Wayback Machine" (PDF). Retrieved 24 March 2015.
- ↑ 20.0 20.1 20.2 Census 2000 Summary File 1 (SF 1) 100-Percent Data Geographic Area: United States
- ↑ 2010 Census
- ↑ 22.0 22.1 22.2 22.3 22.4 Randolph, Gayle (2007). "Why Study European Immigrants". Iowa State University. Retrieved June 14, 2007.
- ↑ Crevecoeur, Hector St. John. Letters from an American Farmer. "What is an American." 1782.
- ↑ Bhopal, Raj. (1998). "White, European, Western, Caucasian or What? Inappropriate Labeling in Research on Race, Ethnicity and Health". PMC 1509085.
- ↑ Adair, Margo (1990). "Challenging White Supremacy Workshop" (PDF). cwsworkshop.org. Retrieved November 5, 2006.
- ↑ The official United States Census
- ↑ U.S 2010 Census figures
- ↑ www.migrationpolicy.org
- ↑ Nation-building in the United States.
- ↑ "European emigration statistics". Archived from the original on 2000-08-24.
- ↑ The source: a guidebook to American genealogy. By Loretto Dennis Szucs, Sandra Hargreaves Luebking
- ↑ Data From Ann Arbor, MI: Inter-university Consortium for Political and Social Research (ICPS).
- ↑ Germany in this time period consisted of a large number of separate countries, the largest of which was Prussia.
- ↑ The Other category probably contains mostly English ancestry settlers; but the loss of several states' census records in makes closer estimates difficult. The summaries of the 1790 and 1800 census from all states survived.
- ↑ Total represents total immigration over the approximately 130 year span of colonial existence of the U.S. colonies as found in the 1790 census. At the time of the American Revolution the foreign born population was estimated to be from 300,000 to 400,000.
- ↑ Several West African regions were the home to most African immigrants. Population from U.S. 1790 Census.
- ↑ "The New Americans". google.co.uk. Retrieved 2015-02-04.
- ↑ "EH.Net Encyclopedia: Immigration to the United States". Retrieved 24 March 2015.
- ↑ "MPI Data Hub Graph". Retrieved 24 March 2015.
- ↑ The source: a guidebook to American genealogy. By Loretto Dennis Szucs, Sandra Hargreaves Luebking
- ↑ http://www.migrationpolicy.org/sites/default/files/datahub/MPIDataHub-Region-birth-1960.xlsx www.migrationpolicy.org.]
- ↑ http://www.migrationpolicy.org/sites/default/files/datahub/MPIDataHub-Region-birth-1960.xlsx www.migrationpolicy.org]
- ↑ "European Immigrants in the United States". migrationpolicy.org. Retrieved 24 March 2015.
- ↑ "B04006, People Reporting Ancestry". 2009-2011 American Community Survey. United States Census Bureau. Retrieved November 23, 2012.
- ↑ "Yearbook of Immigration Statistics: 2011 Supplemental Table 2". U.S. Department of Homeland Security. Retrieved 2013-02-23.
- ↑ Farley, Reyonlds (1991). "Demography: The new census question on ancestry: what did it tell us?". jstor.org.
- ↑ World Culture Encyclopedia EveryCulture.com
- ↑ Mount Rushmore National Memorial. December 6, 2005.60 SD Web Traveler, Inc. Retrieved April 7, 2006.
- ↑ Kirk, Russell. The Heritage Lecture Series. "America Should Strengthen its European Cultural Roots." Washington D.C:1949
- ↑ Carey, Bjorn (19 February 2006). "First Americans may have been European". Life Science. Retrieved August 10, 2007.
- ↑ Conner, Steve, Science Editor (3 December 2002). "Does skull prove that the first Americans came from Europe?". utexas.edu. Retrieved August 14, 2007.
- ↑ Earliest humans in the Americas: new evidence from Mexico, Journal of Human Evolution 44, 379-387.
- ↑ Fagundes, Nelson J.R.; Kanitz, Ricardo; Eckert, Roberta; Valls, Ana C.S.; Bogo, Mauricio R.; Salzano, Francisco M.; Smith, David Glenn; Silva, Wilson A.; Zago, Marco A.; Ribeiro-dos-Santos, Andrea K.; Santos, Sidney E.B.; Petzl-Erler, Maria Luiza; Bonatto, Sandro L. "Mitochondrial Population Genomics Supports a Single Pre-Clovis Origin with a Coastal Route for the Peopling of the Americas". American journal of human genetics (volume 82 issue 3 pp.583 - 592).
- ↑ Fischer, pp. 74, 114, 134–39.
- ↑ William Bradford, Of Plymouth Plantation 1620–1647, 85
- ↑ "BBC NEWS - UK - England - Baseball 'origin' uncovered". bbc.co.uk. 2008-09-17. Retrieved 2015-02-04.
- ↑ "BBC - South Today - Features - Baseball history". bbc.co.uk.
- ↑ Telegraph staff and agencies (11 September 2008). "Major League Baseball told: Your sport is British, not American". Telegraph.co.uk (London).
- ↑ "The New American Sport History". google.co.uk. Retrieved 2015-02-04.
- ↑ "John Stafford Smith: Composer of the Star Spangled Banner".
- ↑ Star-Spangled Banner origins
- ↑ Lesley Nelson. "Star Spangled Banner". contemplator.com. Retrieved 2015-02-04.
- ↑ "'Amazing Grace'". NPR.org. 29 December 2002. Retrieved 24 March 2015.
- ↑ "Article Littleport - Clutch & Chrome - Motorcycles, Riding, Clubs, Events and more". Retrieved 24 March 2015.
- ↑ "2007 American Community Survey: Selected Population Profile in the United States - Albanian". United States Census Bureau.
- ↑ Armenan 2009 ACS 484,840 reported :Ancestry
- ↑ "2007 American Community Survey: Selected Population Profile in the United States - American". United States Census Bureau.
- ↑ "2007 American Community Survey: Selected Population Profile in the United States - Austrian". United States Census Bureau.
- ↑ "2007 American Community Survey: Selected Population Profile in the United States - Basque". United States Census Bureau.
- ↑ "2007 American Community Survey: Selected Population Profile in the United States - Belgian". United States Census Bureau.
- ↑ "2007 American Community Survey: Selected Population Profile in the United States - British". United States Census Bureau.
- ↑ "2007 American Community Survey: Selected Population Profile in the United States - Bulgarian". United States Census Bureau.
- ↑ "2000 U.S. Census Bureau, Catalonian". United States Census Bureau.
- ↑ "2007 American Community Survey: Selected Population Profile in the United States - Croatian". United States Census Bureau.
- ↑ "2008 American Community Survey: Selected Population Profile in the United States - Cypriot". United States Census Bureau.
- ↑ "2007 American Community Survey: Selected Population Profile in the United States - Czech". United States Census Bureau.
- ↑ "2007 American Community Survey: Selected Population Profile in the United States - Danish". United States Census Bureau.
- ↑ "2007 American Community Survey: Selected Population Profile in the United States - Dutch". United States Census Bureau.
- ↑ "2007 American Community Survey: Selected Population Profile in the United States - English". United States Census Bureau.
- ↑ "2007 American Community Survey: Selected Population Profile in the United States - Finnish". United States Census Bureau.
- ↑ "2007 American Community Survey: Selected Population Profile in the United States - French (except Basque)". United States Census Bureau.
- ↑ "2007 American Community Survey: Selected Population Profile in the United States - German". United States Census Bureau.
- ↑ "2007 American Community Survey: Selected Population Profile in the United States - Greek". United States Census Bureau.
- ↑ "2007 American Community Survey: Selected Population Profile in the United States - Hungarian". United States Census Bureau.
- ↑ "2007 American Community Survey: Selected Population Profile in the United States - Irish". United States Census Bureau.
- ↑ "2007 American Community Survey: Selected Population Profile in the United States - Italian". United States Census Bureau.
- ↑ "2007 American Community Survey: Selected Population Profile in the United States - Latvian". United States Census Bureau.
- ↑ 88.0 88.1 88.2 First, Second, and Total Responses to the Ancestry Question by Detailed Ancestry Code: 2000. This number includes both primary and secondary ancestry. (Retrieved on 2009-01-23. ).
- ↑ "2007 American Community Survey: Selected Population Profile in the United States - Lithuanian". United States Census Bureau.
- ↑ 90.0 90.1 factfinder.census.gov
- ↑ American Community Survey US Census Bureau
- ↑ 2000 US census Maltese ancestry.
- ↑ "2007 American Community Survey: Selected Population Profile in the United States - Norwegian". United States Census Bureau.
- ↑ Census 2000 Summary File 3 (SF 3) - Sample Data
- ↑ "2007 American Community Survey: Selected Population Profile in the United States - Polish". United States Census Bureau.
- ↑ "2007 American Community Survey: Selected Population Profile in the United States - Portuguese". United States Census Bureau.
- ↑ "2007 American Community Survey: Selected Population Profile in the United States - Romanian". United States Census Bureau.
- ↑ "2007 American Community Survey: Selected Population Profile in the United States - Russian". United States Census Bureau.
- ↑ "2007 American Community Survey: Selected Population Profile in the United States - Scots Irish". United States Census Bureau.
- ↑ "2007 American Community Survey: Selected Population Profile in the United States - Scottish". United States Census Bureau.
- ↑ "2007 American Community Survey: Selected Population Profile in the United States - Serbian". United States Census Bureau.
- ↑ "2007 American Community Survey: Selected Population Profile in the United States - Slovak". United States Census Bureau.
- ↑ "2007 American Community Survey: Selected Population Profile in the United States - Slovene". United States Census Bureau.
- ↑ "200 American Community Survey: Selected Population Profile in the United States - Sammarinese". United States Census Bureau. Retrieved 2009-01-23.
- ↑ "2007 American Community Survey: Selected Population Profile in the United States - Spaniard". United States Census Bureau.
- ↑ "2007 American Community Survey: Selected Population Profile in the United States - Swedish". United States Census Bureau.
- ↑ "2007 American Community Survey: Selected Population Profile in the United States - Swiss". United States Census Bureau.
- ↑
- ↑ "2007 American Community Survey: Selected Population Profile in the United States - Ukrainian". United States Census Bureau.
- ↑ "2007 American Community Survey: Selected Population Profile in the United States - Welsh". United States Census Bureau.
- ↑ 111.0 111.1 "2000 Census. Profile in the United States - European". United States Census Bureau.
- ↑ "No Evidence from Genome-Wide Data of a Khazar Origin for the Ashkenazi Jews" (PDF). Retrieved 2015-02-04.
- ↑ "Ancient human genomes suggest three ancestral populations for present-day Europeans" (PDF). Retrieved 2015-02-04.
- ↑ "The Presidents". americanheritage.com. Archived from the original on 2006-02-10.
- ↑ Sample of 1387 white North Americans of European descent catalogued in the FBI mtDNA population database, Gonçalves et al. 2007, Sex-biased gene flow in African Americans but not in American Caucasians
- ↑ Sample of 664 American individuals analyzed from various places, Lao et al. 2010, Evaluating Self-declared Ancestry of U.S. Americans With Autosomal, Y-chromosomal and Mitochondrial DNA
- ↑ Shriver, et al., "Skin pigmentation, biogeographical ancestry and admixture mapping, Hum Genet (2003) 112 : 387–39.
- ↑ Sailer, Steve (May 8, 2002). "Analysis: White prof finds he's not.". UPI.
- ↑ Scott Hadly, "Hidden African Ancestry Redux", DNA USA*, 23andMe, March 4, 2014.
- ↑ Ibid, Hadly.
| ||||||||||||||||||||||||||||||||||
| ||||||||||||||||||||||||||||||||||
| ||||||||||||||||||||||||||||||